U.S. Employment Report Shows Weakness in July, While Revisions Reduce Earlier Gains; Jobless Rate Picks Up
by:Tom Moeller
|in:Economy in Brief
Summary
- Recent job growth reduced by fewer factory & government jobs.
- Earnings gain remains steady y/y.
- Jobless rate reverses June decline.
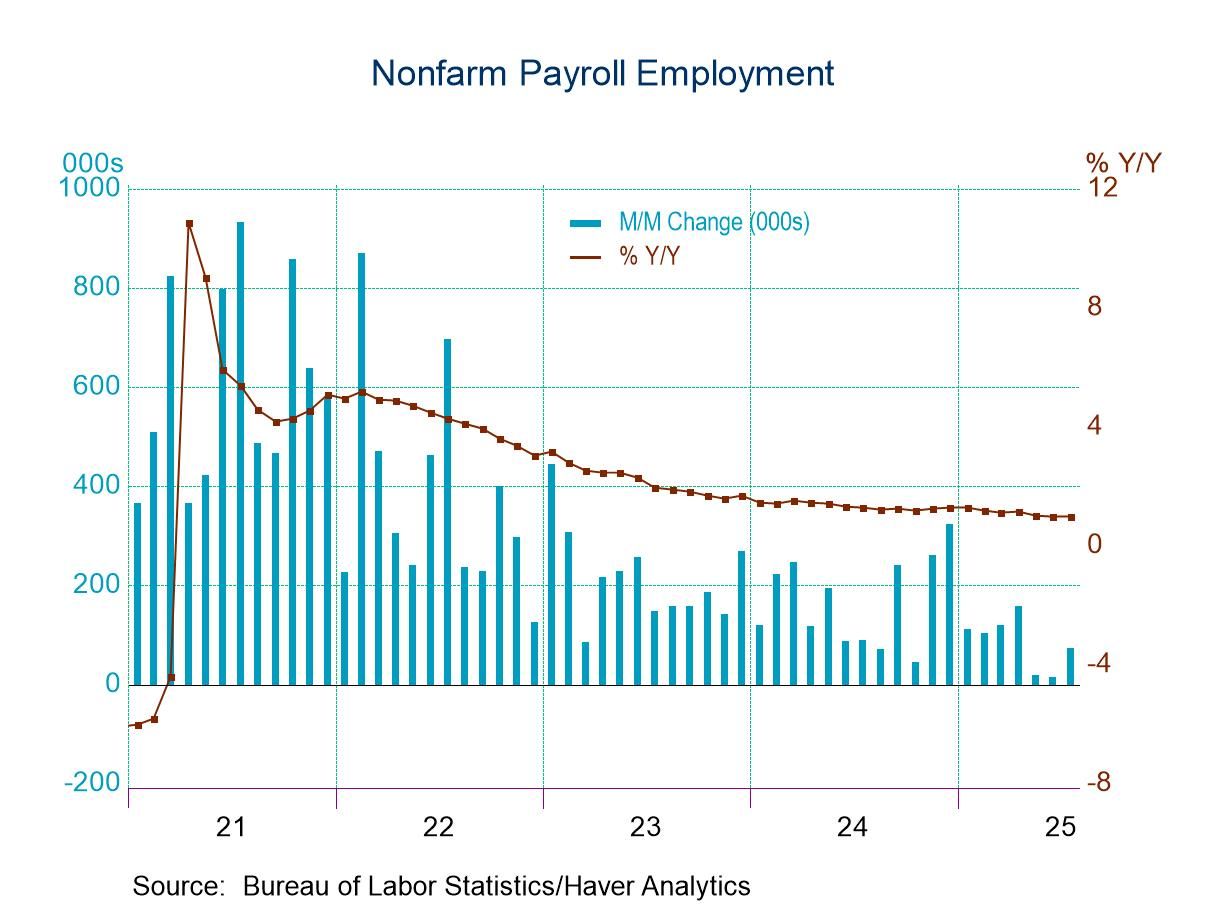
Nonfarm payrolls increased 73,000 during July after rising 14,000 in June, revised from 147,000, and 19,000 in May, revised from 144,000. Expectations had been for a 102,000 rise in the Action Economics Forecast Survey. The three-month average change in payrolls of 35,000 compared to 64,000 in June. The Bureau of Labor Statistics indicates that monthly revisions result from additional reports received from businesses and government agencies since the last published estimates.
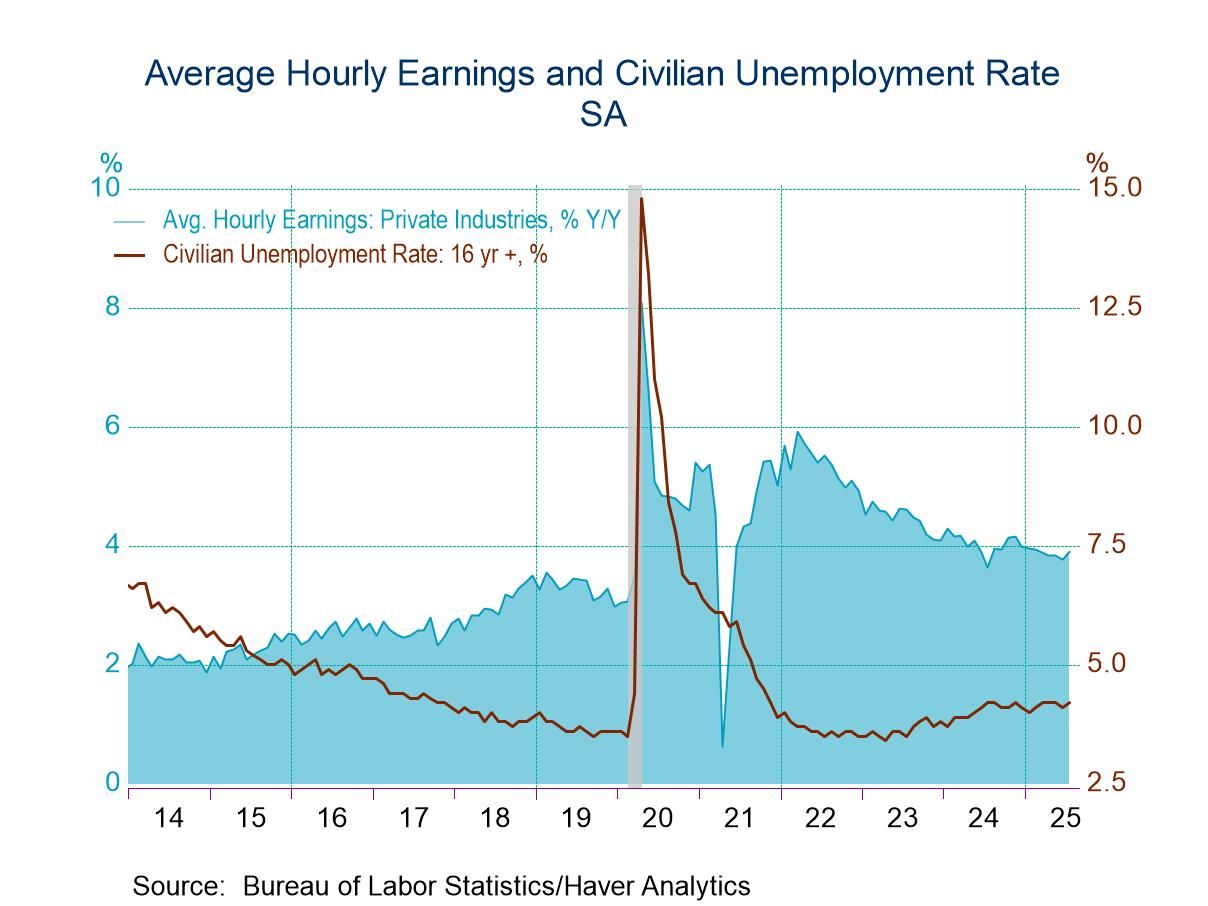
Average hourly earnings rose an expected 0.3% during July after unrevised gains of 0.2% and 0.4% in June & May. Earnings growth of 3.9% y/y is little changed over twelve months, but has been trending lower from its 5.9% high in March 2022.
The unemployment rate, measured in the household survey, edged up m/m to an expected 4.2% from 4.1% and compared to 4.2% in the previous three months. It reached a low of 3.4% in April 2023. The unemployment rate, including employees working part-time for economic reasons plus all marginally-attached workers, rose to 7.9% last month from 7.7% In June. It was 6.6% in April 2023.
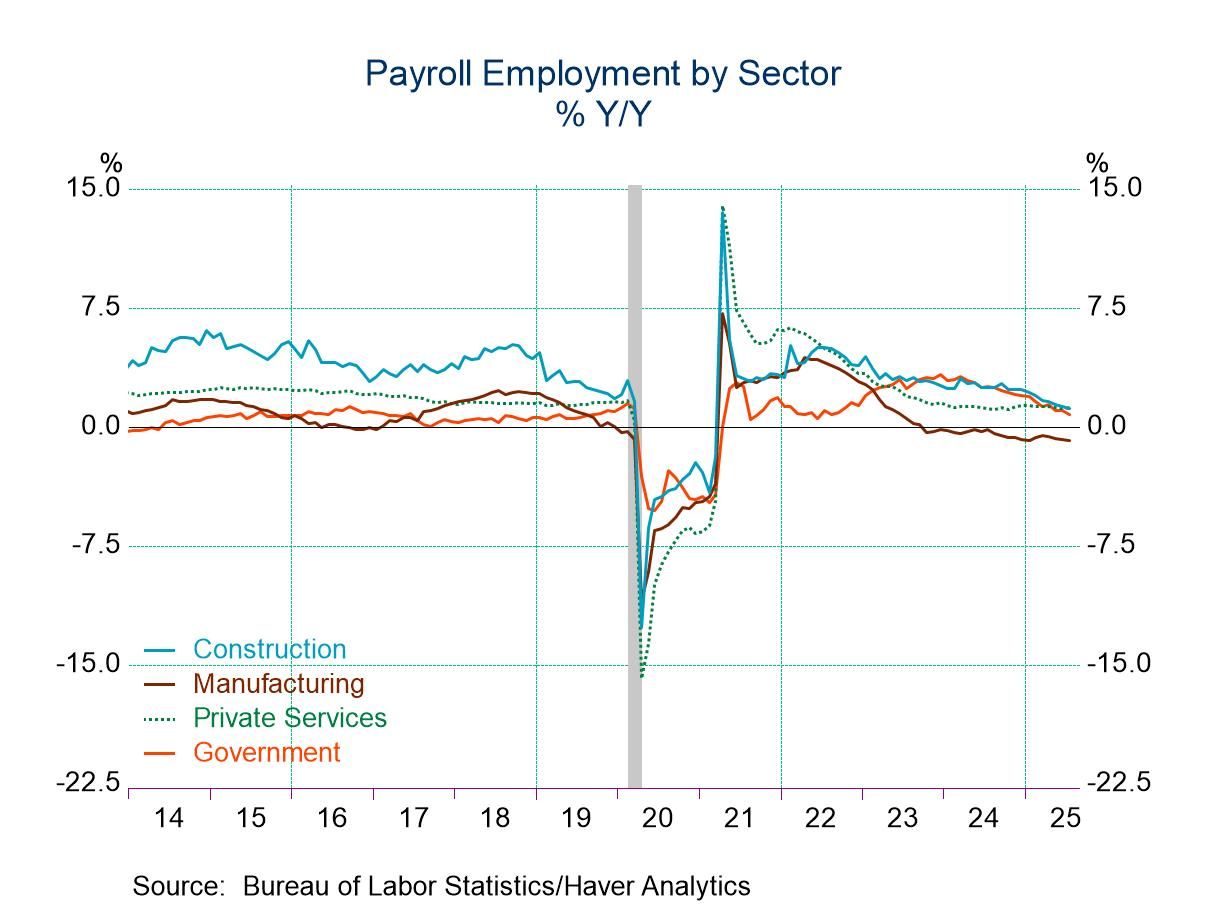
In the establishment survey, private-sector employment in July rose 83,000, factory sector jobs declined 11,000, off for the third straight month. Construction sector employment increased 2,000, after rising 3,000 in June. The number of mining & logging industry jobs declined 4,000 after falling in both of the prior two months.
Private service sector employment increased 96,000 July after improving 16,000 in June. Increases varied greatly amongst service sector categories. Private education & health sector employment rose 79,000 last month, following a 52,000 increase in June. The number of trade, transportation & utilities jobs gained 11,000, following a 22,000 decline and financial activities employment improved 15,000 after a 2,000 drop, while leisure & hospitality employment rose just 5,000 after a 4,000 gain. The number of professional & business services jobs fell 14,000, down for the third straight month. Information sector employment fell 2,000, after holding steady in June.
Government sector payrolls declined 10,000 last month and revered June’s 11,000 rise. Federal government employment weakened 12,000 and has fallen for six straight months. Local government employment eased 3,000 after rising 10,000 in June while state government payrolls rose 5,000 after increasing 10,000.
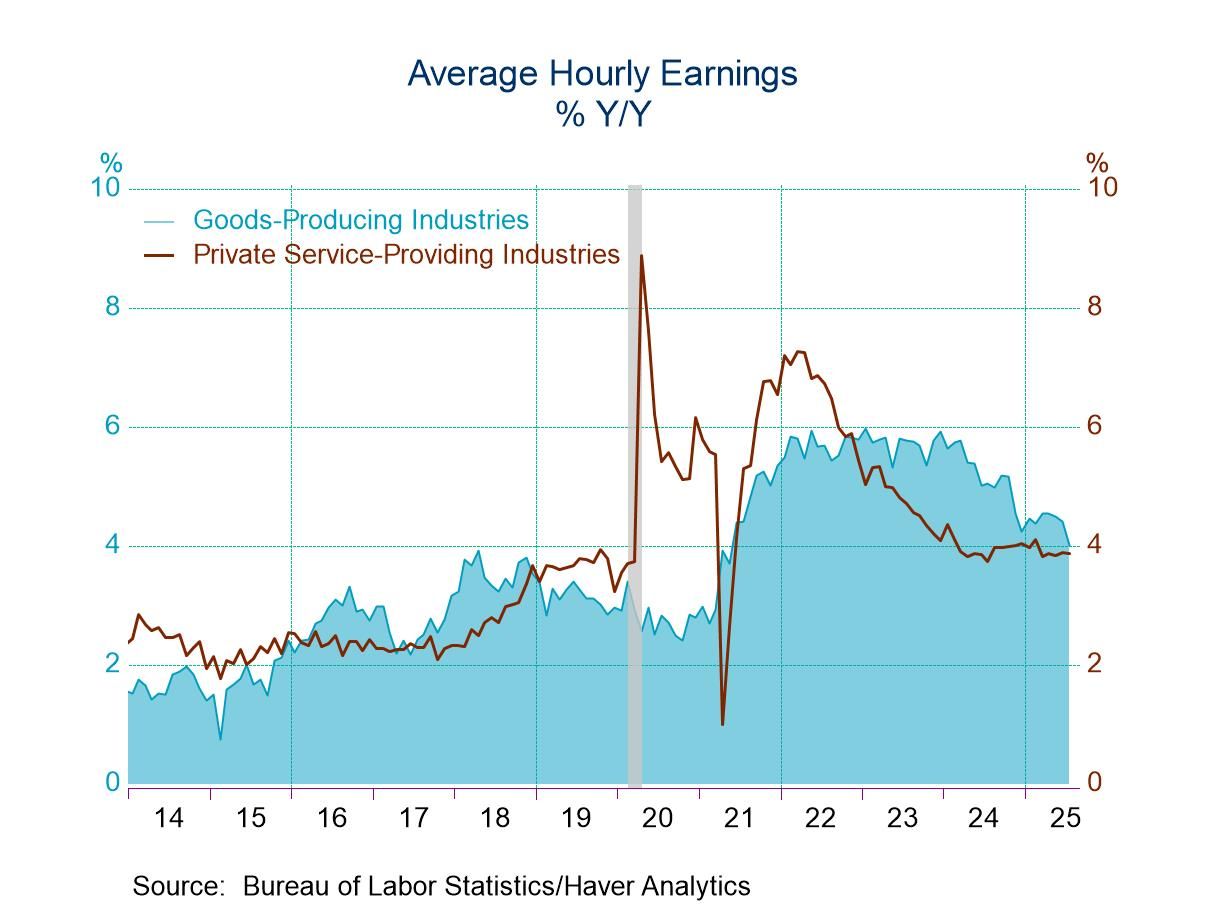
Private-sector average hourly earnings rose 0.3% (3.9% y/y) in July. Earnings in the goods-producing sector edged up 0.1% (3.6% y/y). In construction, earnings rose 0.2% (3.7% y/y) following a 0.4% rise, but factory sector earnings eased 0.1% (+3.6% y/y). In the service sector, earnings rose 0.4% (4.0% y/y) in July after increasing 0.2% in June.
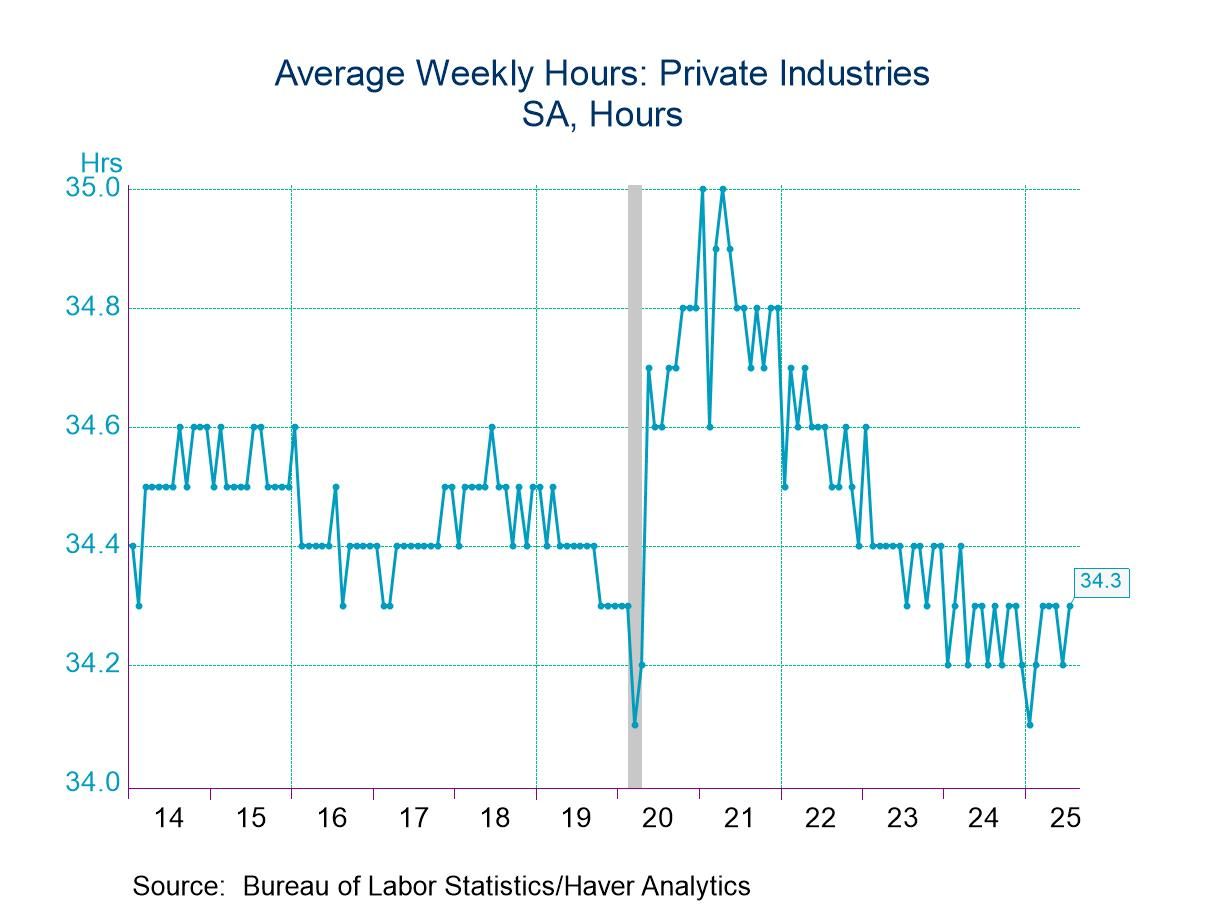
The length of the average workweek rose to 34.3 hours in July from 34.2 hours in June. The workweek in the goods-producing sector lengthened to 39.9 hours from 39.7 hours. The construction sector average workweek rose to 39.1 hours from 38.9 while the factory sector workweek held steady at 40.1 hours. The average workweek in the private service sector edged up to 33.2 hours from 33.1 hours.
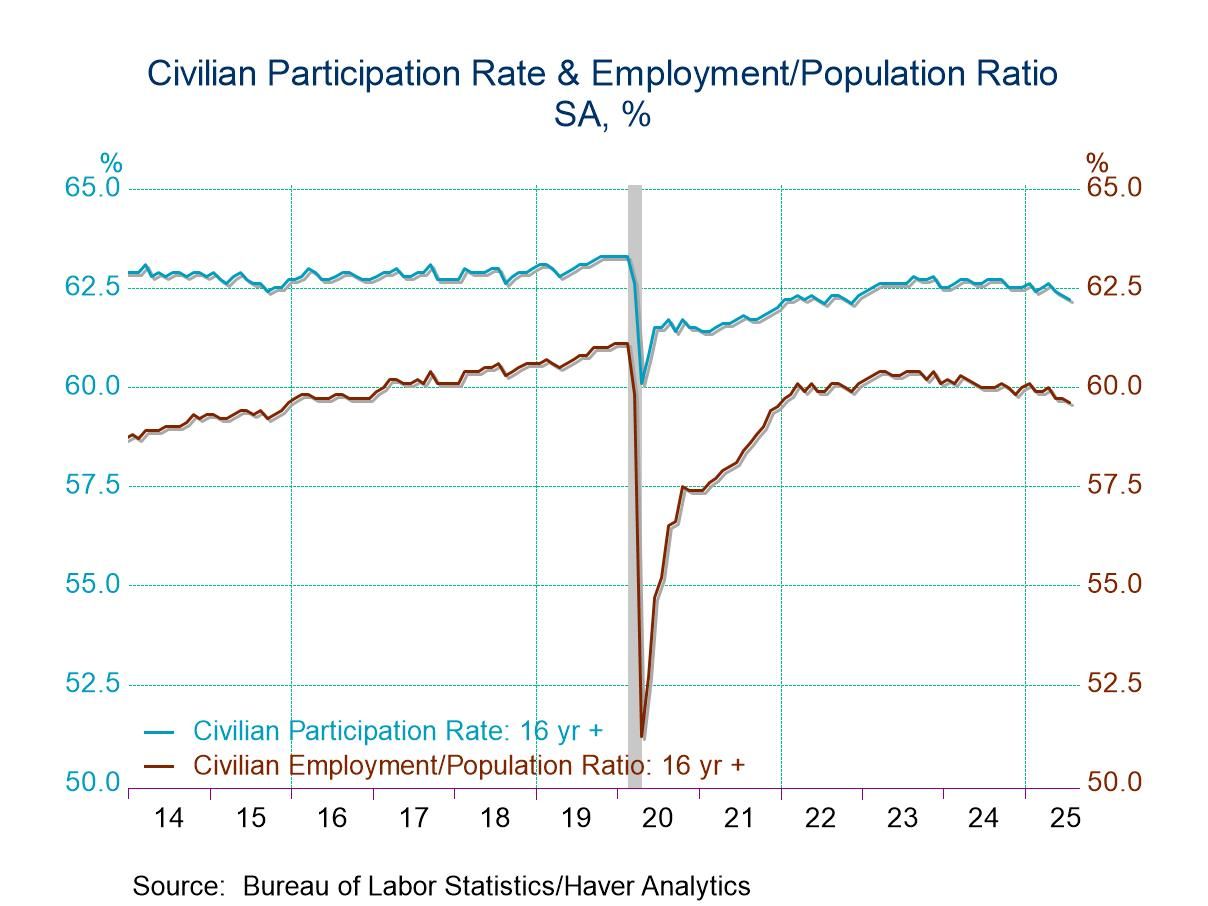
In the household survey, the unemployment rate increased to 4.2% in July after falling to 4.1% as employment fell 260,000 after rising 93,000 in June and the size of the labor force declined 38,000, off for the third straight month. The labor force participation rate eased to 62.2% last month from 62.3% and remained below the high of 63.3% early in 2020. The rate for teenagers declined to 35.0%, after plunging to 35.1%. For workers aged 20-24, the rate declined to 70.9%. For workers aged 25-54, the participation rate eased to 83.4%. For individuals 55 and over, the rate improved slightly to 38.1% but remained near a 20-year low of 38.0% in June.
The employment/population ratio for all workers slipped to 59.6% last month. It remained below the peak reading of 61.1% in February, 2020 just prior to the pandemic. For men, the rate fell to 64.7% in July from 64.9% and for women, the rate eased to 54.7% from 54.8% in June.
The employment and earnings data are collected from surveys taken each month during the week containing the 12th day of the month. The labor market data are contained in Haver's USECON database. Detailed figures are in the EMPL and LABOR databases. The expectations figures are in the AS1REPNA database.

Tom Moeller
AuthorMore in Author Profile »Prior to joining Haver Analytics in 2000, Mr. Moeller worked as the Economist at Chancellor Capital Management from 1985 to 1999. There, he developed comprehensive economic forecasts and interpreted economic data for equity and fixed income portfolio managers. Also at Chancellor, Mr. Moeller worked as an equity analyst and was responsible for researching and rating companies in the economically sensitive automobile and housing industries for investment in Chancellor’s equity portfolio. Prior to joining Chancellor, Mr. Moeller was an Economist at Citibank from 1979 to 1984. He also analyzed pricing behavior in the metals industry for the Council on Wage and Price Stability in Washington, D.C. In 1999, Mr. Moeller received the award for most accurate forecast from the Forecasters' Club of New York. From 1990 to 1992 he was President of the New York Association for Business Economists. Mr. Moeller earned an M.B.A. in Finance from Fordham University, where he graduated in 1987. He holds a Bachelor of Arts in Economics from George Washington University.
More Economy in Brief


 Global