 Global| Jul 31 2025
Charts of the Week: Markets Rally, Risks Linger
by:Andrew Cates
|in:Economy in Brief
Summary
Financial markets have performed well in recent weeks, lifted by stronger data, moderating inflation, and renewed soft landing hopes. Equities have pushed higher, volatility has eased, and credit markets have firmed. While economic policy uncertainty remains elevated, it is showing signs of normalising alongside greater clarity on US trade policy (chart 1). The US dollar, however, remains under pressure amid concerns about Fed independence and broader policy credibility (chart 2). The Fed’s decision on July 30th to leave policy on hold, despite two dissenting votes in favour of a cut, arguably did little to ease those concerns. Recent US trade agreements—particularly with Japan and Europe—have boosted sentiment, though questions linger over implementation. In Japan, trade policy uncertainty has surged amid vague deal terms, even as exports to the US have weakened (chart 3). In the euro area, M3 growth slowed in June as private credit softened, casting doubt on the durability of recent upside surprises (chart 4). UK retail data signal a sharp drop in consumer activity, consistent with past recessions (chart 5), and the change in US house prices has turned negative on a three-month basis—often a warning sign of broader economic weakness (chart 6). Overall, while market sentiment has improved, risks tied to credit, demand, and housing persist.
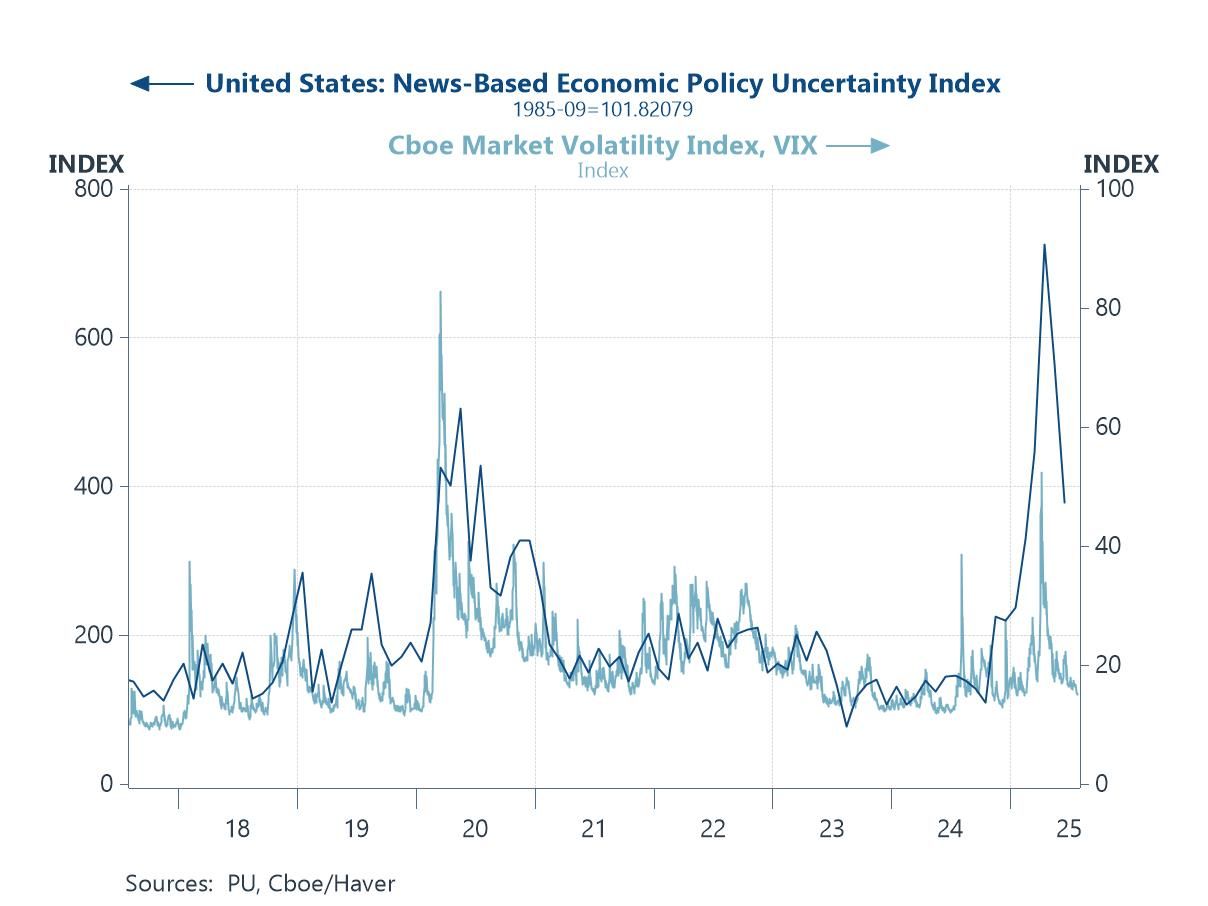
Uncertainty and market volatility Our first chart this week illustrates how both market volatility and economic policy uncertainty have started to ease following the sharp spikes seen earlier in 2025. The VIX has steadily declined in recent weeks, returning to levels closer to its long-term average as investors take comfort from stronger-than-expected US data, a steady disinflation trend, and renewed optimism around global trade. While the news-based policy uncertainty index remains elevated compared with historical norms, it too appears to be trending down, suggesting that the initial shock from tariff hikes and trade policy shifts is beginning to settle.
Chart 1: US economic policy uncertainty versus market volatility
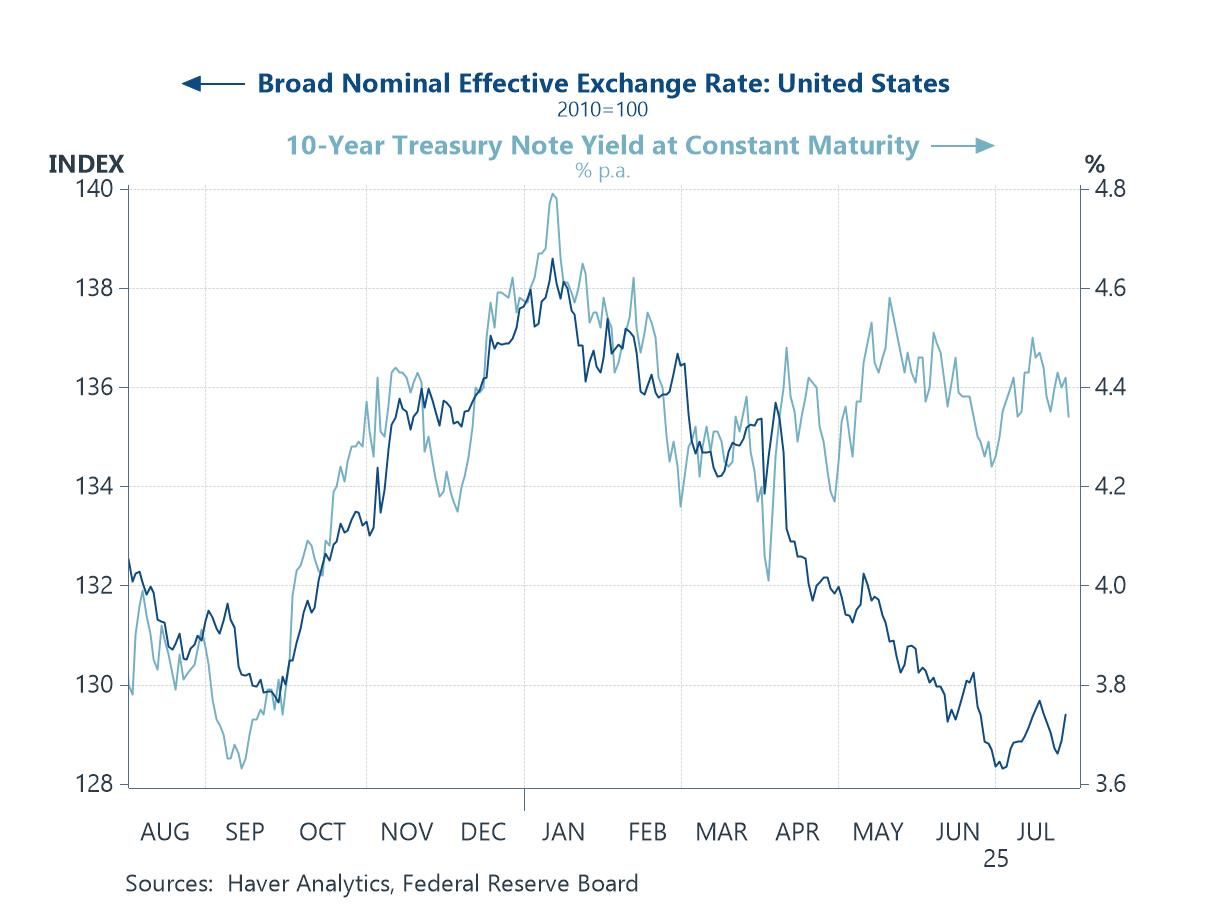
The US dollar, US yields and Fed independence This next chart highlights the marked decline in the broad nominal effective exchange rate of the US dollar since early 2025, alongside a modest drift lower in 10-year Treasury yields. While Treasury yields remain elevated by historical standards—hovering just above 4.3%—they have failed to sustain the highs seen earlier this year, partly perhaps because inflation has continued to moderate. At the same time, the dollar has depreciated steadily, partly reflecting growing market unease around the Federal Reserve’s policy credibility and institutional independence. Recent comments by President Trump, openly criticising Chair Jerome Powell, have reinforced investor concerns about political pressure on the Fed at a time when policy decisions are finely balanced.
Chart 2: US trade weighted value of the US dollar and 10-year US Treasury yields
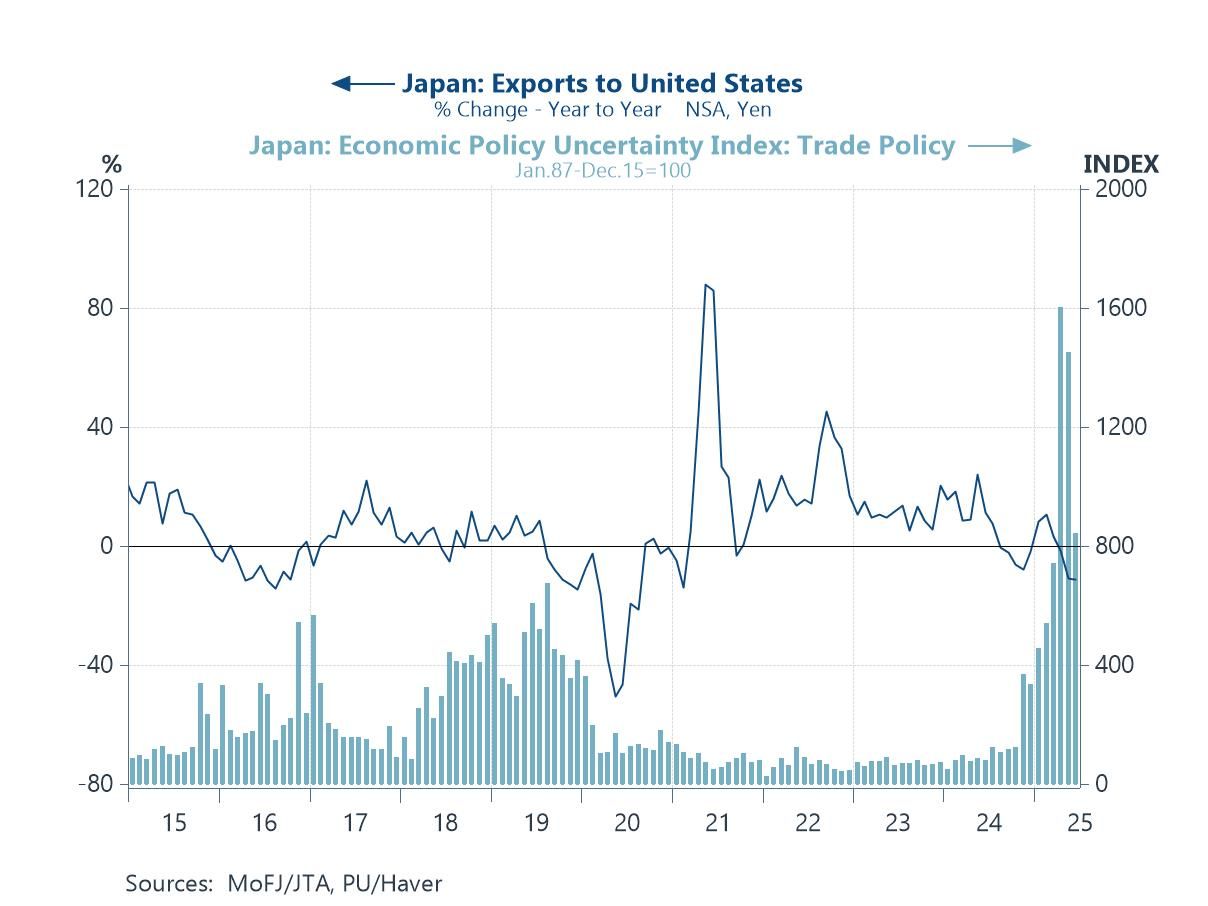
Japan’s trade with the US While the recent US–Japan trade agreement has helped soothe immediate tensions, the underlying economic relationship remains fragile. As this next chart shows, trade policy uncertainty in Japan has spiked sharply in recent months—reaching levels not seen since the height of global trade disruptions in 2020—even as exports to the US have begun to soften again. Though the agreement offered short-term relief for Japan’s auto and machinery sectors, many key details remain vague, especially surrounding the much-publicised $550 billion investment commitment.
Chart 3: Japan’s exports to the US and trade policy uncertainty
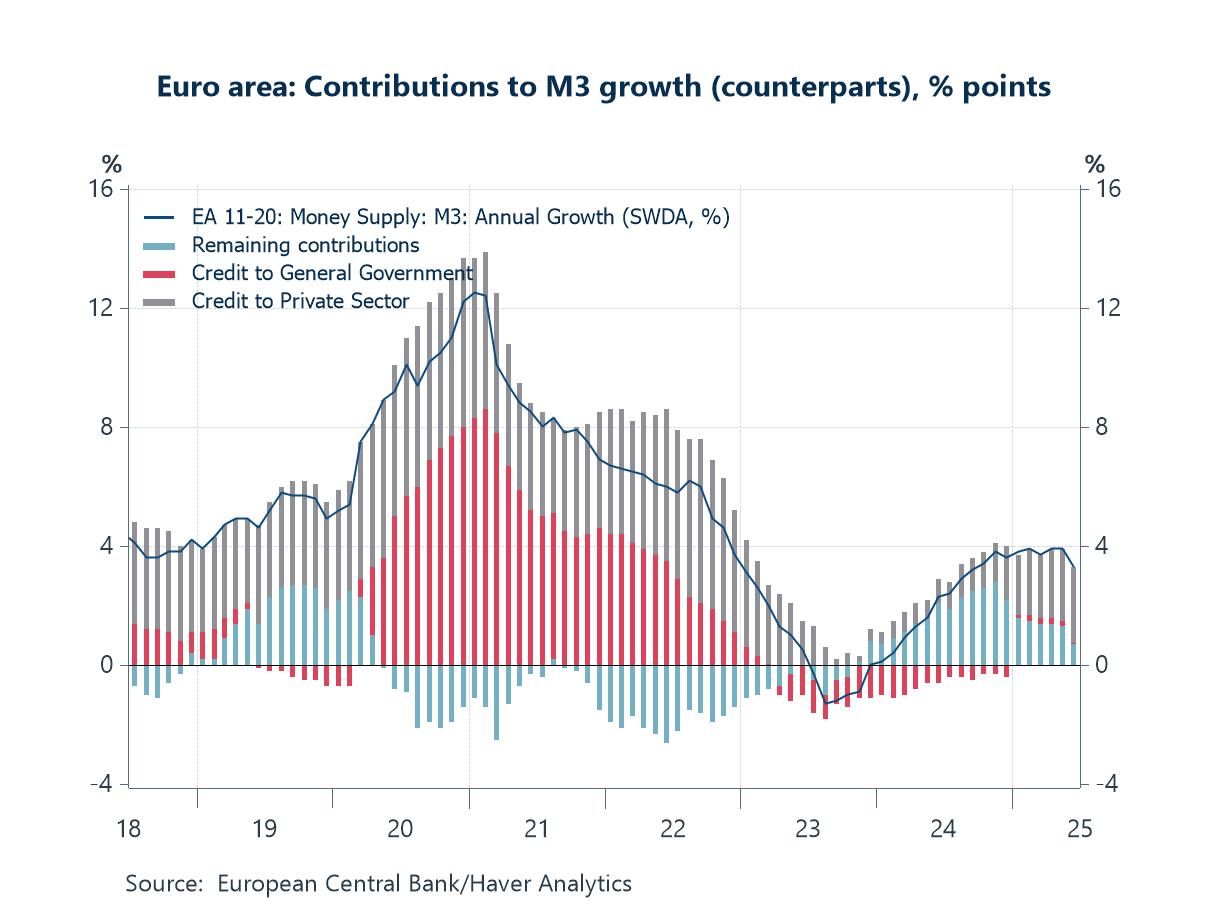
Credit growth in the euro area Latest data for June published this week show a clear slowdown in euro area M3 growth, with a notably softer contribution from private sector lending. After supporting the recovery over the past year, credit to households and firms is now losing momentum. This comes despite recent upside surprises in Q2’s GDP (and the broader dataflow), suggesting the recovery may be less credit-driven than before.
Chart 4: Euro area M3 growth and counterpart contributions
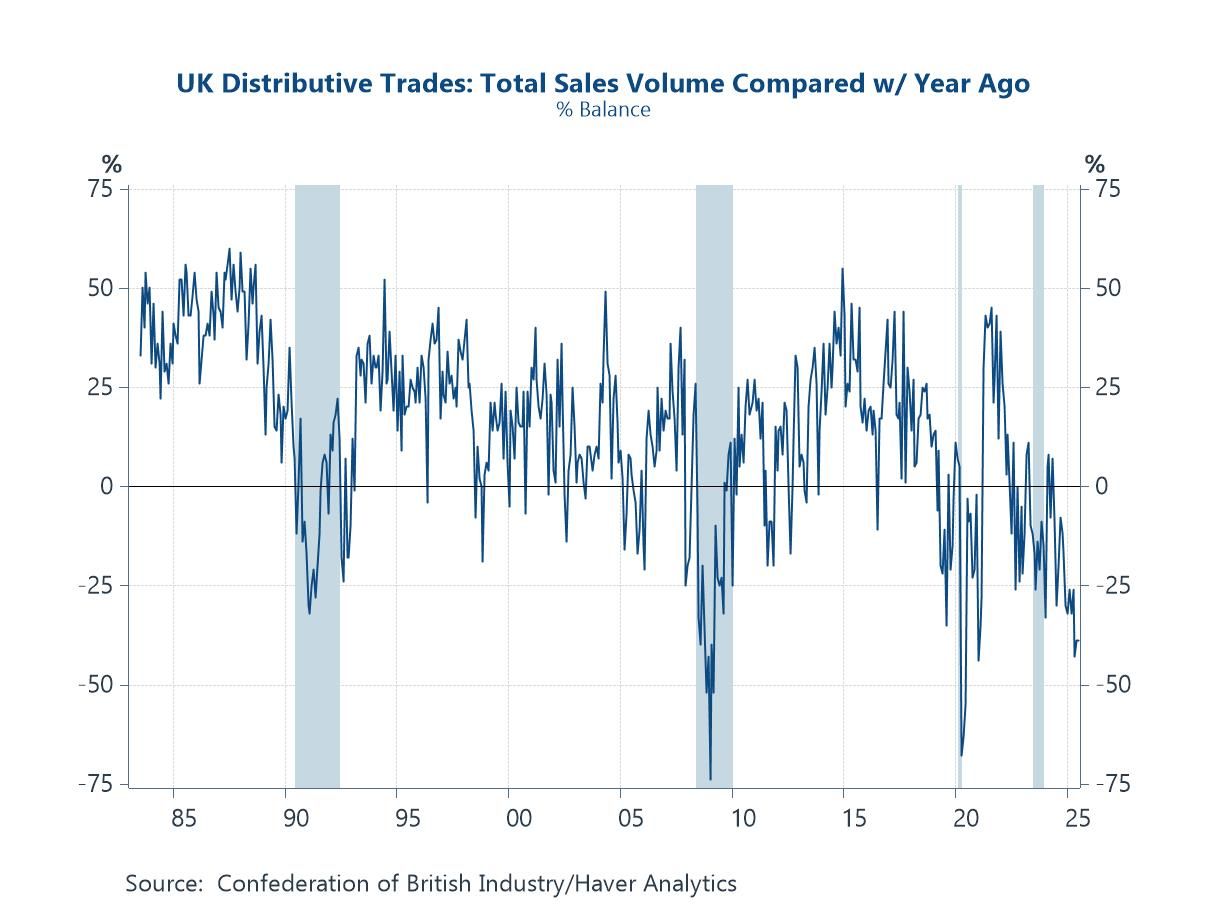
The UK consumer This week’s latest CBI Distributive Trades Survey also paints a worrying picture for the UK consumer outlook. As shown in the next chart below, the balance of retailers reporting higher sales volumes compared to a year ago has fallen sharply, reaching levels consistent with past periods of economic stress. This sustained weakness in retail activity points to downside risks to UK growth, particularly given signs of slowing wage growth and softening labour market conditions.
Chart 5: UK CBI Distributive Trades Survey: Sales volumes compared with a year ago
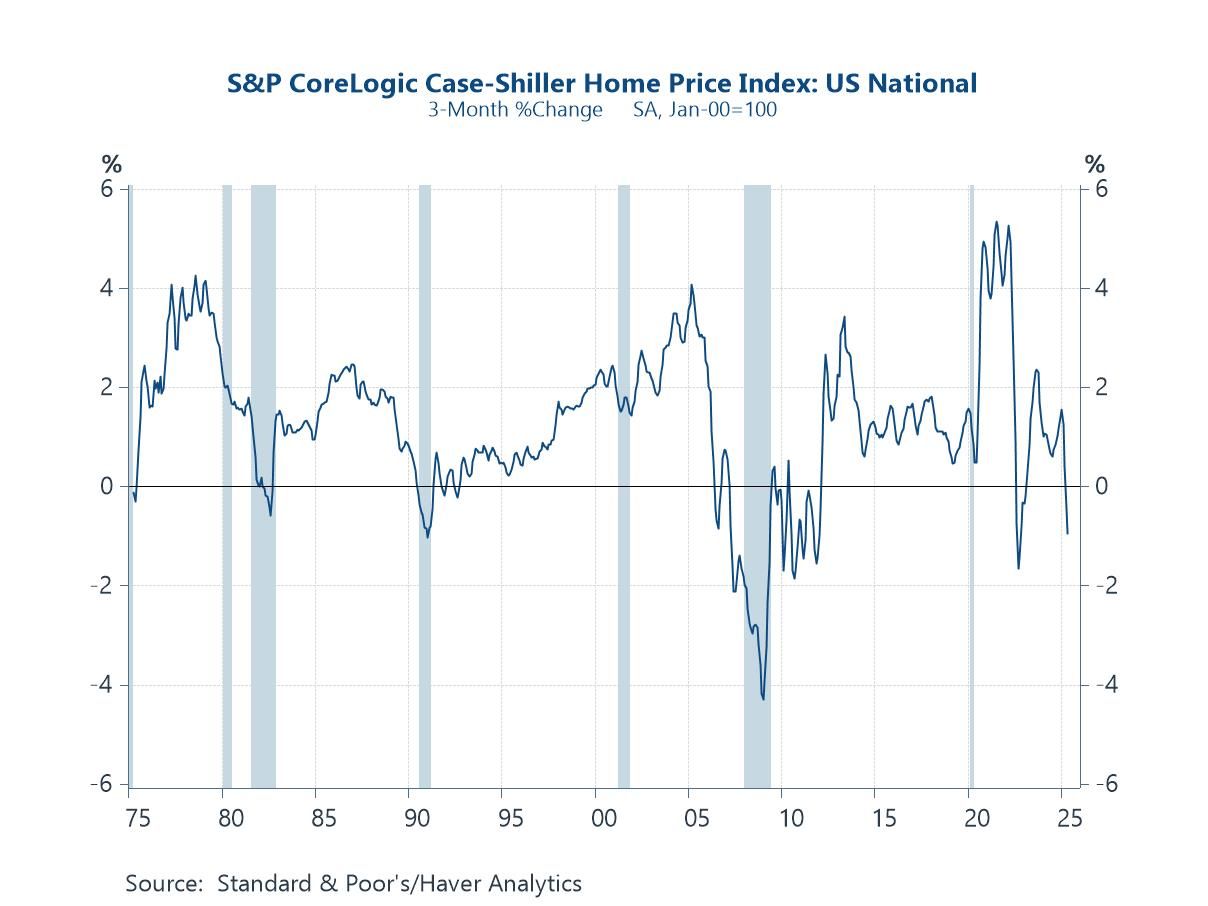
The US housing market Finally, the latest reading from the S&P CoreLogic Case-Shiller Home Price Index shows a negative three-month change, marking a clear reversal in US house price momentum. As the chart below highlights, past periods of falling home prices have often coincided with or preceded recessions, as indicated by the shaded areas. This pattern underscores the housing market’s broader significance for the economy, particularly through its impact on household wealth, credit conditions, and construction activity. While other macro indicators remain solid, the recent downturn in prices is a potential early warning sign that housing-related pressures could weigh more heavily on the outlook in the months ahead.
Chart 6: US house prices, 3-month changes

Andrew Cates
AuthorMore in Author Profile »Andy Cates joined Haver Analytics as a Senior Economist in 2020. Andy has more than 25 years of experience forecasting the global economic outlook and in assessing the implications for policy settings and financial markets. He has held various senior positions in London in a number of Investment Banks including as Head of Developed Markets Economics at Nomura and as Chief Eurozone Economist at RBS. These followed a spell of 21 years as Senior International Economist at UBS, 5 of which were spent in Singapore. Prior to his time in financial services Andy was a UK economist at HM Treasury in London holding positions in the domestic forecasting and macroeconomic modelling units. He has a BA in Economics from the University of York and an MSc in Economics and Econometrics from the University of Southampton.
More Economy in Brief


