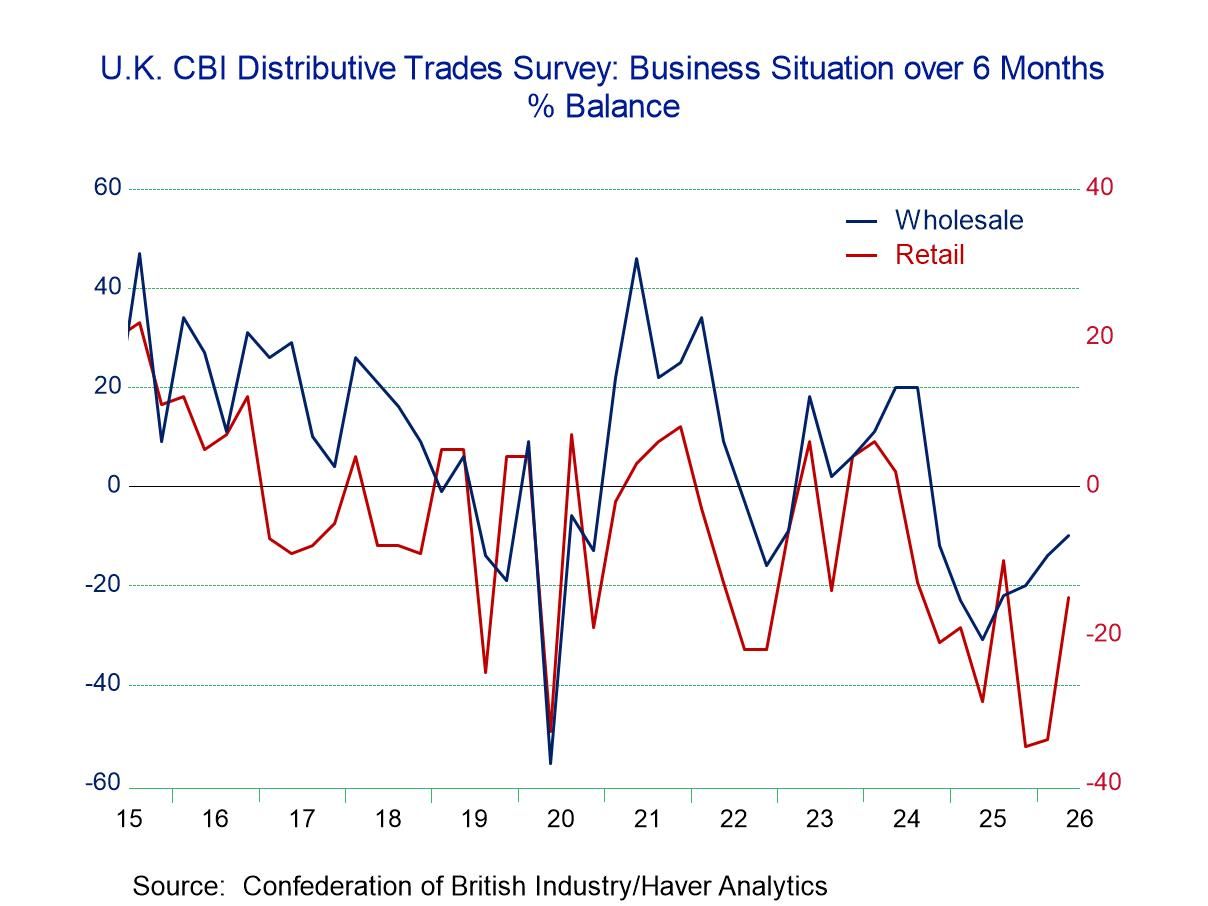
- Goods deficit narrows to smallest since Q4 2023 as goods imports declined 18.4% q/q, reversing the surge in Q1.
- Services surplus narrowed slightly from record high in Q1.
- Balance on primary income remained in deficit, a rare occurrence. Secondary income deficit narrowed marginally.
- Net financial-account transactions were -$406.9 billion in the second quarter, reflecting net U.S. borrowing from foreign residents.
- USA| Sep 23 2025
U.S. Current Account Deficit Narrows Markedly in Q2 2025
by:Sandy Batten
|in:Economy in Brief
Global| Sep 23 2025Global PMI Weakness in September Despite Trending Progress
The S&P PMIs for September show more backtracking than they show progress, although over three months even in terms of up-to-date monthly data, the trends show uptrends (among 21 calculations of 3-month changes only three show setbacks). Weakening is shown in the service sector in the United States, India, and Australia while in the United Kingdom, France, Germany, and in the European Monetary Union (EMU) services sectors were getting stronger. In September, manufacturing weakened in the EMU, Germany, France, the United Kingdom, Australia, and India with only the U.S. showing improvement. Japan, a country that usually contributes to the early PMI flash survey, is not included this month in the early S&P release.
Sequential trends Over three months, we see broad strengthening across these reporting countries with Australia showing weakness across all three measures. India shows a composite weakening and a manufacturing weakening and France demonstrates manufacturing weakness. All the other 3-month metrics show strengthening. Using only the hard data and ignoring the up-to-date flash data that remained preliminary, there is still relatively broad strengthening over three months and six months. Over six months, the composite PMIs are strengthening everywhere except in Australia and in the United States with manufacturing improving broadly everywhere except in Australia, India, and in the U.K. Over 12 months, strengthening is also extremely broad with the United Kingdom an exception showing weakening on all three metrics- and with all the other metrics showing strengthening, except for services in Germany (17 out of 21 improve over 12 months).
Standings The queue percentile standing data show a proliferation of readings above the 50-percentile mark placing them above their medians on data back to January 2021; the exceptions are the U.K. with sub-median weakening in all three sectors and in the United States with a sub-par services readings but one that is barely below its median (at 49.1%!). France checks in with sub-median services and composite readings.
The outlook The chart at the top of this report makes a clear positive statement about the ongoing trend improvement. With the Federal Reserve in the U.S. having turned back to an easing cycle for interest rates even with inflation excessive, central banks may be ready to take a risk with stimulus. While inflation remains over target and may even be slightly accelerating, the pace of acceleration is very slight in the U.S. and largely the same conditions prevail globally. The current inflation overshoot faced by most central banks is modest; although in the case of the U.S., it has missed its inflation target for 4 1/2 years in a row-that should be worrisome but the Fed has pressed ahead with a rate cut and seems to favor even more.
The average results for the PMI readings sequentially for 12-months, 6-months and 3-months show steady improvement. The sequential readings are based on only hard data available through August. The more recent monthly data (far right hand column on changes) show June to September improvement for the composite index and for services averages with manufacturing slightly weaker.
The report on the month is slightly weaker, but the trending results are still encouraging. And if there is a new global easing cycle in train, growth will improve further even with the challenge of war remaining in place between Russia and Ukraine.
- CFNAI -0.12 in August, highest since March; -0.28 in July.
- Three of four CFNAI components up m/m, but three make negative contributions.
- CFNAI-MA3 improves to -0.18, the fourth straight negative reading; still above -0.70 (recession signal).
- CFNAI Diffusion Index increases to -0.24, highest since April.
- Belgium| Sep 22 2025
Belgian Consumer Confidence Makes Modest Gain; On a Slow Improvement Track
This steady progression is underpinned by a six-month-ago reading of -10 and a 12-month-ago reading of -7. Belgium is an interesting mid-European economy. It is industrialized, it is middle-sized and it's in the middle of the monetary union itself.
When the performance of confidence in Belgium is compared with the European Monetary Union total, we find that there is an average correlation in confidence of 0.56 across seven key economies including the monetary union measure itself. Belgium has a 0.79 correlation with confidence in the Netherlands, 0.69 relationship with France and the 0.76 correlation with the EMU overall, so it's a reasonably consistent bellwether for what's going on in the monetary union. And the correlation is close to 0.5 with Italy and Portugal. Belgium's weakest correlation in the monetary union among these countries is 0.18 with Greece. This suggests to me is that Belgium is a country that's relatively plugged into the activity trend of the monetary union itself.
Belgium’s ranking for consumer confidence at 78.8% on data back to 1991; since January 2020, its consumer index is up by just 5 points, a very shallow gain for such a long period of time – but still a solid and firm ranking.
For the economic situation over the next 12 months, the reading has a ranking at its 17th percentile, substantial steep down from a 40th percentile standing of the past 12 months. That’s not a good sign.
Price trends are slightly elevated on a ranked basis but are falling month-to-month from July to August to September. However, sequentially since 12 months ago, they are on the rise- so the inflation picture is more complicated. Expected inflation (price trend) at a 69th percentile standing for the next 12 months, is down from what is now a 77.9 percentile standing over the previous 12 months.
However, unemployment expectations are mild and falling both short term and sequentially with a low 9 percentile queue standing. That is very good news.
The financial situation of households is little changed on both short- and long-term trends with modest near median ranking for the next- was well as the last-12-months.
The appraisal of the current situation is down a notch in the month and sequentially has eased a bit as well but stands with an 83.2 percentile ranking, one of the highest standings in the table.
Household standings have a high 94.4 percentile standing, the favorability to save at the 74.6 percentile mark.
On balance The Belgian readings are solid and mostly upbeat. Inflation readings show concerns more than fear about what might be happening on the price front. On the whole, the response standings and trends are a positive signal for this country set in the belly of the European Union.
Asia| Sep 22 2025Economic Letter from Asia: Of Politics and Policy
Following last week’s decision by the Fed to lower US interest rates, we examine Asia’s economic outlook, with particular focus on Japan, Indonesia, and Thailand. The Fed’s first rate cut of the year—while signalling more to come—has cleared the path for further easing from Asia’s central banks. Still, many regional central banks had already loosened policy despite wider yield differentials, responding to sluggish domestic demand, the growth drag from new US tariffs, and muted inflation pressures (chart 1). Across Asia, moreover, political turbulence risks distracting governments from tackling deeper structural challenges.
In Japan, the BoJ kept its policy rate unchanged as expected last week but announced the gradual unwinding of its large ETF and J-REIT holdings, a move likely to tighten liquidity (chart 2). On the political front, investors are watching the LDP’s two-week leadership contest, which culminates in an October 4th vote, with elevated food costs and broader inflation still pressing concerns (chart 3). Indonesia remains in focus as well, with investor concerns over fiscal discipline heightened by the recent removal of its long-serving Finance Minister. Long-standing issues, such as persistently high youth unemployment, continue to weigh as well (chart 4).
Thailand faces its own political uncertainty, with elections expected within four months after Prime Minister Anutin’s appointment. The interim push for near-term policy wins risks delaying structural reforms on household and public debt (chart 5). Meanwhile, the baht’s recent sharp appreciation—driven partly by surging gold prices (chart 6)—is straining exports and tourism, prompting the Bank of Thailand to explore measures to ease the currency’s gains, including taxing gold and encouraging US dollar-denominated trades.
Post-Fed reactions, implications As expected, the Fed cut its policy rate by 25 bps at its September meeting, marking its first reduction of the year after months of anticipation. The updated “dot plot” suggests two additional cuts may be on the horizon, though these projections remain data-dependent. The Fed’s move follows several rounds of easing by Asian central banks (chart 1), which cut rates despite wider US differentials to shore up weak domestic demand or offset risks from US tariffs. Contained headline CPI, driven by softer demand and the absence of broad supply shocks, has given the Asian policymakers room to ease. Looking ahead, further rate cuts across Asia—except in economies such as Japan, which maintain a tightening bias—remain possible. This is especially likely as the growth effects of the latest US tariff hikes, effective August 7th, have yet to be fully felt. If the Fed delivers additional easing later this year, it could further strengthen the case for Asian central banks to loosen policy again.
- Slight rise is first since early August.
- Metals prices strengthen while textile costs improve.
- Lumber & crude oil prices decline.
by:Tom Moeller
|in:Economy in Brief
- Germany| Sep 19 2025
German PPI Shows Ongoing Release of Inflation Pressure
The German PPI report showed a drop of 0.5% in the August headline, continuing a string of inflation data on the producer price front that is laying a solid disinflationary trend for the German economy. The PPI rose by 0.1% in July and in June. Sequentially the PPI falls 2.2% over 12 months, falls at 3.9% annual rate over six months, and falls at a 1.3% annual rate over three months, an impressive record of inflation discipline at a time that consumer inflation has been running hot globally.
Germany's PPI excluding energy also fell in August, dropping by 0.2% on the month after being flat in July and rising 0.1% in June. The PPI excluding energy for Germany rises 0.8% over 12 months, rises at a 0.8% annual rate over six months, and falls at a 0.3% annual rate over three months. The inflation discipline extends past energy; it is not simply disciplined energy prices although that has been part of the story.
Sectoral German PPI data are not seasonally adjusted making their sequential patterns a little bit less dependable. However, sequentially German consumer prices show inflation has been dropping, the same is true for investment goods, whereas for intermediate goods, not only is inflation dropping but prices are dropping too; inflation is negative over 12 months, six months and three months with the 3-month drop in intermediate prices at a -3.4% annual rate.
The behavior of producer prices compares to modest results on the CPI front where, sequentially, the German CPI rose 2.3% over 12 months, at a 1.8% pace over six months, and then at a 2% pace over three months, all well-contained changes. The CPI excluding energy rose by 2.6% over 12 months, 2.5% over six months, and 2.4% over three months showing a very slight deceleration with inflation looking still very sticky at about 1/2 of a percentage point above what is the target pace set by the ECB for the European Monetary Union as a whole.
Global| Sep 18 2025Charts of the Week: Faith in the Fed, Faith in Fiber
Global equity markets have remained near record highs over the past few days following the Fed’s 25bp cut on Wednesday, and which investors have seen as a key prop even without a full dovish pivot. AI optimism is also arguably doing some heavy lifting: markets are pricing a step-change in economy-wide productivity and margins from AI adoption, lifting multiples—especially among AI-exposed companies. However, some of this week’s charts frame the hurdles those hopes must clear: US consumer confidence remains subdued even as equities rise (chart 1); the Fed’s forward path is potentially becoming more politicised and inflation expectations have not softened in line with oil (chart 2); economists’ 2025 profit growth forecasts, in the meantime, have been marked lower and dispersion is wide, leaving valuations reliant on an AI-led earnings re-acceleration (chart 3). Elsewhere in Asia, earlier and ongoing easing underscores weak domestic demand and tariff risks rather than robust momentum (chart 4). Commodity dynamics could help at the margin—food prices have eased on better harvests and smoother supply chains (chart 5). Finally, and ahead of this week’s BoE decision in the UK, elevated services inflation tied to still-lofty pay growth is complicating the scope for further policy easing. In sum, the equity narrative arguably leans heavily on AI delivering tangible, near-term earnings power while policy remains credible and inflation contained; disappointment on any front in other words could challenge today’s valuations.
by:Andrew Cates
|in:Economy in Brief
- of2669Go to 8 page


