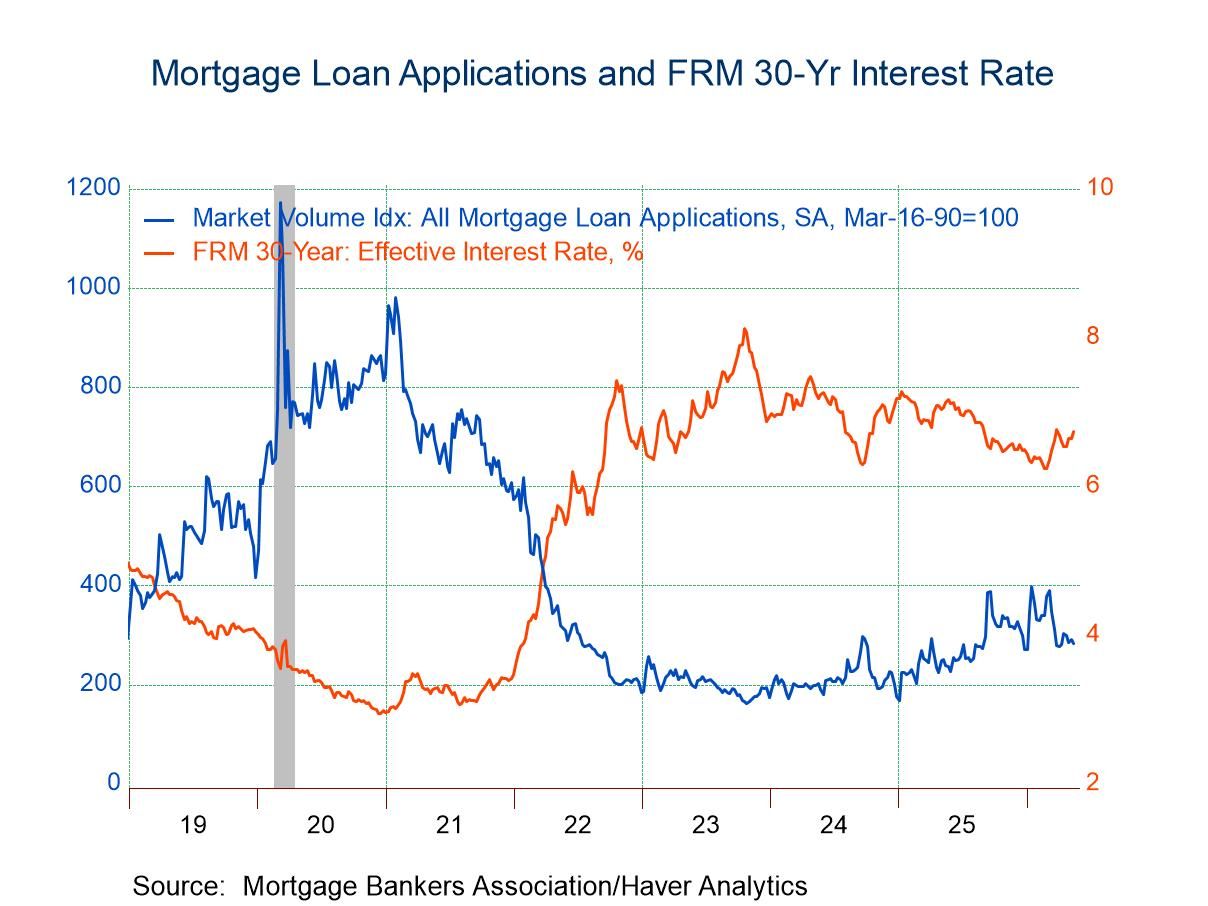
- Both applications for loans to purchase and applications for loan refinancing declined in the latest week.
- Interest rate on 30-year fixed-rate loans rose 9bps to 6.73%.
- Average loan size declined.
 USA| May 20 2026
U.S. Mortgage Applications dropped in the May 15 Week
 Japan| May 19 2026
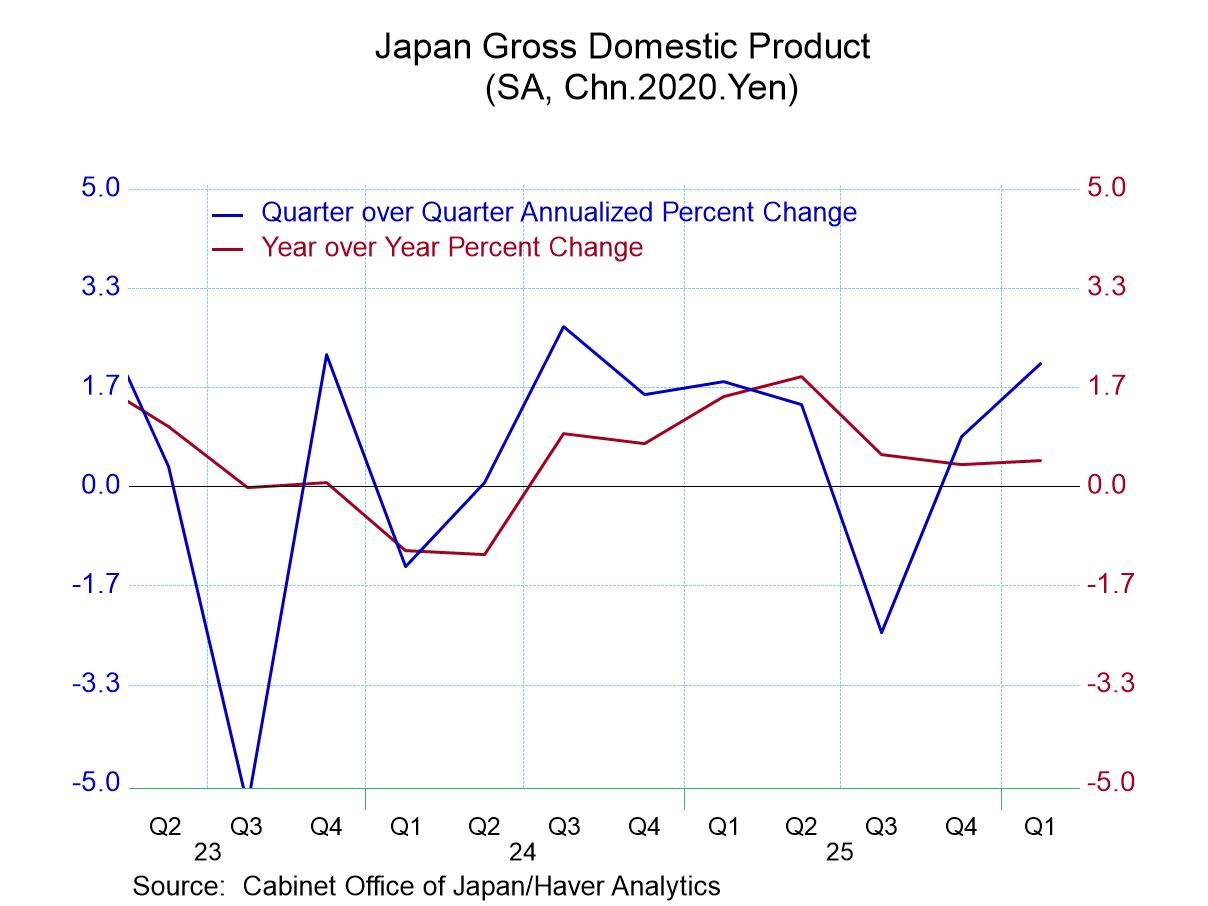
Japan GDP Outperforms Expectations
Japan’s GDP rose 2.1% annualized in 2026-Q1. The gain beat expectations for the quarter. The 2.1% rise was the largest gain since a 2.7% rise in 2024-Q3. However, it still leaves the year-on-year gain for GDP at 0.4%, the same as for 2025-Q4. And these are the weakest growth rates since Q1 and Q2 of 2024 when Japan’s GDP was declining.
Private consumption in 2026-Q1 rose by 1.1% quarterly at an annualized rate, its strongest gain in a year. Still, the year-on-year rise in private consumption slowed to 1% from 1.4% in 2025 Q4. Growth in private consumption on a year-on-year basis is the weakest it has been since 2024-Q4.
Despite some signs of GDP/Consumption stirring, the quarterly performance is not enough to boost the year-on-year growth rates to a position of strength, let alone firmness. Japan has simply been struggling for a while. And now with inflation bulging the BoJ has been super careful to move rates exceptionally slowly so that real interest rates in Japan remain exceptionally low (negative, still) and the prospect of rate normalization in Japan still seems to be a distant dream.
New PM Sanae Takaichi called her snap election and improved her grip on government and is still looking to stimulate the economy, but Japan’s fiscal position is now so precarious that even the usual incantation that Japan owns most of its debt to itself (its own residents) has not been reassuring. Japan has become wary of is debt-to-GDP ratio. The time for a fiscal surge has passed and there is talk instead of a new industrialization policy to try to stimulate the economy within the realm of current spending trends by offering improved incentives for growth.
Capital formation in GDP grew by 2.1% in 2026-Q1, a down shift for 2025-Q4, but capital spending is in a period of some volatility. The year-on-year gains show a step up in Q1 spending to a pace of 1.5% from 1.2% in the previous quarter. The five-year growth rate for capital spending is only 0.8% per year. Still there is not much here to build economic revival on.
Plant and equipment spending has weakened in Q1, showing an annualized Q/Q gain of 1.1% and that compares to five-year annualized growth of 1.8%. Year-on-year plant and equipment growth is at 2.8%.
Spending on housing turned sharply higher in Q4 with a smaller continued gain Q/Q in 2026-Q1. Still, after some considerable weakness quarterly, the year-on-year gain in housing spending in Japan in 2026-Q1 is -3.1% marking the third quarter in a row of declining spending on housing year-over-year.
Net exports in Japan turned sharply higher in 2026-Q1 and year-on-year the change in the GDP-net exports balance swung from negative to positive. The annual improvement in the net export position is still only half of what it had been over the last five years. Export growth spiked while import growth stepped up in 2025-Q1. Exports and imports over the past year both growth more slowly than their 5-year averages.
Domestic demand picked up a bit Q/Q in 2026, but the year-on-year growth slipped to 0.3% compared to a gain of 1.2% in the previous quarter.
Japanese officials are engaged in active market talk to try to restrain further slippage in the yen. Markets buzz with rumors of intervention that has not happened for over a month. Japan’s decision on interest rate is also caught up in its concerns about the yen. Meanwhile, as Japan imports all its fuel and rising energy prices are a concern in Japan. Yet the concern is about the future more than anything else since Japan tends to sign long-dated energy contracts and likely has locked up its oil price costs for this year. Still, the ongoing pressure has put conditions in doubt for the year ahead.
On balance Japan growth in 2026-Q1 was somewhat better than expected but it has done nothing to assuage concerns about the way forward. Ongoing inflation and a reticence to hike rates to address inflation continue to stalk the policy outlook as PM Takaichi looks for a way out of Japan’s weak growth trap.
 Asia| May 18 2026
Economic Letter from Asia: After the Summit
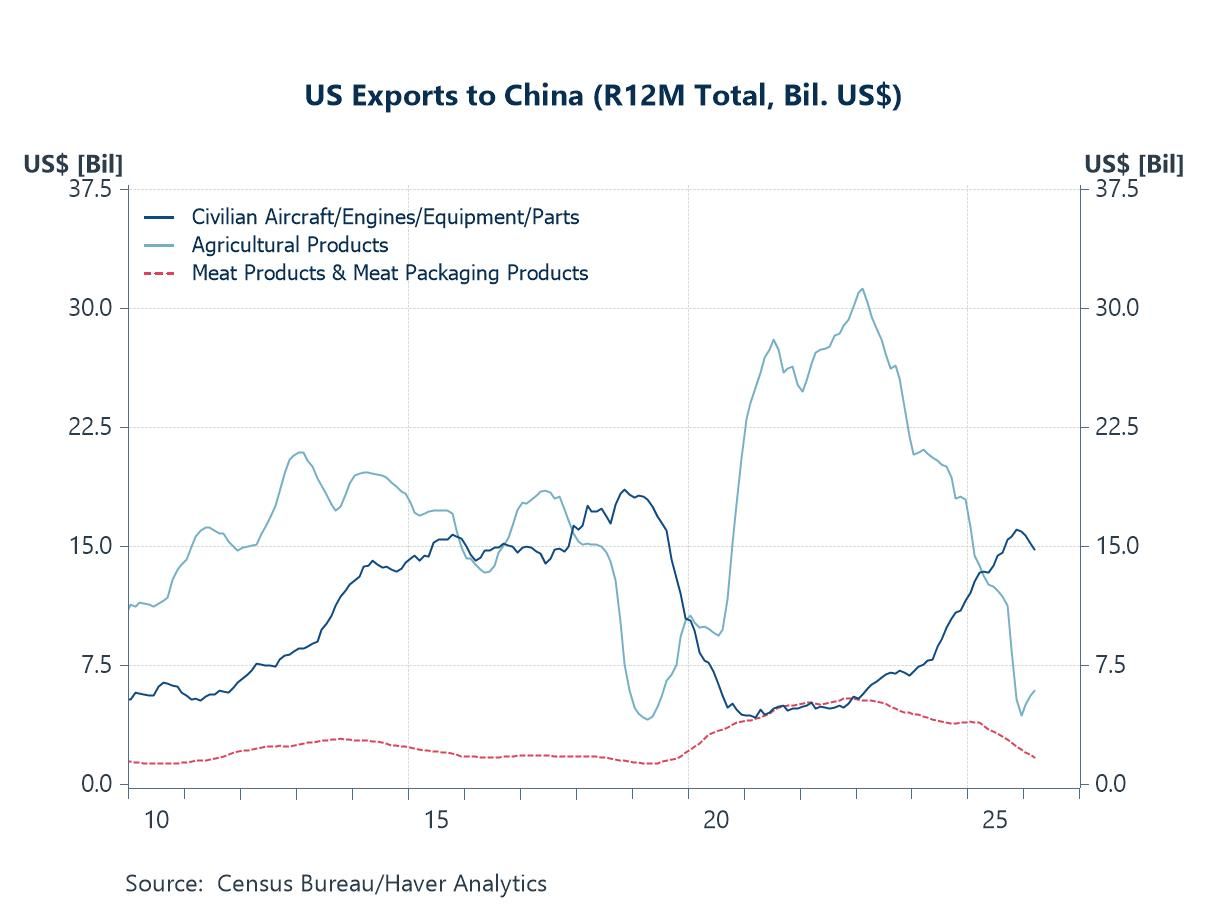
In this week’s Letter, we review the key outcomes from last week’s US–China summit, which, while largely symbolic as a reset in bilateral relations, also yielded several notable trade-related agreements (chart 1). We also examine China’s latest monthly data releases, which extended last month’s moderation in growth and further highlighted the increasingly two-speed nature of its economy (chart 2). Turning to Japan, we look ahead to this week’s key data releases. Q1 GDP growth appears likely to be supported by resilient exports, while the domestic picture—reflected in indicators such as household spending—continues to lag (chart 3). On the inflation front, upcoming CPI readings will be closely watched; if price pressures accelerate further alongside continued yen weakness, this could revive a policy dilemma for the Bank of Japan (chart 4). Zooming out, inflation appears to have reasserted itself as the dominant market driver, with nominal yields rising across markets (chart 5). At the same time, AI-related optimism has taken a back seat for now, as equity markets pull back from recent rallies (chart 6).
The US-China summit The highly anticipated US–China summit concluded last week, with few details released immediately afterward. More information emerged early this week, as the White House outlined several key developments. Perhaps most importantly, though largely symbolic at this stage, the two sides agreed to build a “constructive relationship of strategic stability.” While the phrase does not imply any concrete policy actions, it may signal a shift away from the repeated tensions and frictions that have characterized recent interactions. The US and China also agreed that the Strait of Hormuz should be reopened, although no specific measures were announced to achieve this. On more tangible outcomes, the White House said China approved an initial purchase of 200 Boeing aircraft for Chinese airlines and committed to buying at least $17 billion of US agricultural products annually from 2026 to 2028. China also restored market access for US beef by renewing expired registrations for more than 400 US beef facilities and adding new listings, while resuming imports of US poultry.
 Turkey| May 18 2026
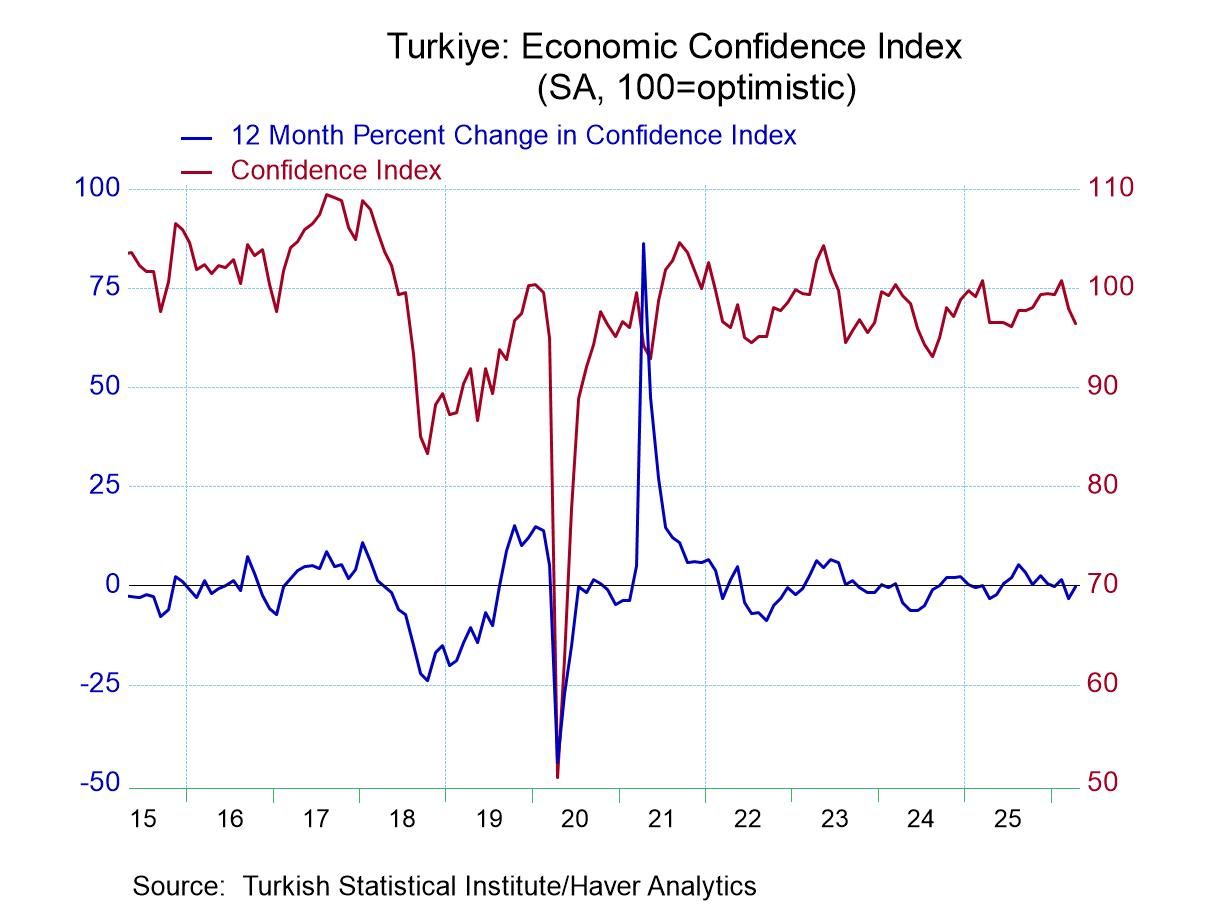
Confidence in Turkey Advances
Confidence for Turkey in April improved rising by 1.5% month-to-month to an index value of 96.42. Services and retail confidence both rose on the month as confidence in Construction fell by a sharp 3.6%, partly reversing an even sharper gain form a month ago.
The sequential performance of confidence in Turkey finds overall, services and retail sector confidence accelerating. Construction confidence is stronger over 3-months than over 12-months but its six-month gain shows slowing. Performance is still getting settled and the service and retail sector readings are still lower on balance over 12-months, even as they show acceleration and growth in train. Turky is a work in progress.
The individual sector standings of the confidence metrics by sector are surprisingly similar and cluster around the 20-percentile mark. Overall confidence at 22.7% has the strongest reading while the weakest sector reading is 17.4-percent and it finds construction and services in a tie for the lowest index rank standing.
The table also ranks confidence by growth rates, comparing growth over the past year across the sector readings. The growth sectors have relatively strong reading that the sector index standings. That is an admission that conditions currently have, when compared back to 2012, ranked weaker than the level of economic conditions (as proxied by confidence, of course) evaluated over the same period. It is evidence that some improvement in conditions (perceived improvement) is underway. The growth rate rankings stretch from the 32nd percentile to the 53rd percentile- all the growth standings exceed the index standings.
The growth in construction at a 53.5-perntiel standing is above its median growth rate since January 2012. Overall confidence still has a growth rate below its median at a 41.9 percentile standing; the shortfall is significant but not severe. Services and retail are more significant laggard with growth rate standings in their respective 32nd- and 33rd-percentiles – historically, reading that are higher about two-thirds of the time on the timeline back to early 2012.
Turkey continues to experience high inflation at 33% over the last year, a small deceleration from the month before. With global energy price pressures rising, Turkey’s central bank has recently lifted its outlook for inflation hear as well. The economy grew about 3.6% this year; it is on track for about 3% growth. Confidence readings suggest some ambivalence to these conditions. By this time, the population has gotten used to the high inflation. But growth has not stepped up significantly. That could be the key driver for improved expectations and confidence. But it is not yet a reality. Turkey is still, affected, of course, by the war-time conditions in Iran that is right on its border.
 USA| May 15 2026
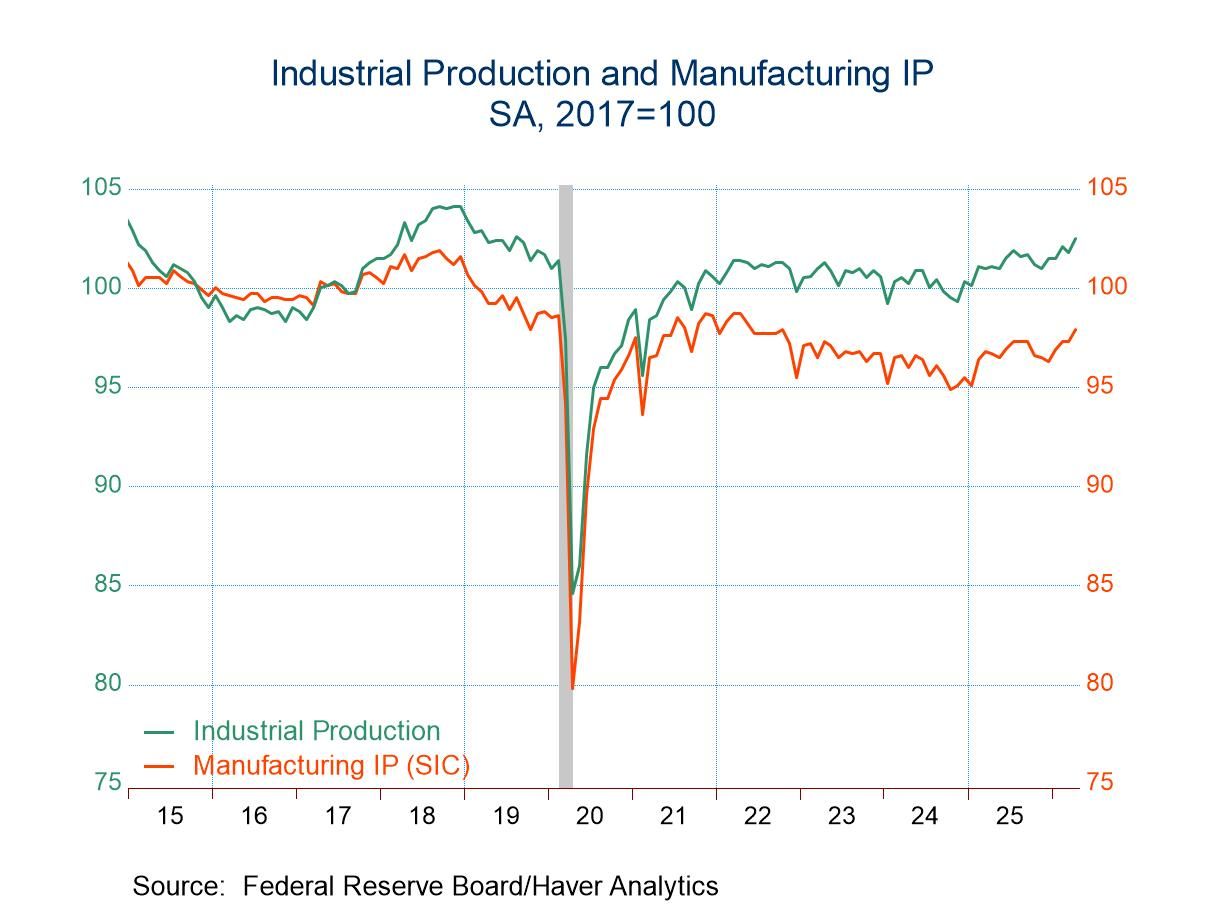
U.S. Industrial Production Jumped in April
- Total industrial output increased a much larger-than-expected 0.7% m/m in April with a small upward revision to March.
- Manufacturing output increased 0.6% m/m, led by a 5.3% m/m rebound in vehicle production.
- Mining output edged down 0.1% m/m, while utilities production rose 1.9% m/m.
- The headline rate of capacity utilization rose to 76.1% in April, its highest reading since last August but still well below its long-term average.
by:Sandy Batten
|in:Economy in Brief
 Canada| May 15 2026
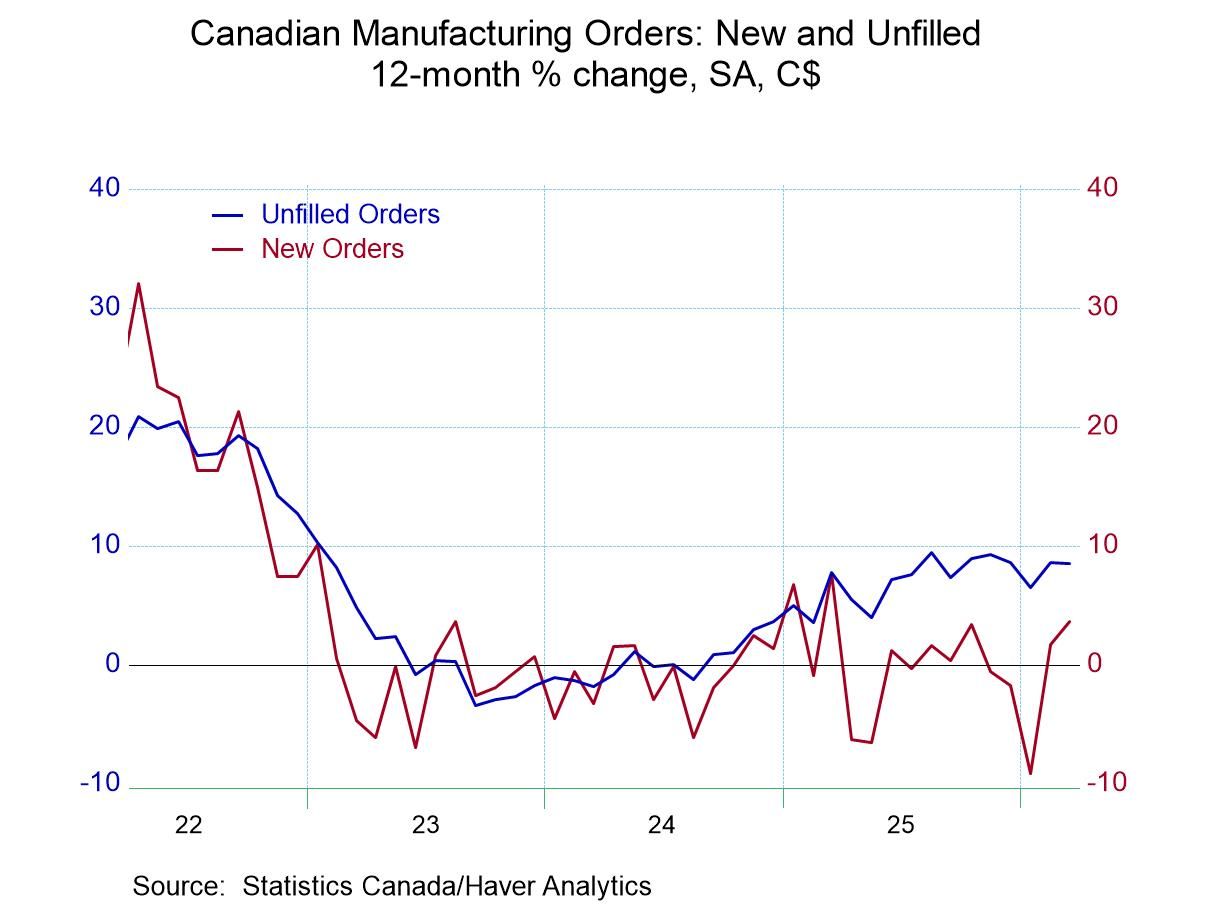
Canadian Industry Perks Up
Industrial orders in Canada are back on an expansion path with orders growing 4.7% in March on top of a 6.9% gain in February. These statistics chronicle Canadian orders digging out from a hole they fell into early in 2026. Now the data show emerging sequential growth in Canadian orders, which are advancing 3.6% over 12 months at a 14.9% annual rate over six-months, and a 26.7% annual rate over three-months. Still, on the chart that plots the year-over-year growth rates these recent accelerated rates of growth appear as mere recoveries from what had been earlier weakness. It remains to be seen how much acceleration the Canadian economy will actually undergo.
Unfilled orders expanded in March for the second month in a row, growing 2.4% after growing 1.4% in February once again following the recovery theme.
Manufacturing shipments grew by 3% in March after growing 3.4% in February and after dropping sharply in January - again echoing the recovery theme. Durable goods show two months of increases with the March increase weak after a very strong rise in February. Motor vehicle output recovered very strongly in February, after falling at a 37.1% annual rate in January; motor vehicle output is up by 15% in March, a hefty growth rate but short of what was posted in February. Once again, we see an echo of the theme of recovery. However, shipments of durable goods excluding motor vehicles are less robust, after dropping 1.8% in January output rose by 3.8% in February and has fallen back, dropping by 1.1% in March, a small fly in the ointment of this recovery theme for Canada. And nondurable goods shipments saw a small increase in January of 0.2%, a flat February, and now an extremely strong, 5.6% month-to-month gain in March.
Canada's sequential growth rates are on the verge of showing broad acceleration. Orders clearly do accelerate from 12-months to six-months to three-months. Unfilled orders, however, accelerate over six-months compared to 12-months and then take a small step back over three-months to an annualized growth rate of 13.4% - a very small step back that is still far above the 12-month growth pace. Manufacturing shipments, too, show a small flaw in acceleration as the 6-month pace dips ever so slightly before logging a very strong 3-month pace. Durable goods then are an exception to the acceleration theme; however, nondurable goods get back on board with the strong acceleration move.
Rankings The rank standings for these categories are based on annual growth rates and comparison with data extend back approximately 25 years. Orders have a 58-percentile standing, unfilled orders have a 57-percentile standing, while manufacturing shipments have a 62-percentile standing. Shipments for durable goods durables excluding motor vehicles and from motor vehicles as a stand-alone have rankings in their 30th- to 40th-percentiles, below their historic medians. (medians occur at a ranking of 50). However, nondurables have an extremely strong 80.5 percentile standing. The data are consistent, the recovery and progress with the exception that durable goods shipments that are not fully on board and languish below their historic median results. Ranking the data over six-month growth rates improves the results somewhat and brings motor vehicles on board for a growth rate that is above its historic median.
Signs of improvement Goods-based industry shows signs of picking up even in March as oil prices were rising and industry was facing greater challenges. The US industrial production report for April, similarly, shows acceleration across the board, even as the economy continued to deal with the difficulties of rising oil prices. Of course, the Canadian US economies are closely linked; we would expect the manufacturing sectors to be performing with some degree of synchronization. However, there's no reason to be complacent about the outlook. Oil prices have continued to rise, the challenge to consumers is strong and across all countries. In the US special tax cuts enacted last year, which went into effect earlier this year, have helped to deliver extra money to consumers that have helped them deal with the oil price shock. But these were funds that were supposed to help stimulate the economy to higher growth and were planned by the President to help him with midterm elections coming later in the year. The US economy still has to deal with those realities with sharply divided political reality as well.
Outlook The US acrimony with Canada has taken a back burner for a while. And as that has happened the Canadian economy has come back to life. However, Canada still has some problems with inflation although it also has a broader inflation target to accommodate some flexibility. And the prospect for more inflation because of global oil prices continues to hang in the balance. The results for March are encouraging but certainly not definitive. Canada has mounted a nice recovery after a period of difficulty earlier in the year but it's still hard to say what comes next.
 Global| May 14 2026
Charts of the Week: The Tug of War
The global economy is still caught between two powerful and competing forces. On one side, the AI investment boom continues to support growth, industrial activity and equity markets, particularly in the US and parts of Asia. On the other, renewed Middle East tensions and higher energy prices are adding to inflation risks and broader policy uncertainty. The latest Blue Chip survey reflects this divide clearly: growth expectations have generally held up best in economies tied to AI-related investment and technology supply chains, while inflation forecasts have risen more sharply in more energy-exposed economies such as the UK and euro area (chart 1). Forecasters still largely expect only limited pass-through from higher energy prices into core inflation, although recent US CPI data suggest underlying price pressures remain somewhat sticky (charts 2 and 3). At the same time, the extraordinary continued surge in global AI investment — now approaching $300 billion annually — highlights the sheer scale of capital being deployed into semiconductors, data centres and digital infrastructure, particularly in the United States (chart 4). The divergence in industrial production trends also reinforces the growing gap between economies benefiting from structural growth drivers — such as Taiwan’s semiconductor sector and Denmark’s pharmaceutical industry — and those struggling with higher energy costs and weaker competitiveness, notably Germany and the UK (chart 5). Meanwhile, improving Chinese activity indicators suggest policy support and stronger technology demand may finally be helping to stabilise growth (chart 6). Overall, the world economy remains resilient, but increasingly uneven, with AI-related investment continuing to offset — though not eliminate — the drag from geopolitical fragmentation and rising energy insecurity.
by:Andrew Cates
|in:Economy in Brief
 USA| May 14 2026
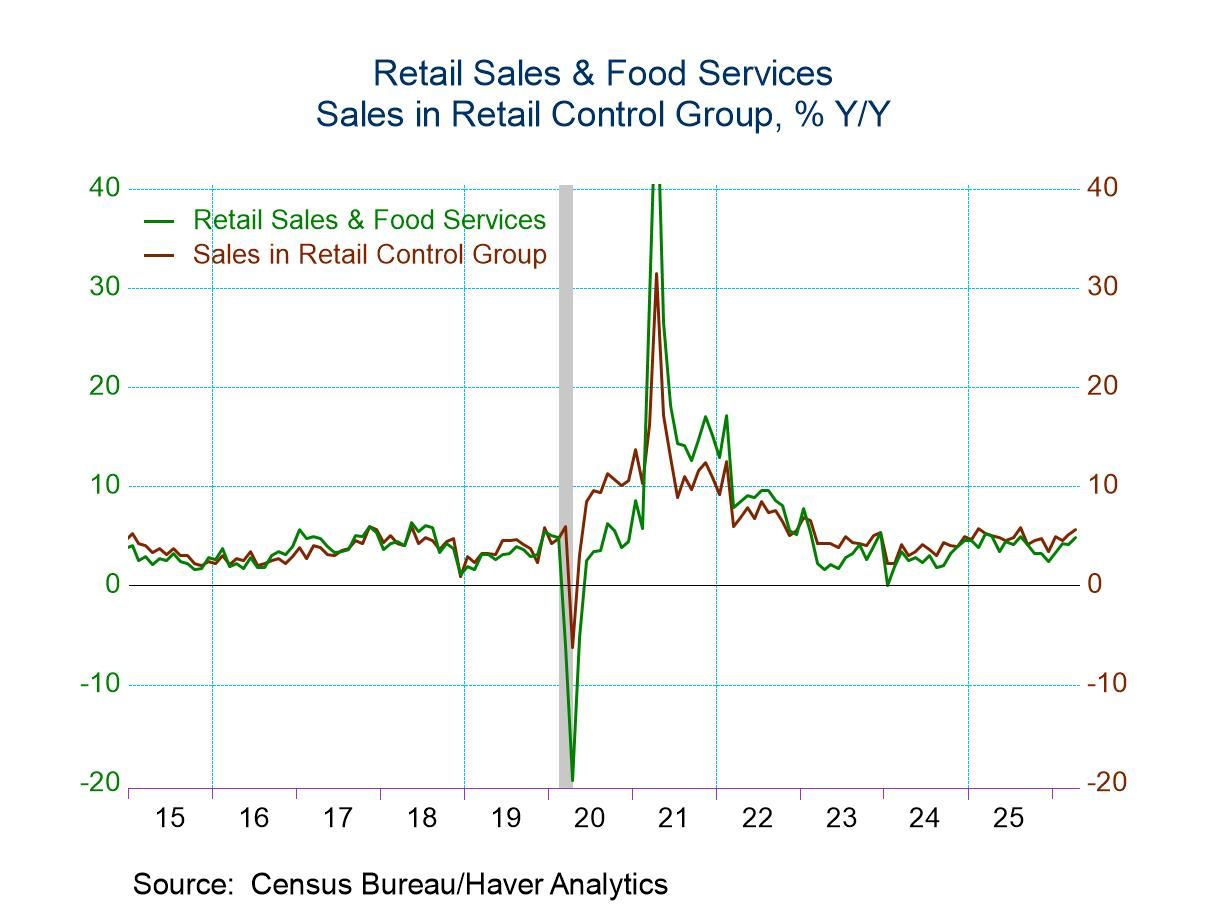
U.S. Retail Sales Slowed in April But Remained Solid
- Total sales increase 0.5% m/m in April after a 1.6% monthly jump in March.
- Gasoline sales rose 2.8% m/m in April on top of a 13.7% surge in March.
- Auto sales fell 0.4% m/m after a 0.6% m/m rise in March.
- Excluding auto and gasoline sales, remaining sales increased by a solid 0.5% m/m in April versus a 0.7% m/m rise in March.
- Sales of the retail control group that is used to construct PCE rose 0.5% m/m in April and are 5.4% annualized above the Q1 average, providing a good start to Q2.
by:Sandy Batten
|in:Economy in Brief
- of2725Go to 9 page