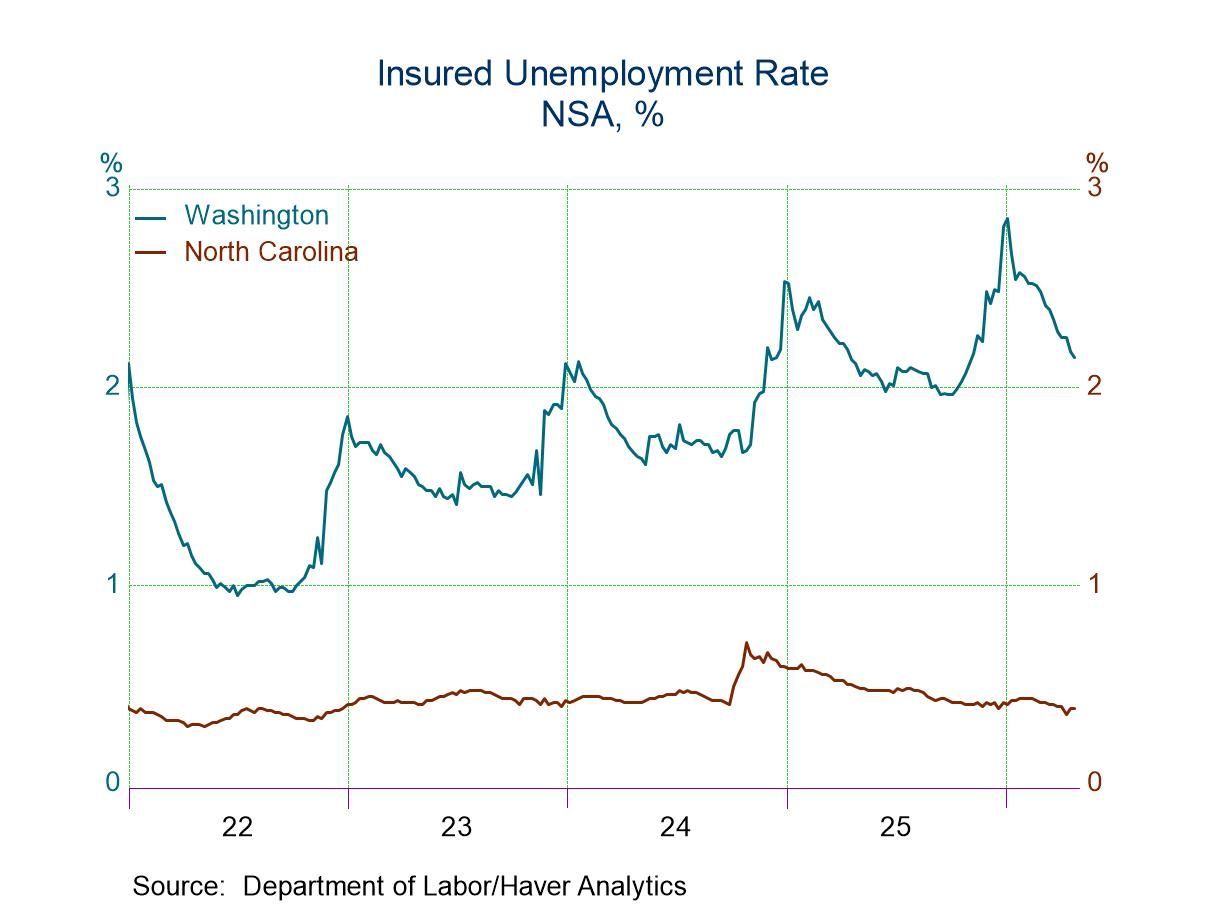
- New claims rose by 12,000 to 211,000.
- Continuing claims rose by 24,000 to 1.782 million.
- The insured unemployment rate was back up to 1.2% in the week of May 2, from the one-week dip to 1.1% the prior week.
 USA| May 14 2026
U.S. Initial Unemployment Claims rose in the Week of May 9
 United Kingdom| May 14 2026
UK Q1 GDP Growth Steps Up
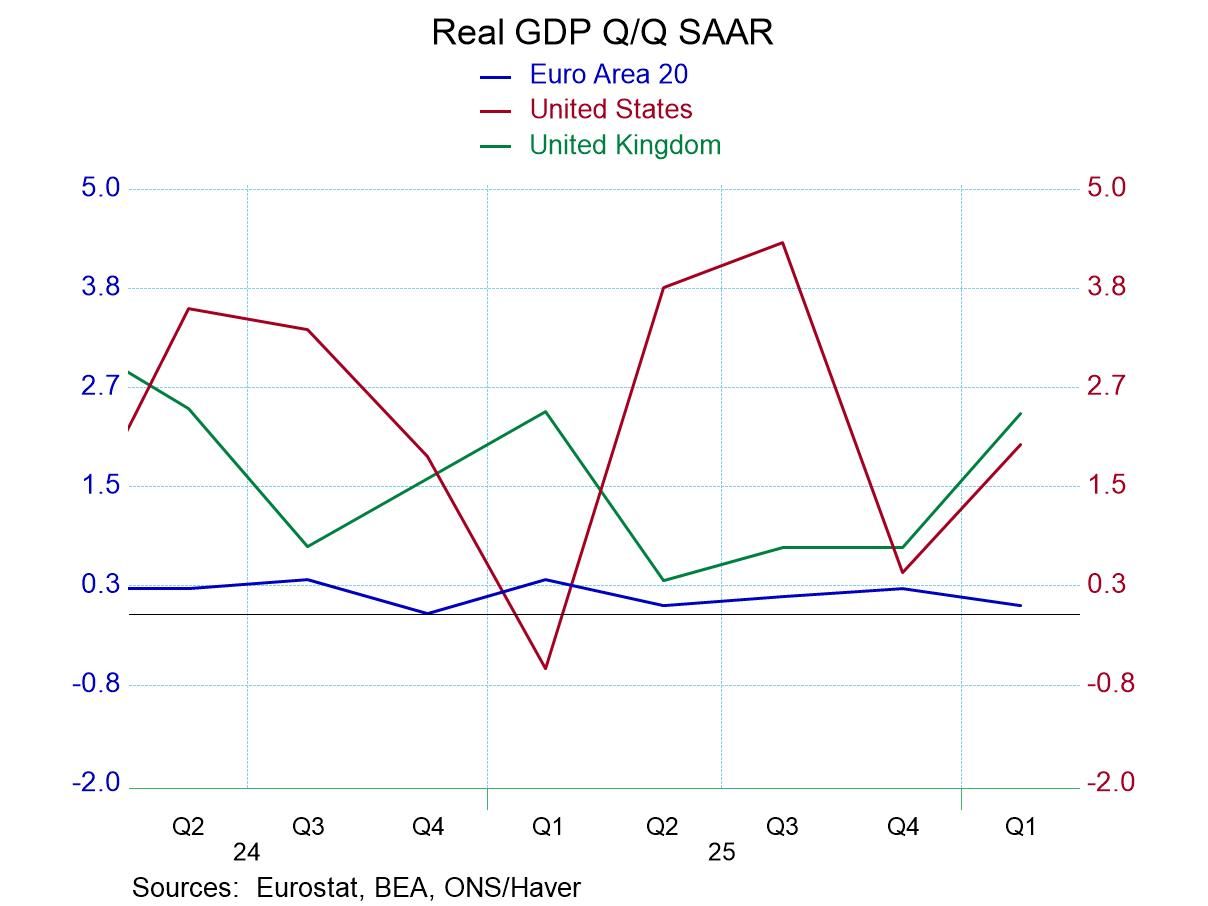
UK GDP grew by 2.5% in 2026-Q1. GDP growth quarterly was last this strong in 2024-Q2 and last stronger in 2024-Q1. This is the strongest quarterly growth in about two years. Private consumption surged in 2026-Q1, rising at a 2.4% annual rate. Capital formation and housing each backed off in the last two quarters. This is the opposite form the US where investment is strongly pushing growth ahead.
On the international side of the ledger, UK exports rose at a 0.4% annualized rate in the quarter while imports rose by a strong 2.6% annual rate, still, viewed on its own, domestic demand rose at a 3.2% annual rate.
Domestic demand growth has picked up to over 1% at 1.5% on a year-over-year basis. That is a good development. However, it is still a weak showing. Over the last 26 years domestic demand’s Year-on-year gain ranks at its 30th-percentiel; it has been weaker than this only about 30% of the time. But over the last nearly four-years the 1.5% gain is just below its median. This gives some indication of how weak growth has been in the post-Covid period. The UK was still in a post Brexit environment, when it had to deal with Covid, the invasion of Ukraine, and now the Middle East. At the same time, it has had a considerable amount of its own political turmoil and still does.
The chart above shows the snake crawl of GDP that continues to depict growth in the EMU area. That is a continuing weak environment- one of the UK’s important export markets. Europe’s fixation on social welfare spending and the need to tax to pay for it has robbed the economy of its dynamism. Still, both the UK and the Euro-Area continue to have lingering inflation issues. And both show current inflation in an upswing.
Central bankers' inflation and growth Central banks are playing a waiting game, the best that they can. Major money center country central banks have been consistently overshooting their inflation targets since Covid. And despite excess inflation banks have been reluctant to hike rates and have instead pursued a strategy of persisting slow rate reduction. It has been a curious period in which central banks have kept their inflation target goals but simply have been content to miss their targets in the short run and promise to thit them in the long run. This is clearly a policy of only temporary usefulness because it is bound to blow up, the longer inflation fails to be controlled at its targeted pace. For now, UK interest rates remain higher than in Europe, closer to the level in the US and with a monetary policy committee that seems determined to stop the overshoot as oil prices flare. We’ll see if the BOE MPC members are really ready to pull the trigger on higher rates as UK GDP growth looks firmer.
 USA| May 13 2026
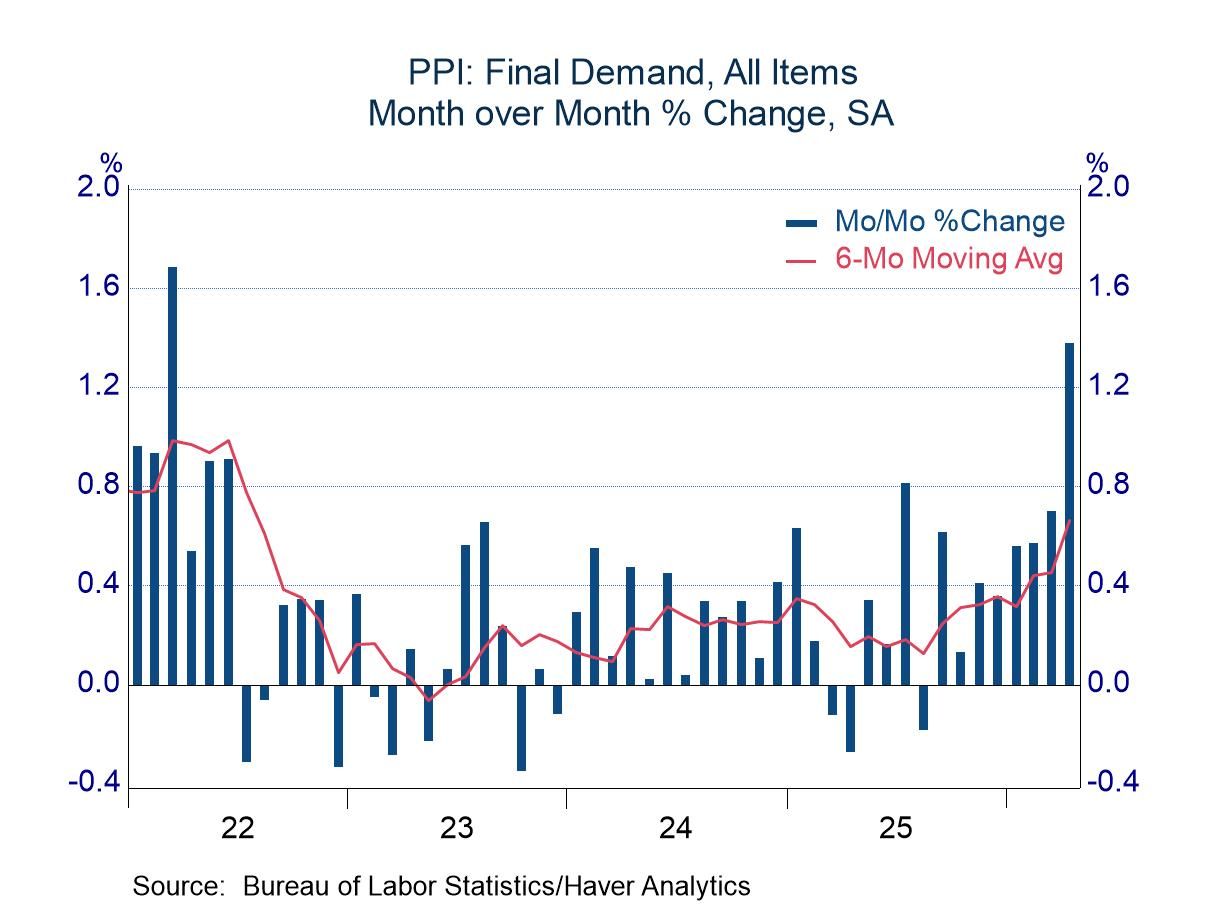
April PPI: Broad-Based Pressure
- The energy component led the sharp increase in the PPI, but it had support from many other areas.
- Excluding energy, most service prices rose sharply; prices of non-energy goods also were under pressure.
- The food component went against the grain with an increase of only 0.2%.
 Europe| May 13 2026
Manufacturing IP in EMU Slogs Ahead
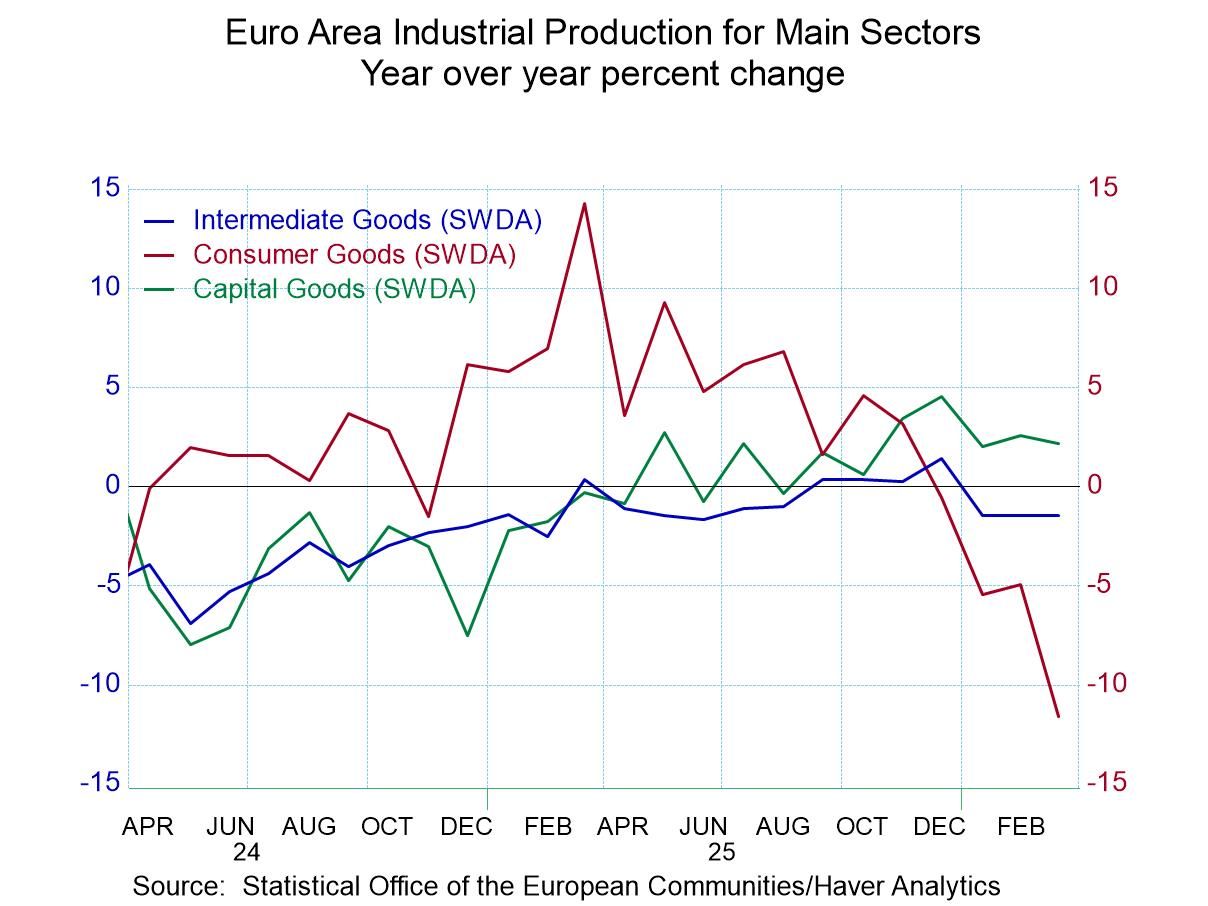
Industrial production in the European monetary area in March rose by 0.2%. Manufacturing output rose by 0.4%, marking two-months in a row of output increases. Output is still falling overall and in manufacturing over three months. Over three-months total manufacturing output excluding construction falls 2.7% annualized, over 6-months, it falls at a 0.4% annual rate, and over three-months the pace of decline steps back up again to -1.2% at an annual rate. The declines in manufacturing are more or less along the same lines.
Sectors Output of consumer goods fell in March, driven by a decline in the output of nondurable goods that fell 4.5% month-to-month. Intermediate goods output rose by 0.9% in the month, increasing for the second month in a row. Capital goods output rose 1.1% after rising 0.8% in February.
Sequential growth However sequential growth rates find headline growth negative over 12-months, six-months, and three-months- the same as for manufacturing. Consumer goods output declines at an accelerating pace dropping 11.6% over 12-months, at a 13.6% annual rate over six-months and at a 24.9% annual-rate over three-months. Those declines are led by reduction in consumer nondurables output. Intermediate goods output is mostly weak over the horizon, falling by 1.5% over 12-months and by 0.9% over 3 months annualized. The exception is capital goods sector where output rises by 2.2% over 12 months and accelerates to 4.6% over 6-months but then tails back, trimming growth to a 1.2% annual rate over three-months.
Country Performance On a country basis declines occur in only two early-reporting members; those are Malta and Germany in March. Over three months output declines in the monetary area occurs in Ireland and Luxembourg and in Germany- with increases elsewhere. Output declines over 12-months, six-months, and three-months in the monetary area only for Germany, Luxembourg, and Ireland. There are consistent output increases in the monetary union in Austria, France, Finland, Italy, Greece, and Portugal. For most countries, increasing output is the rule despite the weak headlines, indicating that large economies are faring worse than smaller economies.
Q1 Growth In the completed first quarter, we have manufacturing output falling by 1.8% at an annual rate and overall output falling at a 1.9% annual rate. Output declines in the quarter and in all major sectors. As for country reporters output falls in the quarter for Austria, Germany, Luxembourg, and Ireland.
Growth rate rankings So, the percentile queue standings presented in the right-hand column are rankings of industrial production growth rates over 12-months. Compared to recent history, overall output has a 17-percentile standing which is relatively weak, in the lower one-fifth of its ranked results over the period (back to 2006). Only capital goods output at 52.5% has a standing above the 50% level which places it above its median result for the period. Among reporting countries seven have percentile standings above 50%, above their respective medians. The countries where output does not grow at a pace in excess of its median are Germany, Luxembourg, Malta, and Ireland.
On balance the smaller countries seem to be faring better in the European monetary union. The last two months have been relatively good months for output across the union; however, January had been so weak that the two months have not been able to recover from the weakness experienced in January. And the March data hardly reflect the hardships that are going to be visiting these economies because of the rise in oil prices and concerns about the situation in Iran and the strait of Hormuz. The future is unlikely to get better.
 USA| May 13 2026
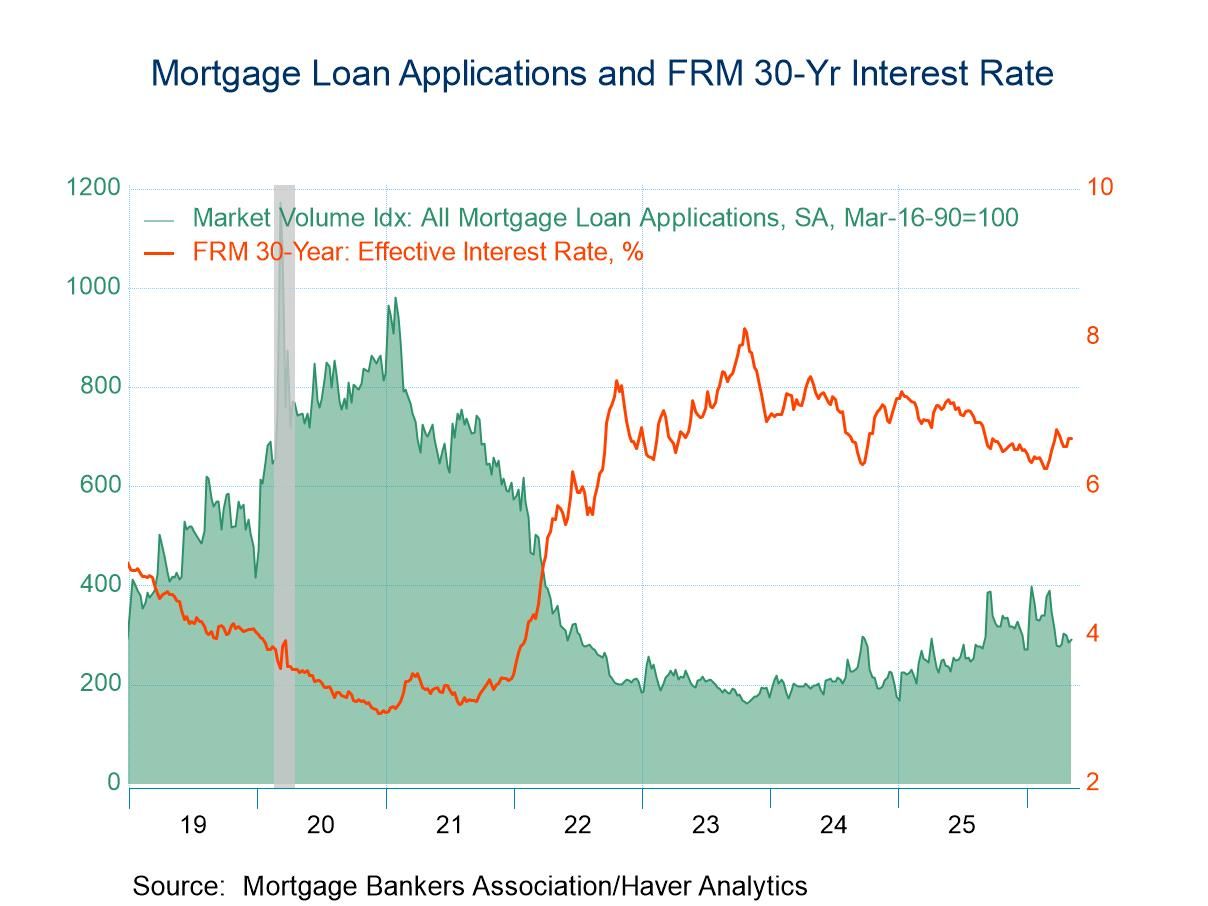
U.S. Mortgage Applications Rose in the May 8 Week
- Applications for loans to purchase rose, while applications for loan refinancing declined in the latest week.
- Interest rate on 30-year fixed-rate loans was unchanged at 6.64%.
- Average loan size edged down.
 USA| May 12 2026
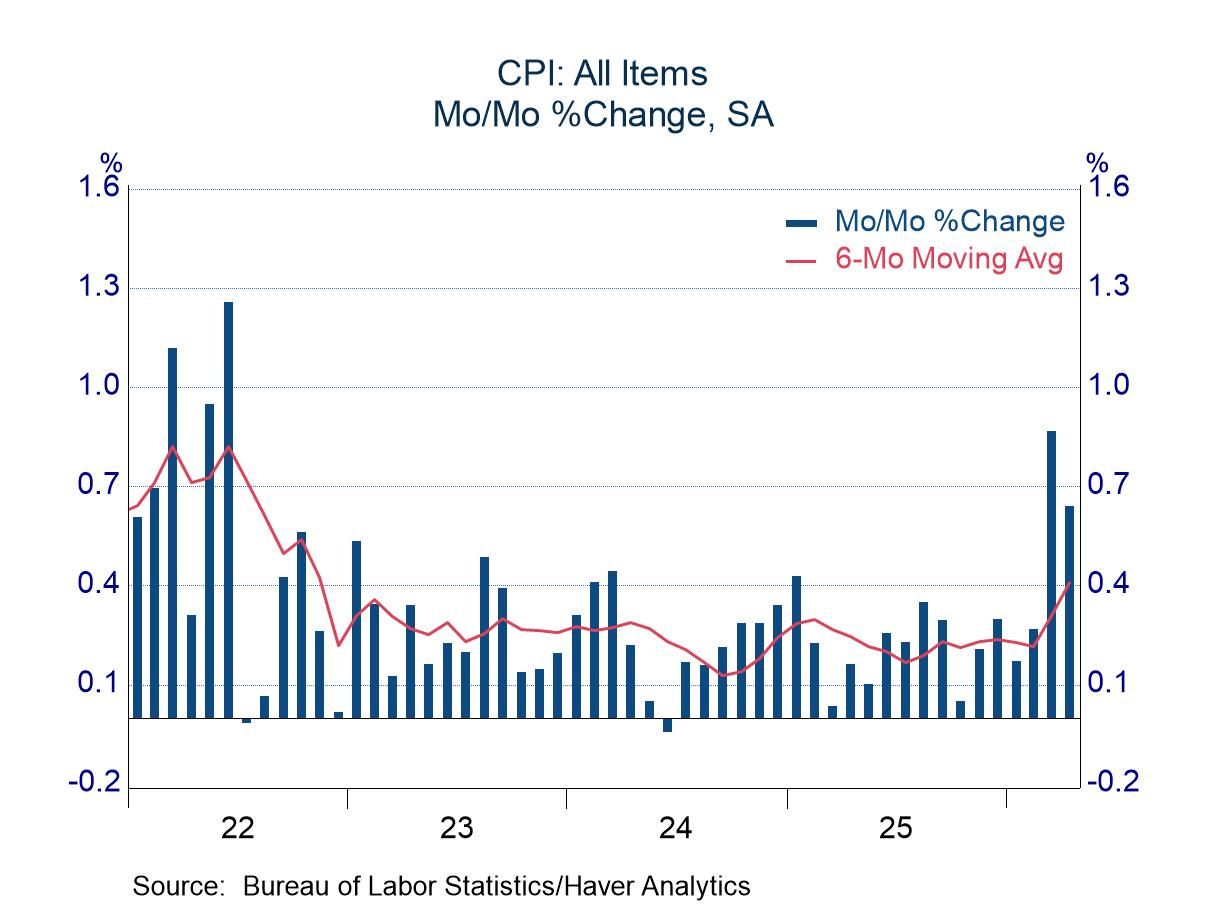
April CPI: More Energy Pressure; Food and Core Uncomfortable
- The increase in gasoline prices slowed from the blistering pace in March, but April still brought the third sharpest increase in the past three years.
- Fluctuating food prices left a high-side average change in the past three months.
- The core component was distorted by an anomaly in rents, but the pace was still brisk excluding rents.
 USA| May 12 2026
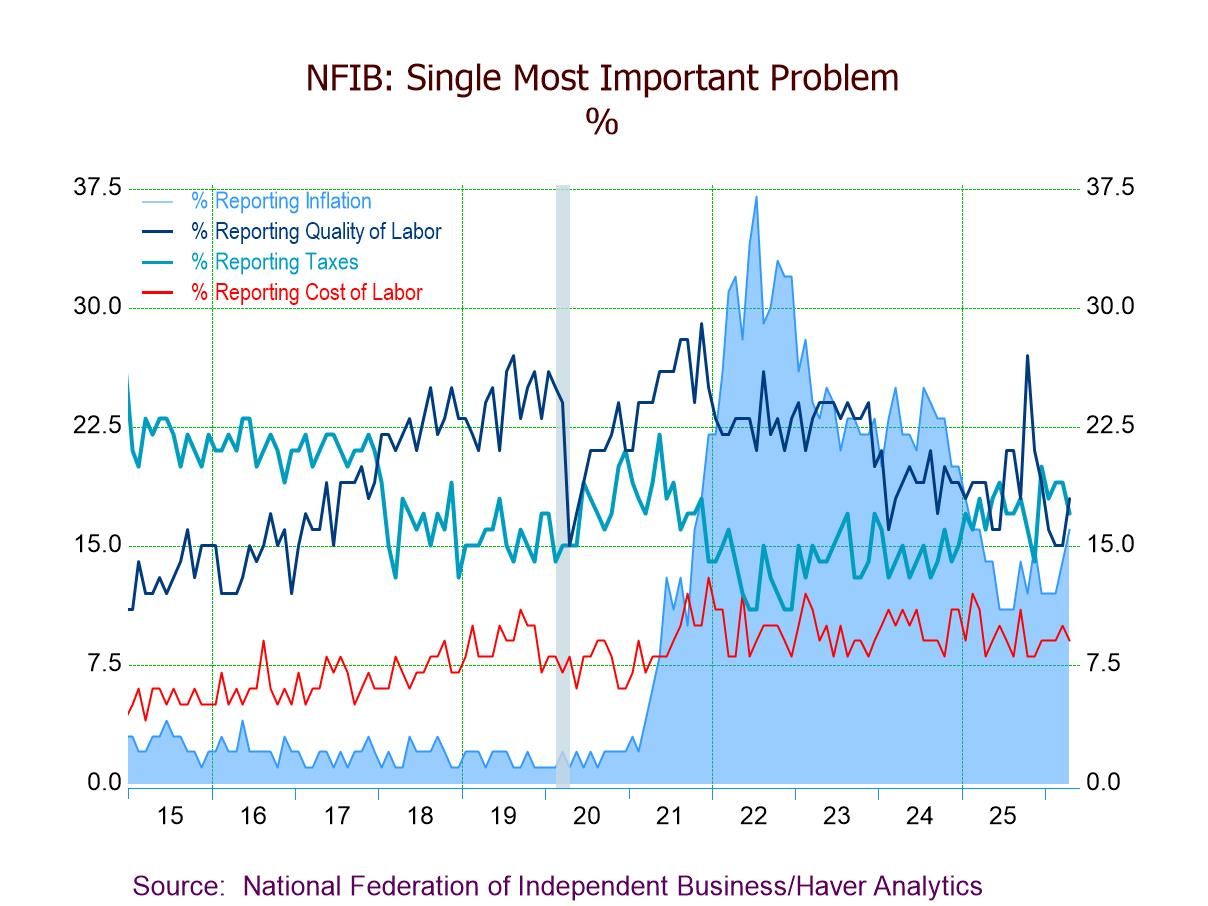
U.S. NFIB Small Business Optimism Still Fragile in April
- NFIB Small Business Optimism Idx up 0.1 pts. to 95.9 in Apr., still below its 52-year avg. of 98.0.
- Uncertainty Idx down 4 pts. to 88, remaining well above the historical avg. of 68.
- Expectations for economy down 7 pts. to 4%, lowest since Oct. ’24.
- Expected real sales down 4 pts. to 3%, a one-year low.
- Plans to expand business down 4 pts. to 7%, lowest since Oct. ’24.
- Firms raising avg. selling prices up 5 pts. to 30%, a four-month high.
- Top three business concerns: quality of labor (18%), taxes (17%), and inflation (16%).
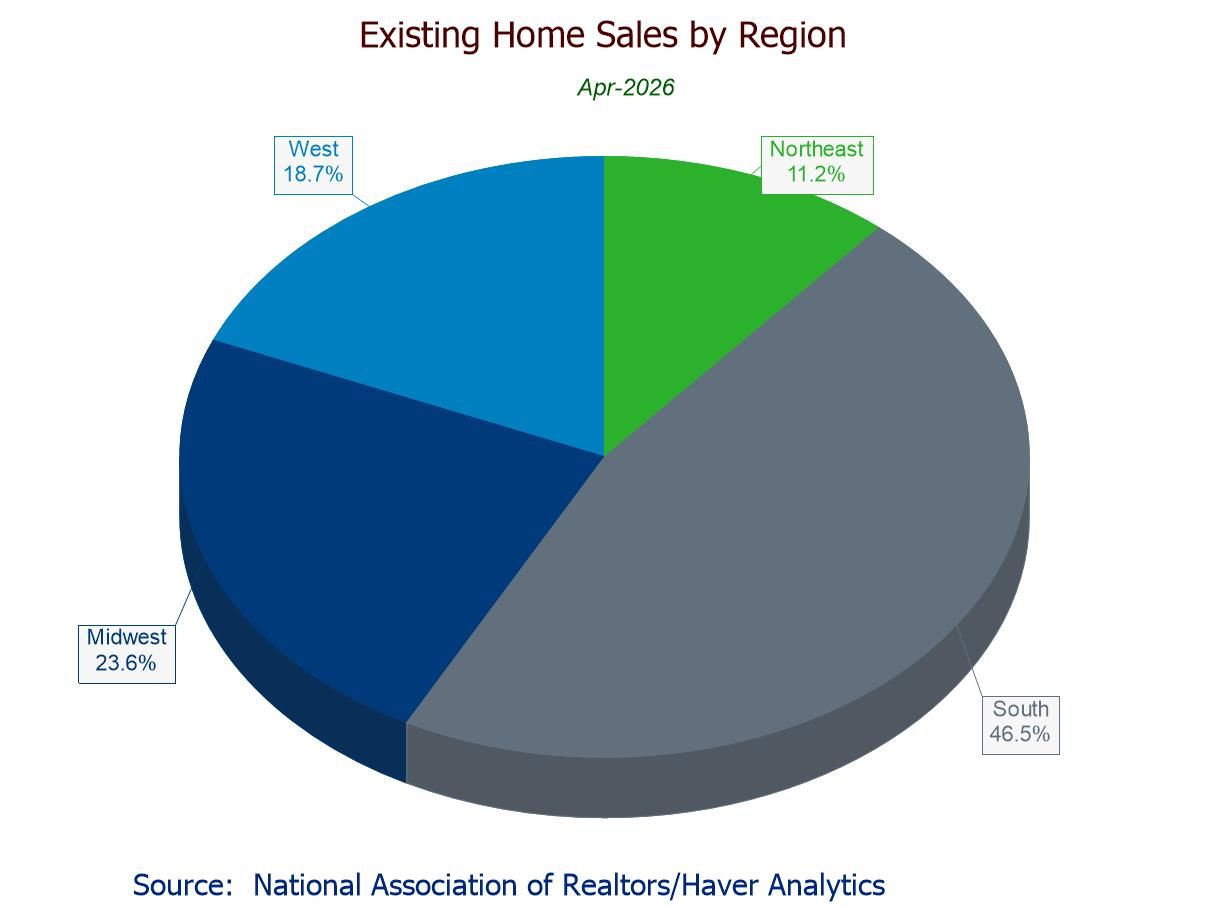
- April sales +0.2% m/m to lower-than-expected 4.02 mil.; 0.0% y/y after five straight y/y declines.
- Sales m/m up in the Midwest (+2.2%) and South (+0.5%), down in West (-2.6%), flat in Northeast; sales y/y up only in South (+2.7%).
- Median sales price +2.1% (+0.9% y/y) to $417,700, highest since Aug. ’25.
- Unsold inventory +5.8% (+1.4% y/y) to six-month-high 1.47 mil. units; 4.4 months' supply.
- of2725Go to 10 page