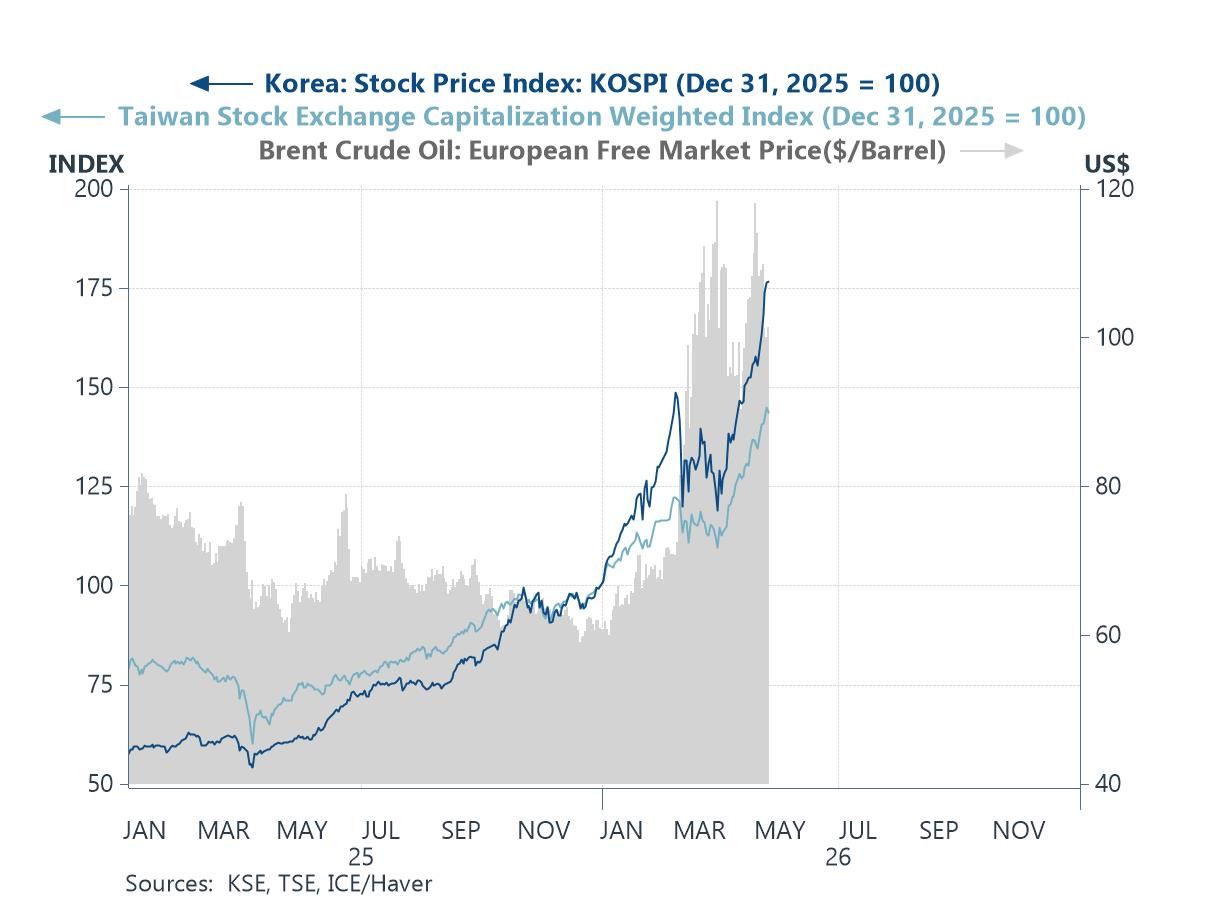
Haver Analytics
Haver Analytics

Economy in Brief

    • 48.0 in July vs. 49.0 in June; the fifth consecutive month of contraction.
    • Production (51.4) expands to a six-month high.
    • New orders (47.1) contract for the sixth successive month.
    • Employment (43.4) contracts to the lowest level since June ’20.
    • Prices Index (64.8) indicates prices rise for the 10th straight month; exports & imports contracting.
    • Private building, both residential and nonresidential, drifting lower.
    • Public construction hesitating after two strong years.
  • Manufacturing PMIs in the S&P framework were mixed in July. However, the median reading edged slightly higher rising to 48.6 in July from 48.5 in June. But both of these are significantly weaker than the 49.1 reading in May. Manufacturing continues to post PMI readings that are below 50 indicating sector contraction on a fairly broad basis in July among the 17 reporting countries in the table plus the euro area. Only India and Vietnam reported PMI readings above 50 indicating sector expansion in July. In June, three of these jurisdictions showed readings above 50; in May, only three had readings above 50 as well. It remains a difficult time for manufacturing globally.

    The readings for the manufacturing PMIs also show slippage in the medians from 12-months to six-months to three-months. The 12-month median is 49.2, the six-month median at 48.8, and the three-month median at 48.7. The bottom line is that most manufacturing sectors show contraction, and the contractions are generally getting slightly worse.

    However, on an individual basis over three months about two-thirds of the reporters showed an improvement. Over six months just under 40% showed improvement and over a year about 44% of them showed improvement compared to the year before. Only the three-month versus six-month comparison shows a majority of reporters indicating better performance in July.

    The ranked or queue standings metrics that place these individual readings for July in their queue of data over the last 4 ½ years, show standings above 50% which put the individual readings above their medians for this period. And only six of these eighteen reporting jurisdictions sported readings above 50%. Those were for the euro area, Germany, France, and India. India has a rating well above 50% at its 96th percentile; Malaysia has a reading above 50% and Vietnam has a reading well above 50% at its 74th percentile.

  • Financial markets have performed well in recent weeks, lifted by stronger data, moderating inflation, and renewed soft landing hopes. Equities have pushed higher, volatility has eased, and credit markets have firmed. While economic policy uncertainty remains elevated, it is showing signs of normalising alongside greater clarity on US trade policy (chart 1). The US dollar, however, remains under pressure amid concerns about Fed independence and broader policy credibility (chart 2). The Fed’s decision on July 30th to leave policy on hold, despite two dissenting votes in favour of a cut, arguably did little to ease those concerns. Recent US trade agreements—particularly with Japan and Europe—have boosted sentiment, though questions linger over implementation. In Japan, trade policy uncertainty has surged amid vague deal terms, even as exports to the US have weakened (chart 3). In the euro area, M3 growth slowed in June as private credit softened, casting doubt on the durability of recent upside surprises (chart 4). UK retail data signal a sharp drop in consumer activity, consistent with past recessions (chart 5), and the change in US house prices has turned negative on a three-month basis—often a warning sign of broader economic weakness (chart 6). Overall, while market sentiment has improved, risks tied to credit, demand, and housing persist.

    • Core price increase is strongest in four months.
    • Real spending moves slightly higher.
    • Real disposable income holds steady along with personal savings rate.
    • Compensation grew 0.9 q/q in Q2, the same pace as in both Q1 and Q4 2024.
    • Wage growth picked up to 1.0% q/q while benefits slowed to 0.7% q/q after Q1 surge.
    • Initial claims edged up in the July 26 week after six consecutive declines.
    • Continuing claims were unchanged in the July 19 week.
    • Insured unemployment rate was unchanged for the eighth consecutive week.
  • Europe
    | Jul 31 2025

    Unemployment in EMU

    The overall EMU-wide and EU-wide unemployment rates were steady in June. For the EMU the rate is 6.2% and for the EU the rate is at 5.9%. According to data back to January 2020, the EMU rate has been this low or lower 1.3% of the time while the EU rate has been this low or lower 2.6% of the time. The EU rate at 5.9% is just above its all-time low (of 5.8%) on this horizon while the EMU rate remains at 6.2%, which is its all-time low on this horizon.

    In June, four of twelve reporting EMU members logged month-to-month drops in their unemployment rates against only two where unemployment rates rose. This compares to May when seven members reported lower rates of unemployment. In April, nine reported unemployment rate drops.

    Sequential data over 12 months, six months and three months show unemployment rates falling in six of 12 EMU members, over all three horizons: three-months, six-months, and twelve-months.

    Among the 12 reporting members in the table, only three have unemployment rates above their respective medians since 2000 (rankings above 50%) in this period.

    Elsewhere the U.S. unemployment rate fell in the month and was otherwise stable over the past year. The U.K. claimant rate of unemployment has snake higher beginning in May. Japan’s unemployment rate remains anchored at 2.5%. Among these three countries, the U.K. has an unemployment rate above its historic median at 62.7%.

    European growth has been slow as the emerging GDP data for 2025-Q2 are confirming. But the labor market in Europe remains very solid. Inflation seems to be winding down in Europe. Europe may even be in for some growth turbulence because of the new U.S. tariff policy. However, for now, the labor market looks quite solid, and growth remains the orders of the day even if it is slow.