Haver Analytics
Haver Analytics

Economy in Brief

Jump to:
  • The total or composite PMIs in July released by S&P showed mixed performance although the average and median readings for the 25 reporters improved slightly month-to-month. The average reading rose to 52 in July from 51.3 in June, and the median reading rose to 52.2 from 50.8.

    Contraction is mostly avoided, but not rare In July, seven of the reporters showed total PMI gauges below 50, indicating that those economies are contracting. The seven economies with that characteristic are France, Russia, Brazil, Zambia, Ghana, Egypt, and Qatar. For the most part, these are smaller economies. France, of course, is a large European economy; Russia is engaged in its ongoing war with Ukraine, which is taking a toll on its economy; and Brazil is one of the large BRIC economies.

    The contracting count worsened, then stopped In June, nine countries had PMIs below 50, the same as in May. Over broader periods, such as three months, 10 countries show PMI values averaging below 50. That compares to seven over six months and six over 12 months. The slippage has actually progressed from 12 months to six months to three months, then improved on monthly data.

    Contraction seems more structural than cyclical The shaded parts of the table correspond to PMI values below 50. We see that there's a long string of those readings in France, Russia, Egypt, and Qatar. For those countries, the one-month appearance of a below-50 reading in July was not episodic; it was structural. Germany has had two months in a row and a three-month average below 50; however, Germany turned stronger in July. The European Monetary Union as a whole had two months below 50 as well as very weak three-month and six-month averages, but it also turned higher in July. Zambia has a recent string of ongoing weakness; Ghana has a nearly unbroken streak of values below 50 as well. Brazil’s signal is like a flashing light.

    There is good news However, the good news is that only eight of the reporting areas actually got weaker month-to-month in July, compared to nine in June and 11 in May. Over three months, we see 13 areas reporting PMIs that have weakened month-to-month. That compares to 21 that weakened over six months. On year-over-year comparisons, only 11 are weaker period-to-period. The weakening trend is much reduced in the recent monthly data.

    Lingering weakness PMIs chronicle a great deal of lingering weakness, although for the most part conditions aren't worsening month-to-month over the past two months. However, there are a number of areas where activity, as designated by the PMI values, is declining. The sequential readings confirm that the growing weakness is a real factor and has only reversed in the last two months, if that result can be durable. How much of this weakness and subsequent rebound is linked to the war in Ukraine and the new deterioration and stalemate in the Middle East; those up-and-down dynamics are going to be hard to puzzle out.

    Activity and performance assessments The queue percentile standings show that 12 of the 25 reporting entities have standings below their medians on data back to January 2021. That means nearly half are weaker in July than they have been on readings back to January 2021. On that timeline, conditions have not been strong, with an average diffusion (PMI) reading across the board of 52.3 and a median of 51.4. It has been a low-growth period in general.

    The rich get richer? Even if only slowly... The large, developed economies, for the most part, have PMI rankings and queue standings above their 50th percentiles. The exception is the United Kingdom, with a 47.8 percentile standing. The exceptions also include the BRIC countries: Russia having a 26.9 percentile standing, India with an exceptionally low 9.0 percentile standing, Brazil with an 11.9 percentile standing, and China with a 22.4 percentile standing.
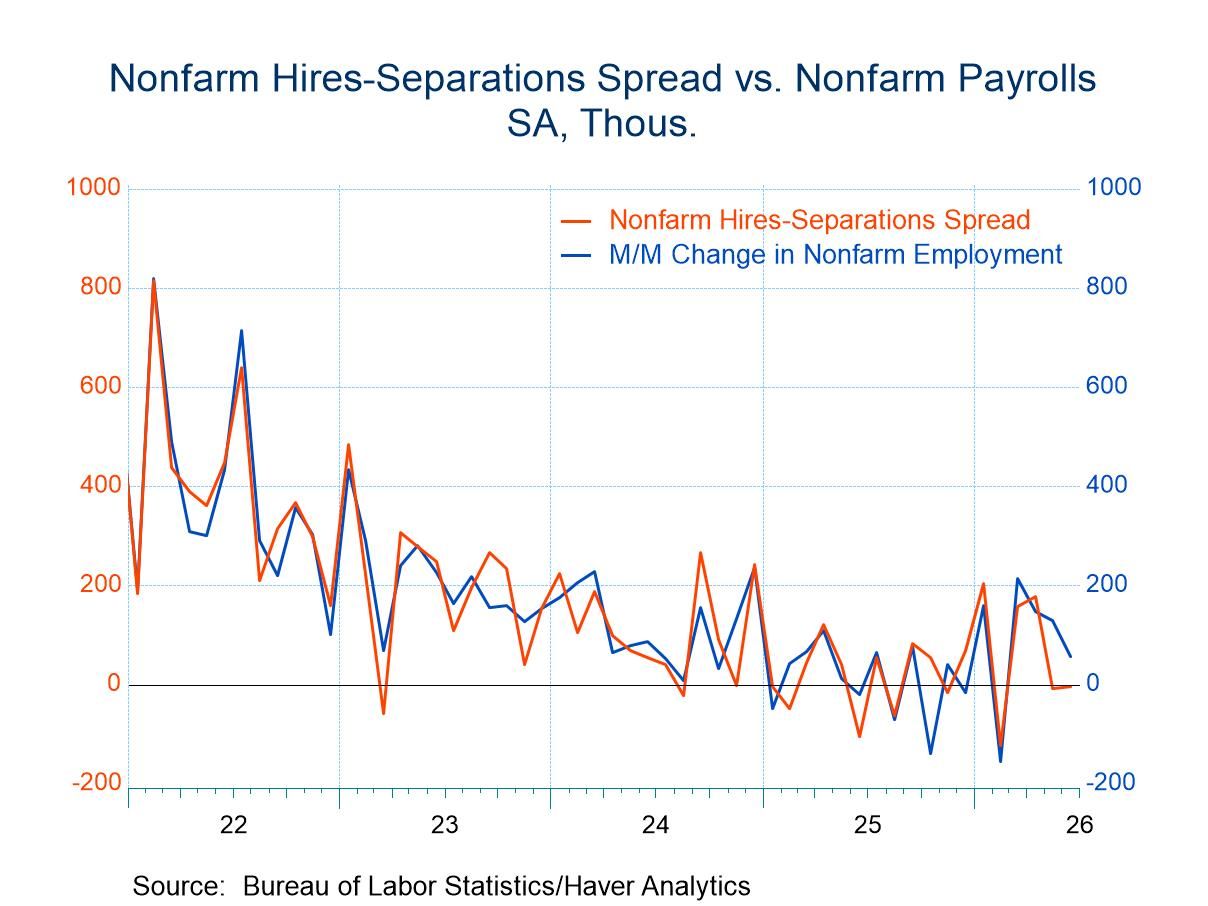
    • Sideways tracks reinforced for job openings and hires.
    • Quits continue to signal wage disinflation.
    • Hires-Separations point to May and June downward nonfarm payroll revisions.
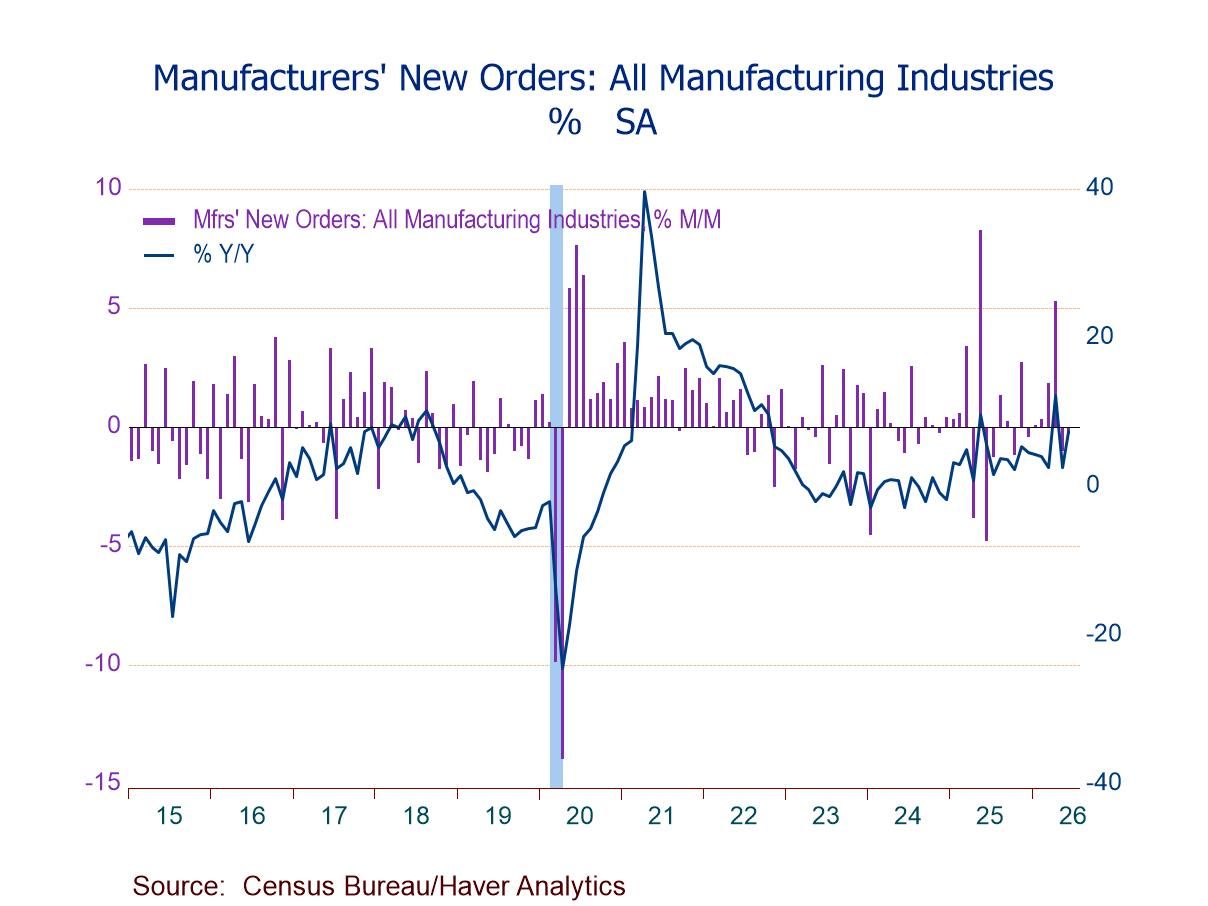
    • Factory orders -0.3% (+7.4% y/y) in June, second straight m/m decrease; still 14.0% above the Jan. ’24 low.
    • Durable goods orders +0.5%, third m/m gain in four mths.; nondurable goods orders -1.2% and shipments -0.2%, first m/m declines since Nov.
    • Mining, oil field & gas field machinery -27.2%, steepest m/m drop since Apr. ’16.
    • Transportation orders -0.1%, led by m/m falls of 7.2% in defense aircraft orders and 3.9% in ships & boats.
    • Unfilled orders +0.6%, 11th straight m/m rise.
    • Inventories +0.1%, eighth consecutive m/m increase.
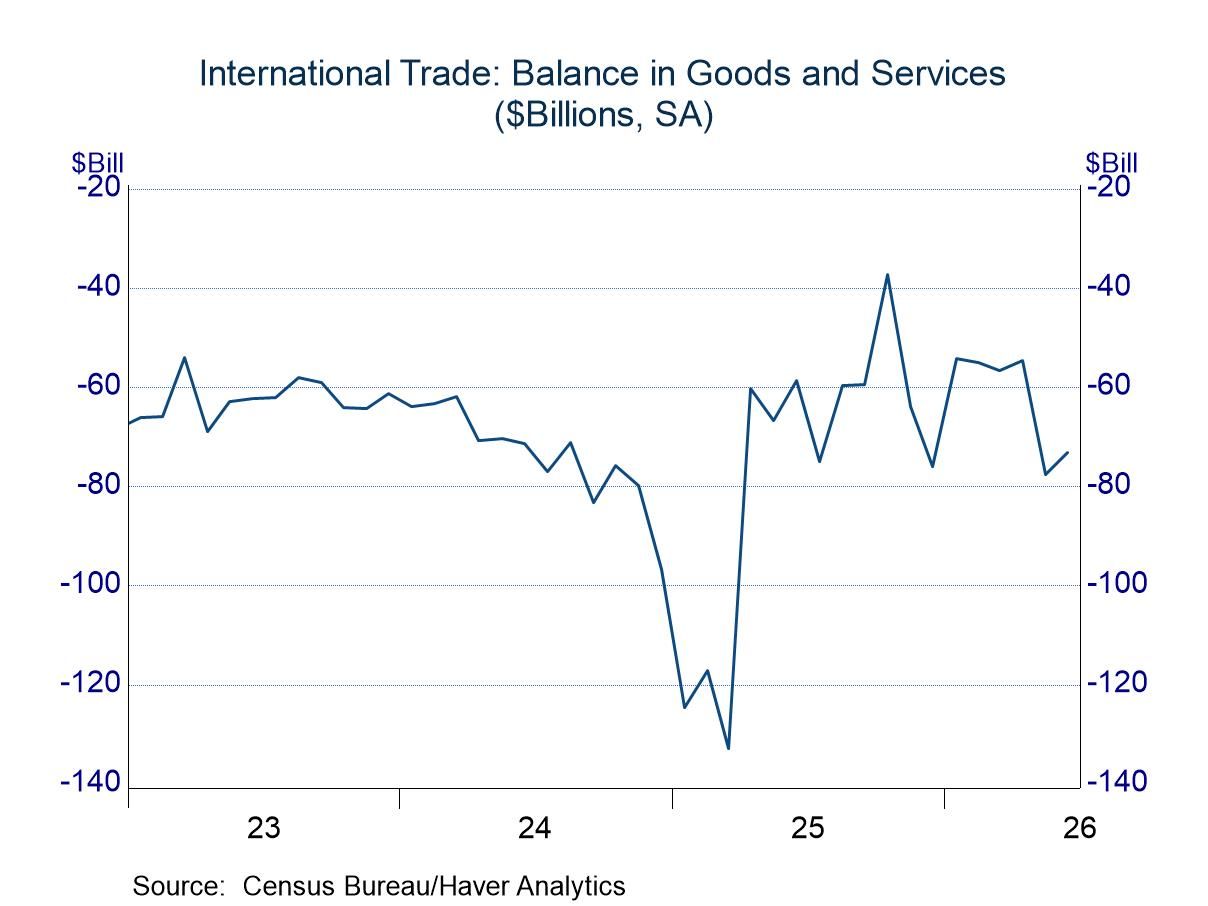
    • Both exports and imports cool after strong performances in early 2026.
    • The US trade balance is moving sideways within a wide range.
  • Swiss HICP inflation in July was zero month-to-month. In June, it was zero month-to-month. In May, it was 0.1% month-to-month. Year-over-year HICP inflation is 0.7%, compared to a year ago when it was 0.1% over 12 months.

    The same metrics viewed through the domestic measure of Swiss inflation are even lower. In July, domestic prices rose 0.1%; in June, they fell by 0.1%; and in May, they were unchanged. The 12-month inflation rate for the Swiss CPI in July was 0.4%; a year ago the 12-month change was 0.2%. Pinch me! Am I dreaming?

    And yes, Switzerland is on the same planet as the United States, Europe, and the United Kingdom.

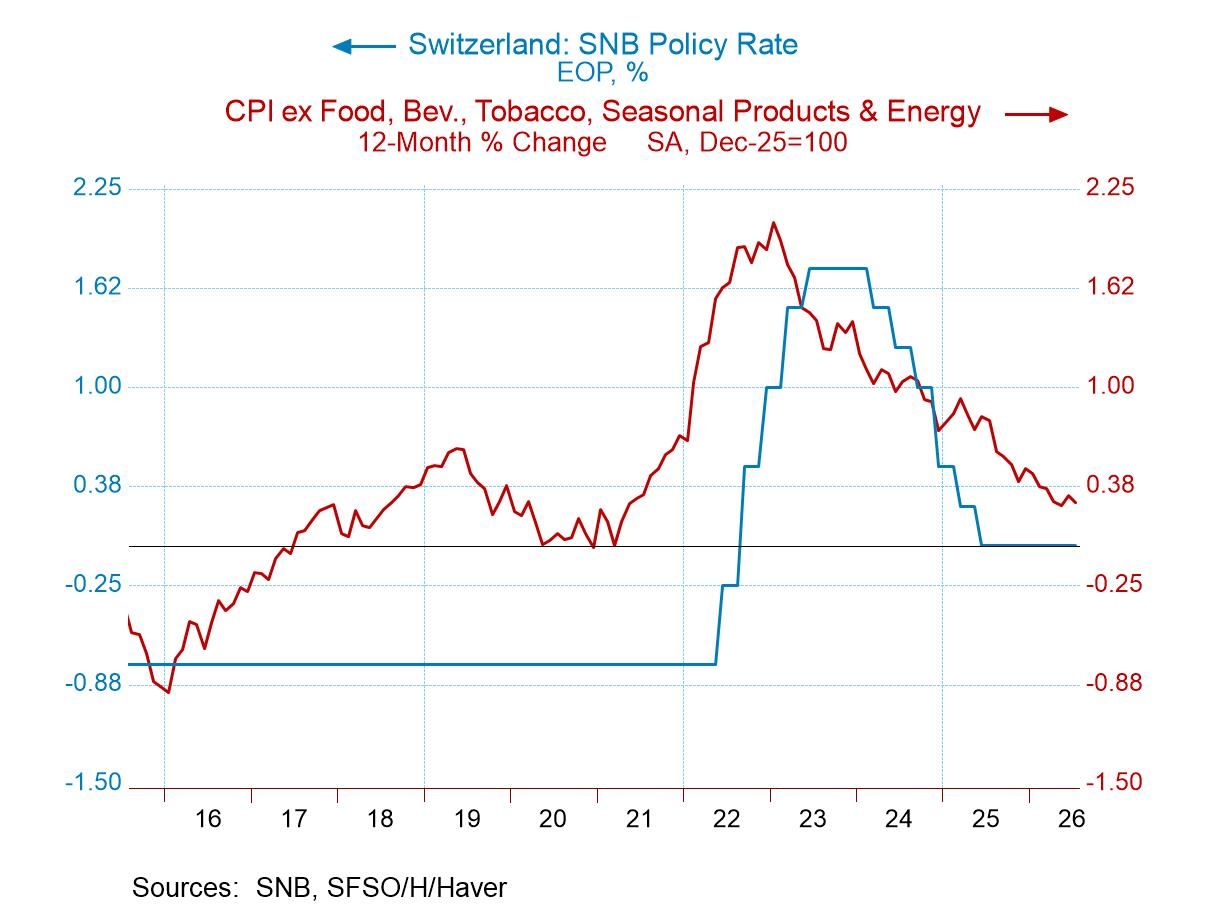
    Swiss inflation going back to 2020 has a peak year-over-year rate in its core of 2% based on monthly data. The headline 12-month rate at its peak was 3.4%. Excluding administered prices, the peak inflation rate in Switzerland was 2.7%. One of the main things that Switzerland has going forward is that the Swiss National Bank (SNB) has incredible credibility. It waited as long as the Fed did to raise interest rates, but it raised rates quickly up to the level of the core inflation rate. Once inflation began to fall, the SNB continued to raise rates until it became clear that the policy rate had begun to hover above the inflation rate. At that point, the bank flattened out its rate profile, then turned into a rate-cutting mode.

    Once again after the inflation rate had been arrested and fell below 1%, the SNB continued to cut rates until inflation was at zero and so were rates.

    The U.S. has not had the same experience with inflation. U.S. inflation has lingered and the Federal Reserve has continued to hold its policy rate above the 12-month trailing inflation rate.

    Swiss performance is unique, suggesting that monetary policy right now is not needed to control inflation, at least not in Switzerland. But this undoubtedly has a lot to do with expectations about the behavior of the SNB and the dynamics of the Swiss economy and capital markets.

    Swiss inflation began to track the 1% mark in early 2024. The core rate fell into line at the same time, with very little lag. This also is very unlike the U.S. experience.

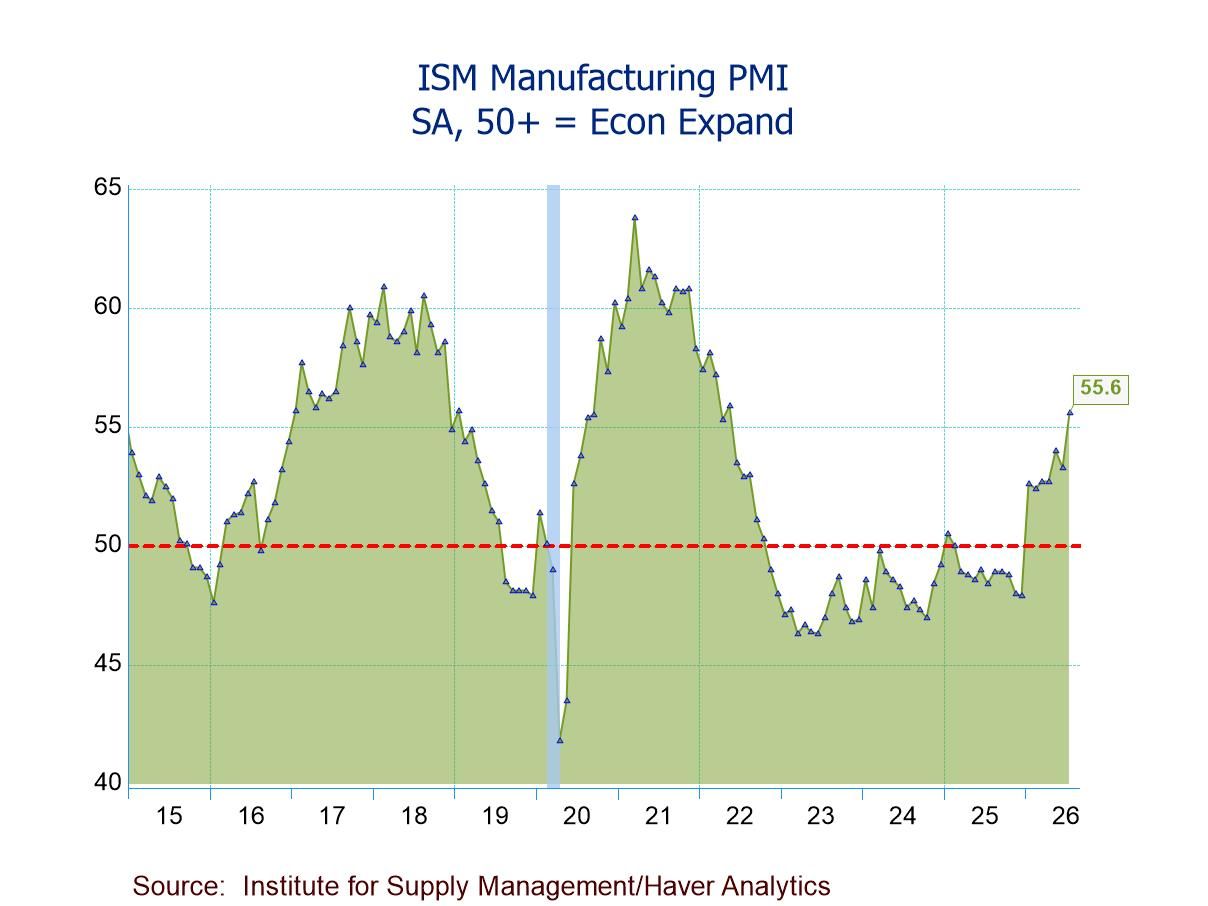
    • ISM Mfg. PMI up to 55.6 in July; seventh straight month above 50.
    • Production (58.5) reaches highest level since Nov. ’21 and expands for the ninth consecutive mth.; new orders (56.7) for the seventh successive mth.
    • Employment (52.8) above 50 for the first time since Sept. ’23; at highest level since Aug. ’22.
    • Prices Index (71.1) at a five-month low, still indicating prices rising for the 22nd straight mth.
    • Exports (53.0) highest since Mar. ’22; imports (55.7) highest since June ’21.
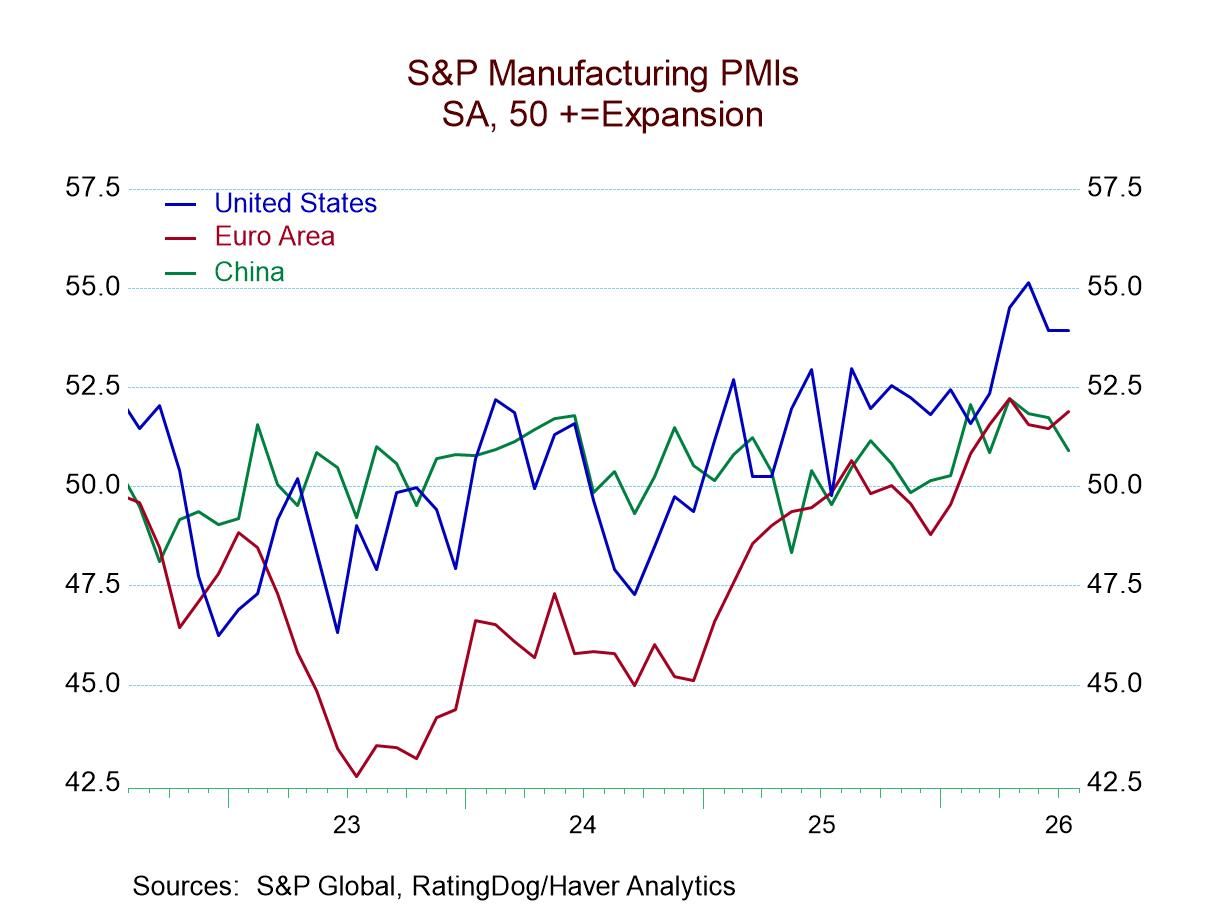
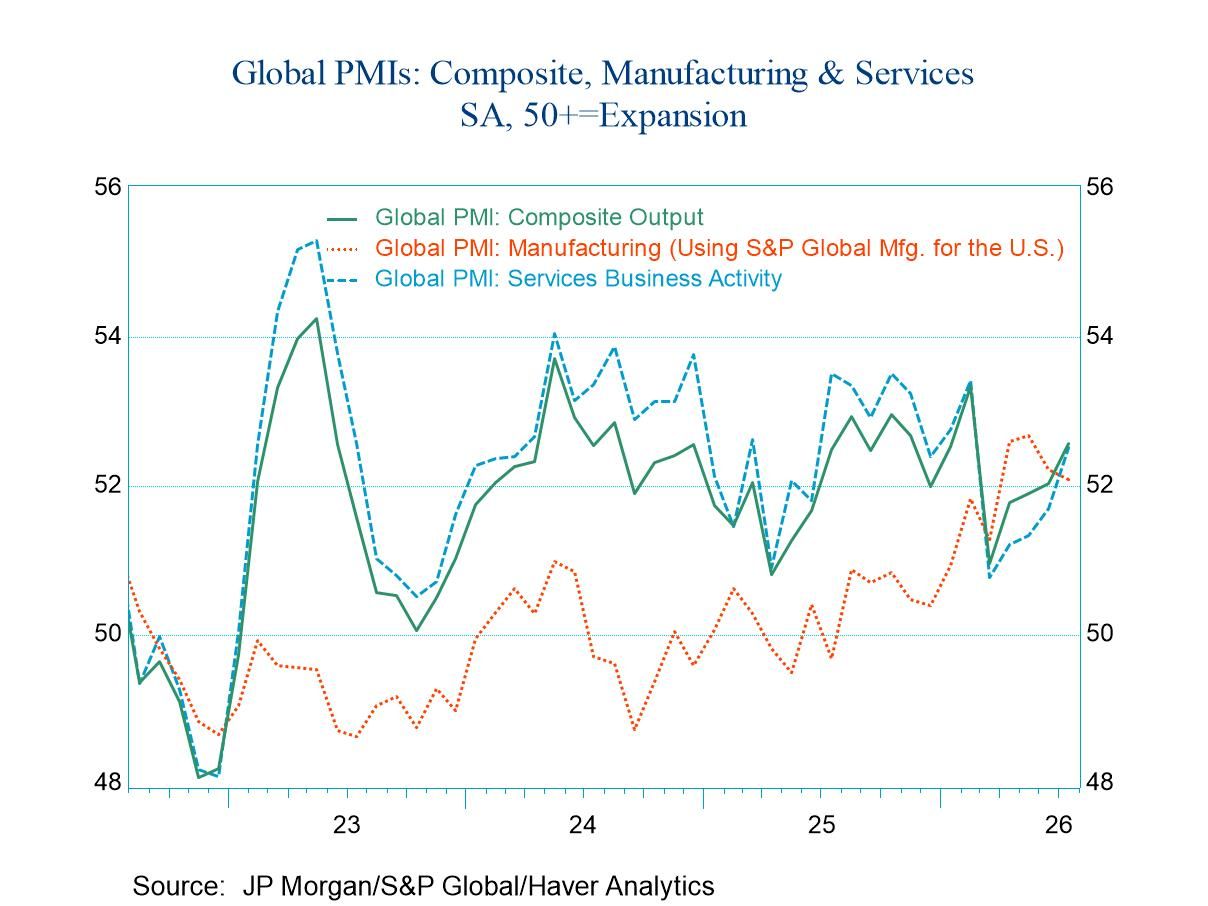
  • The S&P manufacturing PMIs for July show a group of 17 countries plus an aggregate for the European Monetary Union. Across these 18 observations, there is broad, but uneven, improvement on a month-to-month basis.

    The median reading for July increases slightly to 51.9, a gain of 0.5 diffusion points on a month-to-month basis.

    44.4% of reporters are improving on a month-to-month basis. Measured over three months compared to six months, 33.3% are improving; over six months compared to 12 months, 66.7% are improving; and over 12 months compared to 12 months ago, 83.3% are improving. Despite the monthly statistics showing a mixed performance and evidence of some soft spots, the general trend for manufacturing is to show that improvement is in place.

    The percentile standing for the July diffusion indexes on data back to 2021 shows an average standing of the 69th percentile across the 19 reporters. That means since 2021 the observations have generally been stronger than this only about 30% of the time, marking this as an ongoing improving situation for manufacturing.

    The reporting countries with percentile standings below their medians (below a 50% standing on a queue basis) are China, Russia, India, Brazil, Indonesia, and Turkey.

    The strongest countries on a queue percentile standing basis are Japan with a 91.0 percentile standing and Mexico with an 88.1 percentile standing. In addition, South Korea has an 85.1 percentile standing and Malaysia has an 83.6 percentile standing.

    At the bottom of the table, we have groupings of countries by various areas or characteristics. The developed group—which includes the United States, the United Kingdom, the European Monetary Union, Canada, and Japan—has an average queue standing in its 72.5 percentile. The BRIC countries have a standing in their 21.6 percentile and the average for Asia is in its 64.7 percentile. While the BRIC countries are lagging, generally speaking they had been performing better during the past; as of July, China has a diffusion reading for its manufacturing sector at 49.2, Brazil at 47.5, Russia at 50.7, and India at 53.5. The BRICs generate a low percentile standing, but their July diffusion readings are more centrist than the rankings might seem to imply.

    This report shows manufacturing engaged in some amount of recovery. However, there's still a lot of unevenness in the global economy, still a lot of work left to do, and still a lot of geopolitical risks in play.

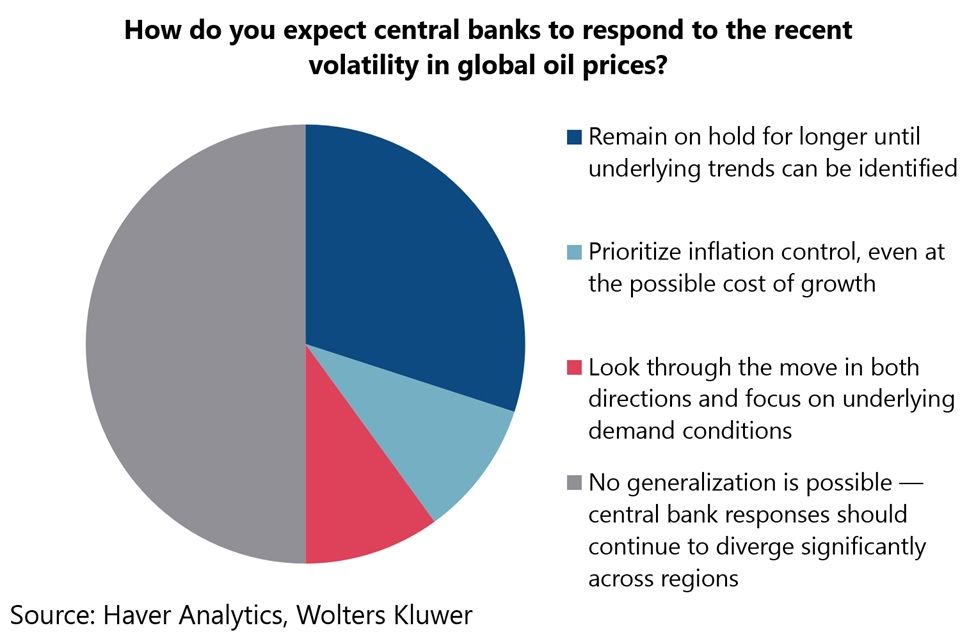
  • In this week's Letter, we dive into the latest Blue Chip Financial Forecast (BCFF) survey results in light of key developments around Asia and the broader world economy. We find that, despite the recent flare-up in US-Iran tensions, panellist expectations for policy rates remain little changed, bar the US (chart 1). Central banks are still seen as likely to continue diverging significantly across regions in response to the volatility in global oil prices (chart 2). The latest on the US-Iran conflict brings hopes of another deal on the horizon, as part of a broad on-again, off-again pattern. Those hopes have sent crude oil prices lower, albeit with flows through the Strait of Hormuz remaining at a trickle (chart 3). As global oil supply remains constrained, one key area to watch is Chinese crude oil imports (chart 4), which have slumped since the conflict broke out. There is no telling when Chinese buying will recover, if ever, and if so, by how much. Moving to Japan, and taking these developments into account, the Bank of Japan held its policy rate steady at its recent meeting. Inflation risk is still flagged as being tied to the upside (chart 5). That may threaten to upend real wage gains this year, should a price flare-up materialise extensively enough. Yen intervention talk has also returned to the fore, with the US and Japan confirming recent intervention moves. Both have signalled that more may come if needed, although the yen remains squarely within its longer-term weakening trend (chart 6).

    Blue Chip Financial Forecasts Last week, we published the August 2026 Blue Chip Financial Forecast survey results. Despite the flurry of recent headline developments around the world, we found panellist expectations only modestly changed from last month. In particular, views of 12-month ahead policy rates were little changed or unchanged for every economy bar the US (chart 1). US expectations now point to slightly higher policy rates than a month ago. Among the economies covered by the survey, the highest expected 12-month ahead policy rates still relate to Australia, followed by the US and the UK. At the other end, the lowest expected rates relate to Japan and Switzerland. The slightly higher expected US policy rate may well incorporate, among other factors, the recent re-escalation in US-Iran tensions and the inclinations of new Fed Chair Warsh. We return to those tensions in a later section below.