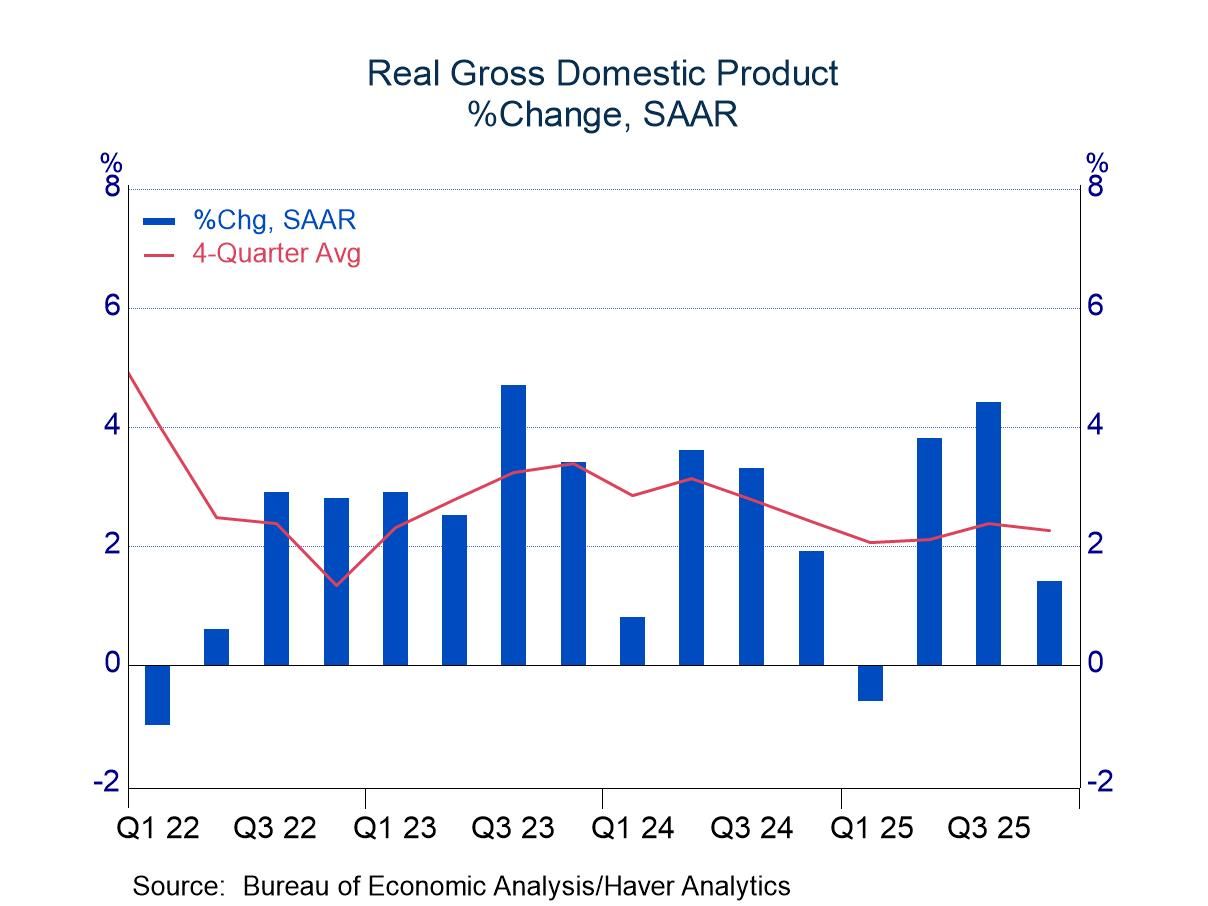
- Non-federal activity was lighter than expected, but still respectable.
- PCE inflation remains stubborn.
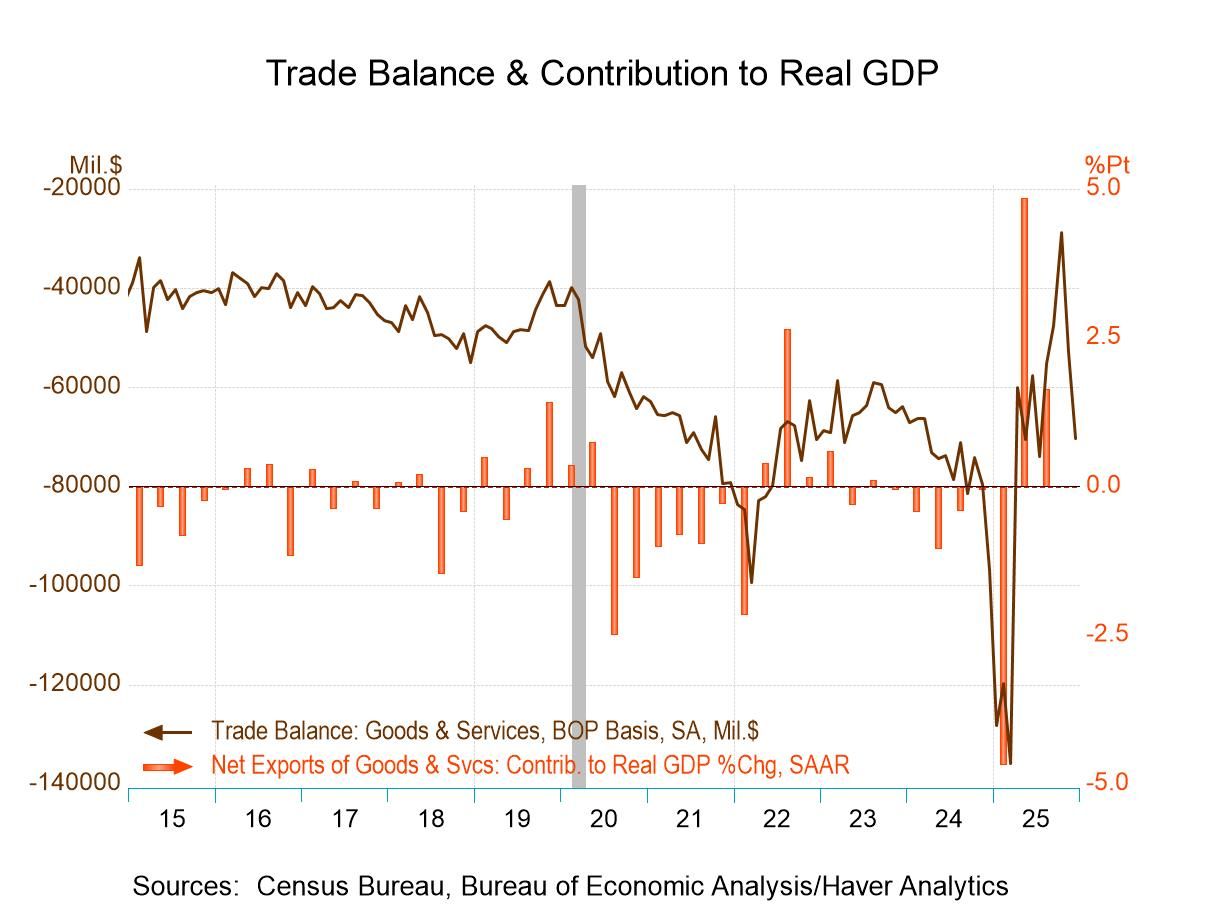
Q4 GDP: Constrained by Federal Spending
More Commentaries
- USA| Feb 19 2026
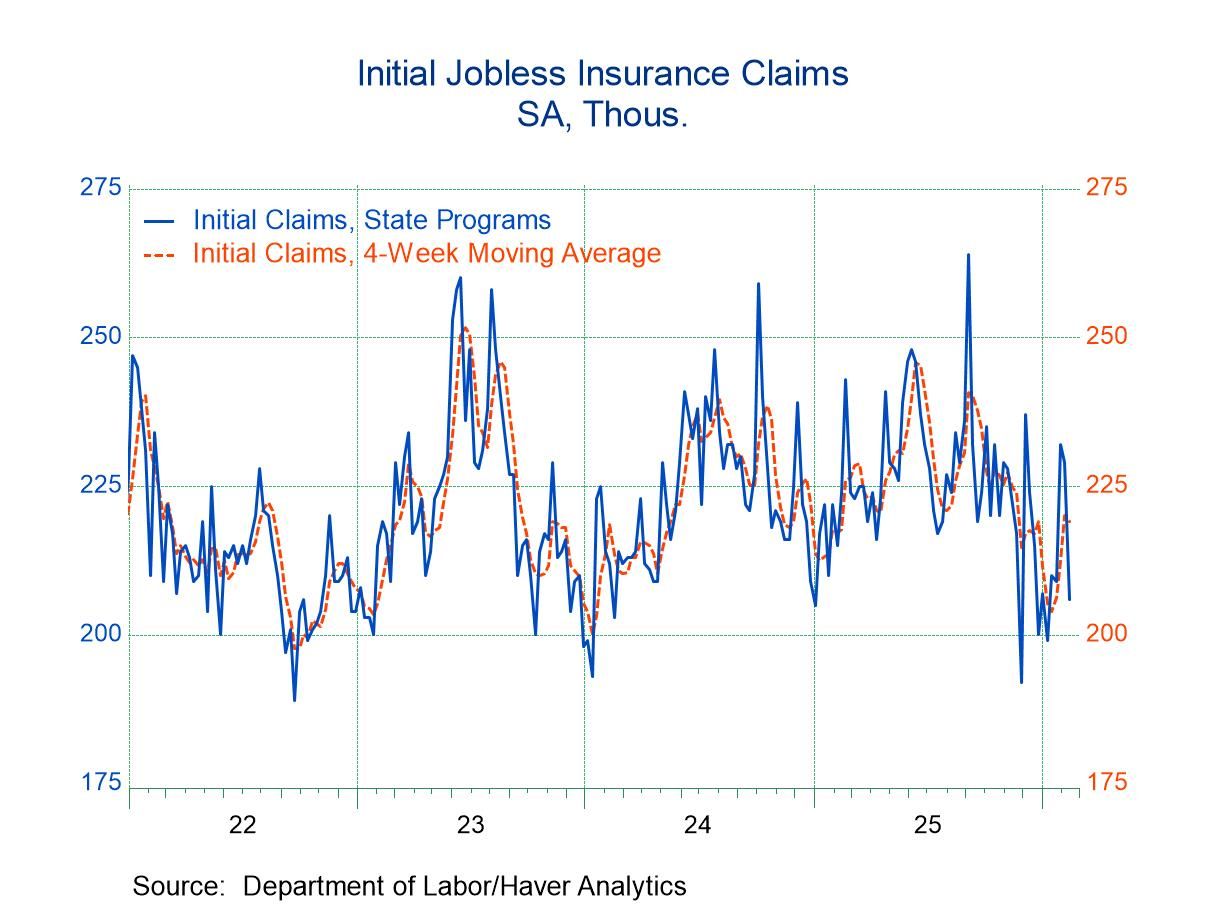
U.S. Initial Unemployment Claims Declined in Latest Week
- New claims dropped by 23,000 to 206,000.
- Continuing claims rose by 17,000 to 1.869 million.
- The insured unemployment rate remained at 1.2% for the 11th consecutive week.
- Belgium| Feb 19 2026
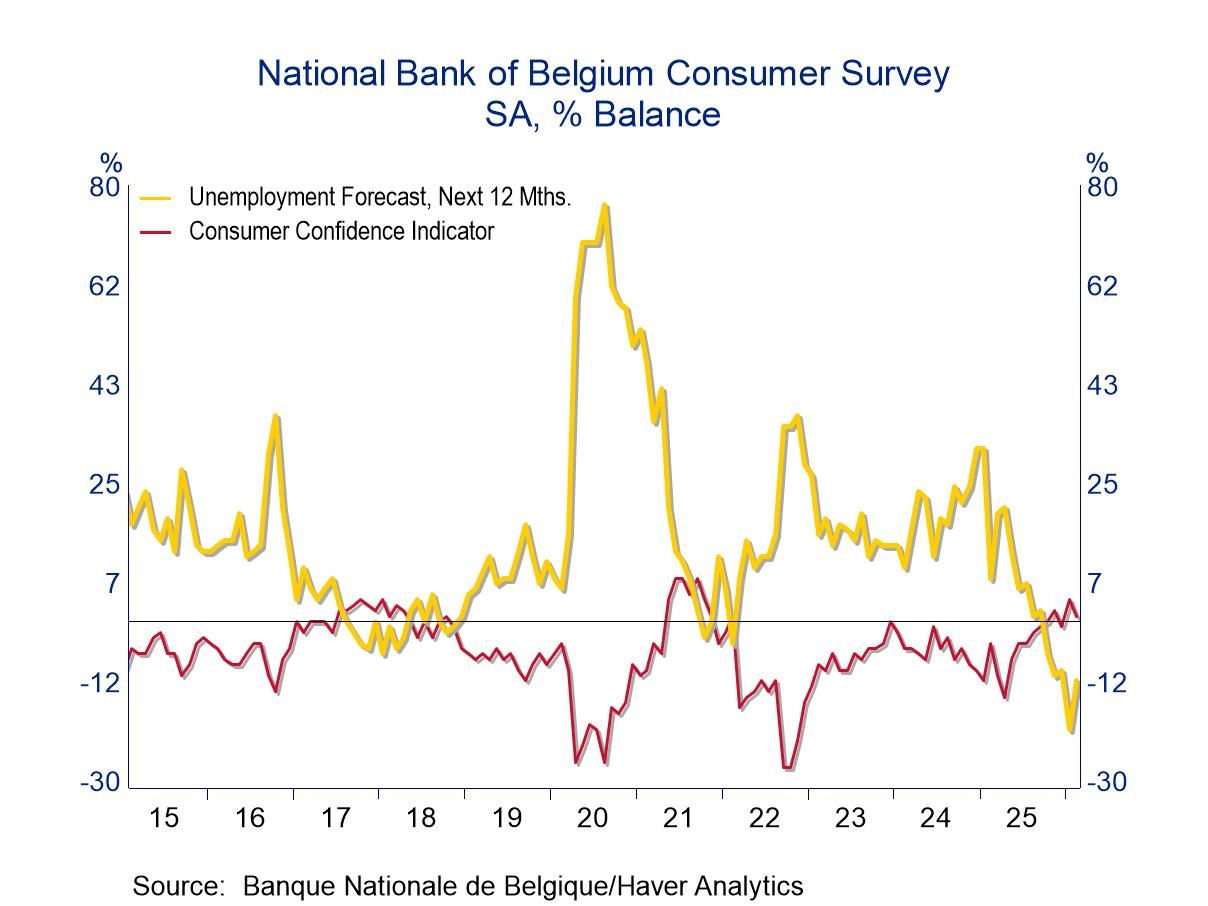
Belgian Consumer Confidence Clings to a Positive Reading
Belgian consumer confidence slipped in February. But it has made a long climb back to positive territory and that reading is holding on at +1 in February, down from +4 in January.
Belgian consumer confidence has been slowing progressing from a reading of -4 twelve-months ago to -2 six-months ago and to +2 just three-months ago. This progression shows a trend of improvement under way for the Belgian consumer.
Also, importantly, the queue reading of the consumer index in February is at a standing of 85.3, a top 15-percentile reading on data since 1991.
The economic situation is not as robust. It has improved for the next 12 months to -25 from a reading of -29 in January. There is a slight weakening in readings from 12-months to 6-months to 3-months, and the current February reading of -25 diffusion has a 15-percentile standing on data back to 1991. This concept carries a larger negative value over the next 12 months than under the last 12 months. However, that reading nonetheless has a stronger standing at its 24.9 percentile than the outlook for the 12 months ahead. The economic situation is clearly suppressed compared to the confidence reading.
Prices show a slight weakening for the next 12 months compared to the January reading. However, the 12-month to 6-month to 3-month readings show a move up to stronger price levels. The ranking of the February price reading is a top 16-percentile reading; inflation in Belgium is still on the hot side.
However, prospects for unemployment have shifted sharply to show a much lower expectation of unemployment; unemployment expectations increased from -20 in January to a diffusion reading of -11 in February, with a ranking in its lower two percentile.
The environment for making a major household purchase over the next 12 months has eroded over the past few months, although it shows a trend toward improvement from 12-months to 6-months to 3-months. Still, the February reading has a 29.7 percentile standing, well below its historical median (represented by a 50 percentile standing).
The ‘favorable to spend at present’ index weakened quite sharply in February and has been slipping from 12-months to 6-months to 3-months. It registered in February a standing in only its 10th percentile, extremely weak. The consumer is not leading Belgium into recovery on the back of spending.
The financial situation expected over the next 12 months has been relatively static month-to-month as well as across the last 12 months. The ranking for expected conditions is weak at a 34th percentile reading. But the current financial situation, while stepping back on the month, has an 82.7 percentile standing. The financial situation reading appears to be in some flux, but the actual current readings have been firm in relatively strong territory for some time.
Household savings for the next 12 months backed down in February but had been strengthening over the past year. The February reading is quite high, a top 9-percentile reading. The favorability to save has not changed much over the past year but has eroded slightly in February. The February current assessment for savings is at a 62.2 percentile reading, much weaker than its 12-month outlook reading.
The Belgian consumer is experiencing some crosscurrents. Consumer readings are underpinned by low expectations for unemployment and by a solid current situation appraisal. However, the economic situation remains weak and is not trending higher and inflation readings are still uncomfortably high.
- USA| Feb 18 2026
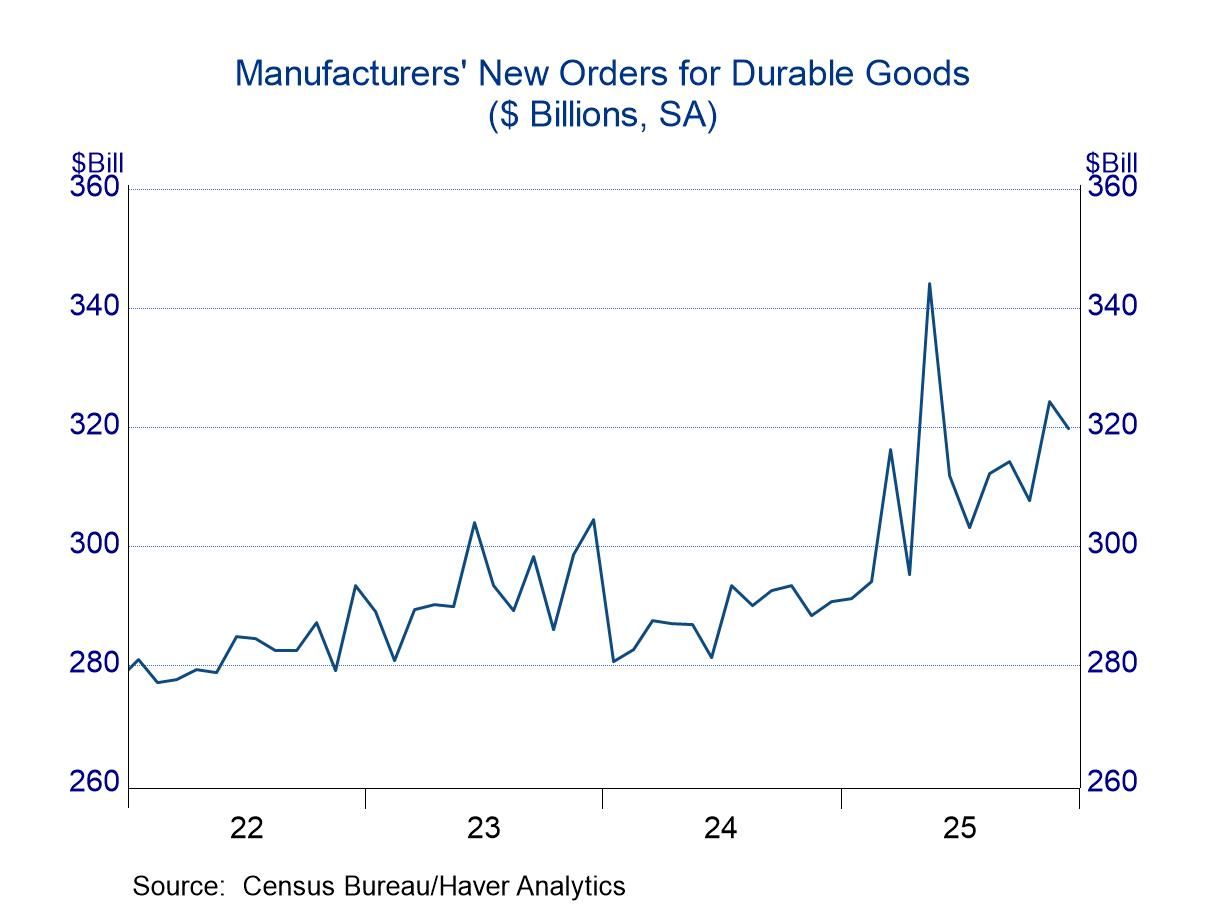
Durable Goods Orders: Irregular Upward Trend Continues
- A broad-based advance in December offset a drop in aircraft bookings.
- Unfilled orders are beginning to build.
- Orders for nondefense capital goods ex-aircraft remain on a solid path.
- USA| Feb 18 2026
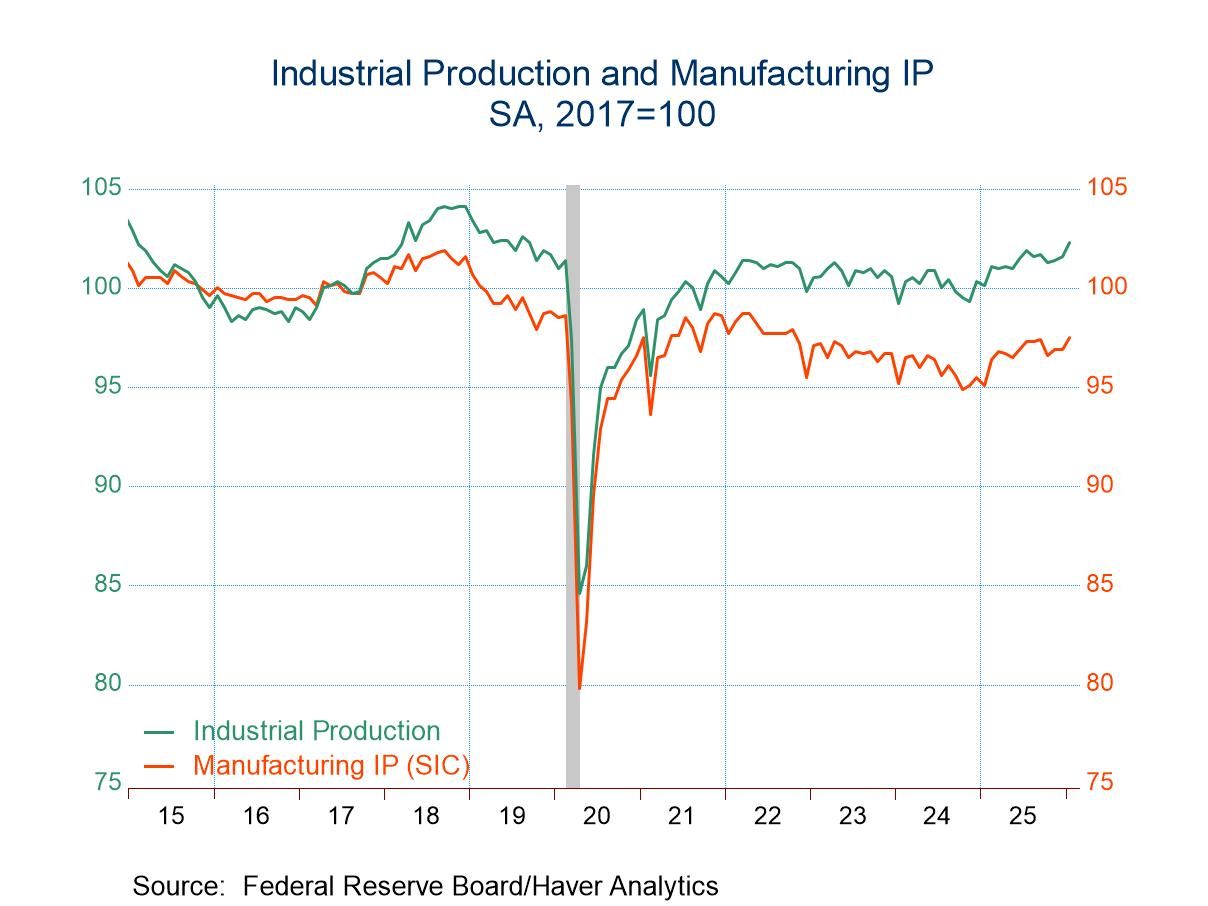
U.S. Industrial Production Jumped in January
- Total industrial output increased a larger-than-expected 0.7% m/m in January.
- However, there were meaningful downward revisions to the previous two months.
- Manufacturing output increased 0.6% m/m, mining declined 0.2% m/m, and utilities production jumped 2.1% m/m.
- Rates of capacity utilization edged up in January but remained well below their long-term averages.
by:Sandy Batten
|in:Economy in Brief
- USA| Feb 18 2026
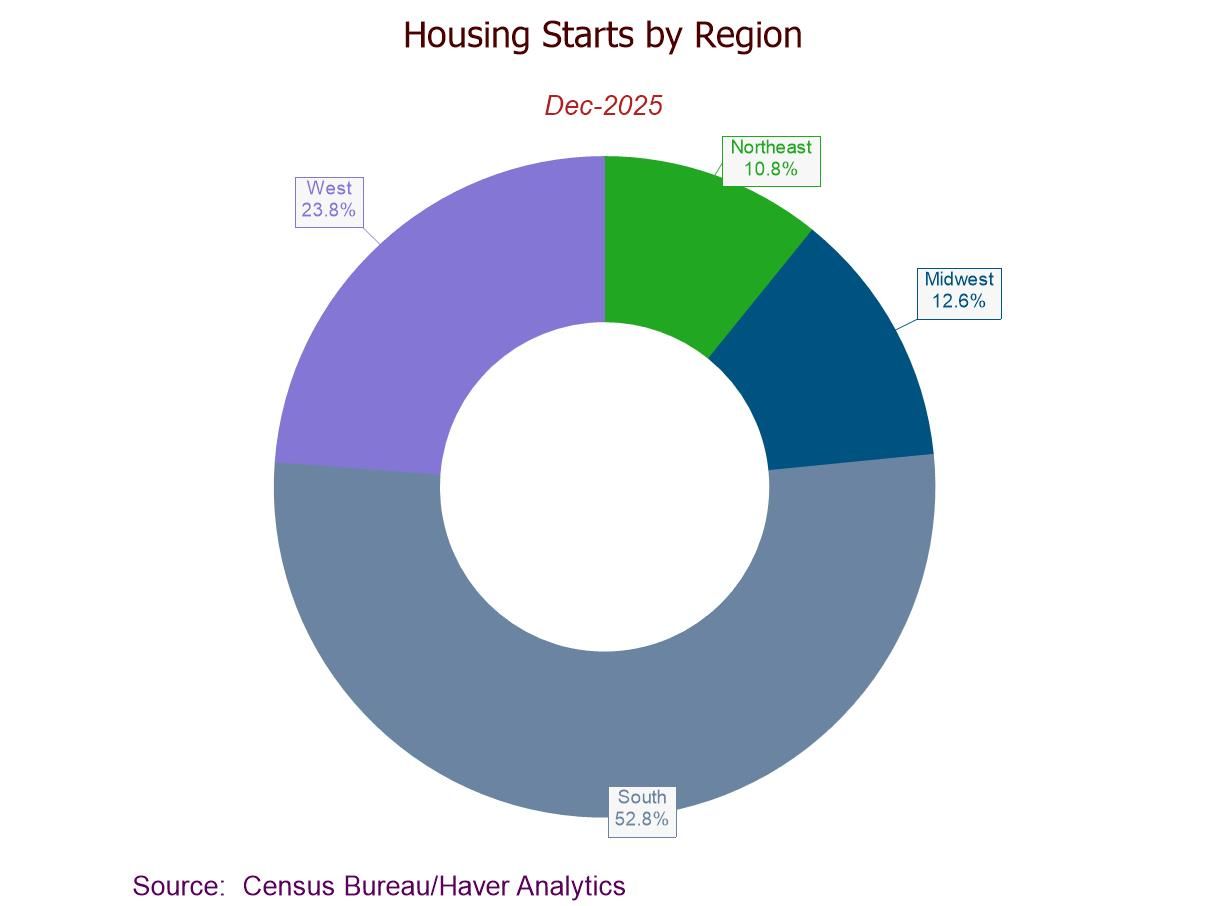
U.S. Housing Starts Advance in December to a Five-Month High
- Housing starts +6.2% (-7.3% y/y) to 1.404 mil. in Dec.; third m/m gain in four months.
- Single-family starts up to a 10-month high; multi-family starts up to a three-month high.
- Housing starts m/m up in the West, Northeast, and Midwest, but down in the South.
- Building permits recover to a nine-month high, led by a rebound in multi-family permits.
- USA| Feb 18 2026
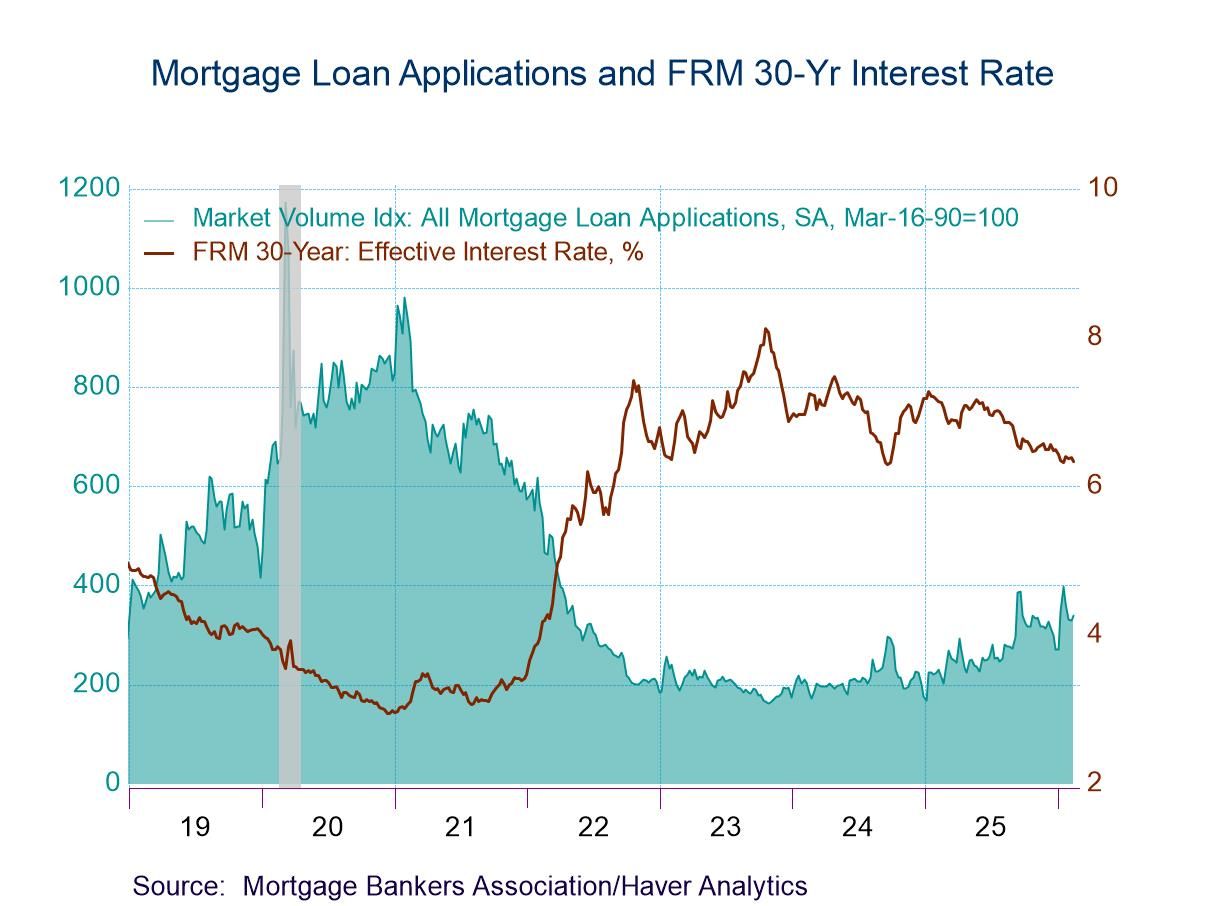
U.S. Mortgage Applications Rose in the February 13 Week
- Applications for loans to purchase declined in the latest week while refinancing loan applications rose.
- Effective interest rate on 30-year fixed loans declined 5bp to 6.33%.
- Average loan size rose.
- United Kingdom| Feb 18 2026
U.K. Inflation Waffles and Percolates
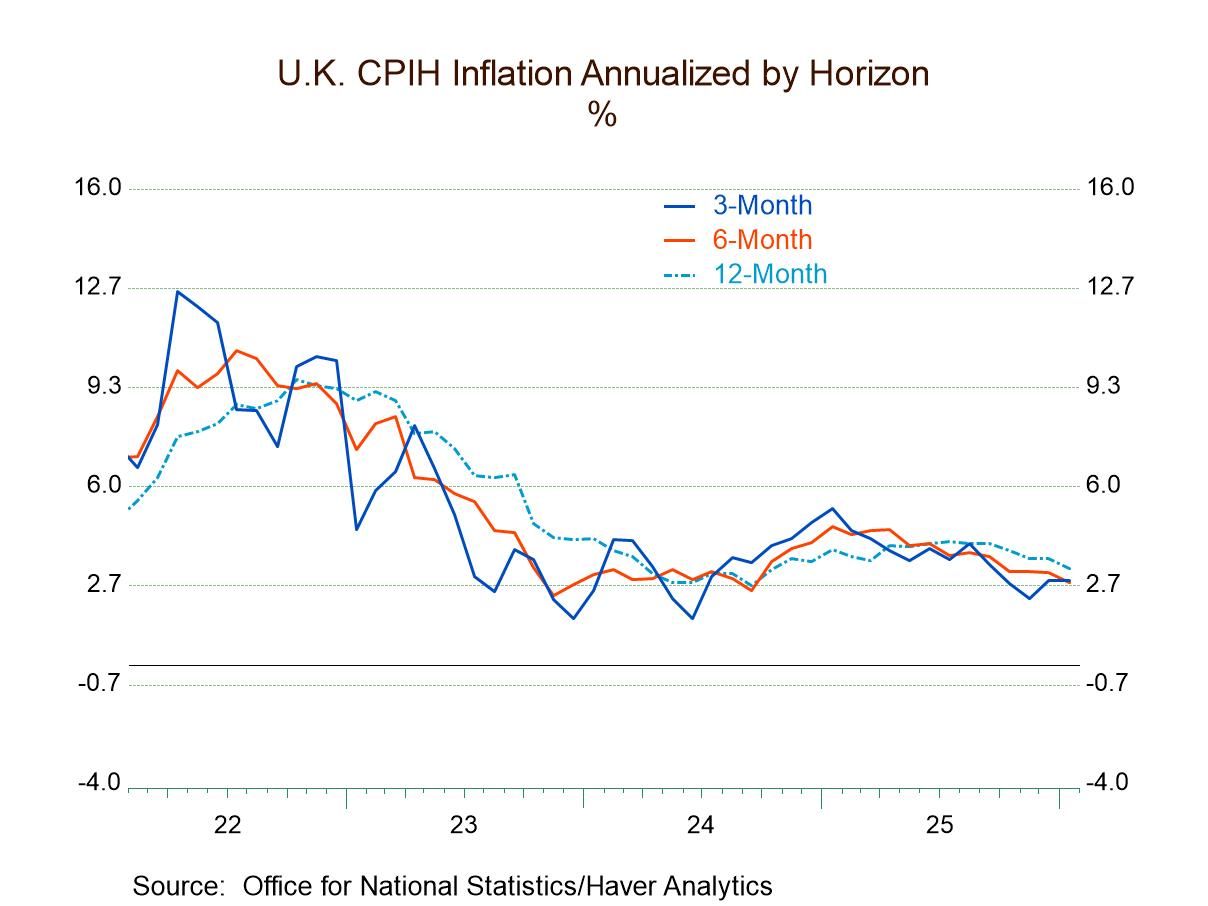
Inflation in the United Kingdom has irregularly downshifted over the past two months. In January, consumer price inflation remained steady at 2.8% over three months, the same pace as over six months. Core inflation ticked up to 3.3% over three months from 3.1% over six months but settled below the 12-month pace of 3.4%. Yet another measure, the HICP, comparable to the inflation rates reported by ECB numbers, logs 2.5% over three months, a slight uptick from six-month pace but less than the 12-month pace of 3%.
Diffusion The diffusion statistics that measure the breadth of acceleration of inflation across categories month-to-month came in at only 16.7% in January, down from 66.7% in December and compared to 33.3% in November. Diffusion readings below 50% indicate more deceleration than acceleration. So, inflation has been under control, with recent results showing more deceleration for inflation monthly than to accelerate. December was an exception. Over the 3 , 6 , and 12 month periods, inflation shows some acceleration tendency over 3 months, with diffusion at 58.3%; but that compares to 6-month diffusion at 16.7% and 12-month diffusion at 25%. Once again, the broad stroke for inflation, trending from 12 months to 6 months to 3 months, is showing more categories decelerating than accelerating.
Inflation rate ranking The final right-hand column ranks inflation rates on data back to 2000 based on their year-over-year performance. The current HICP, at 3%, has a 73.8 percentile standing among inflation rates back to 2000, marking it near the upper 25 percentile of the collection of results. The CPIH has a 79.6 percentile standing, putting it closer to the top 20% of observations over that same span. Core inflation at 3.4% has an 83.7 percentile standing, putting it in nearly the top 15% of results on data back to 2000.
Convergence around 2.8% The chart, supplemented by diffusion data, clearly shows that there is some inflation deceleration in progress; however, the level of year-over-year inflation still shows inflation among the upper ranges of what it's been over the last 25 years.
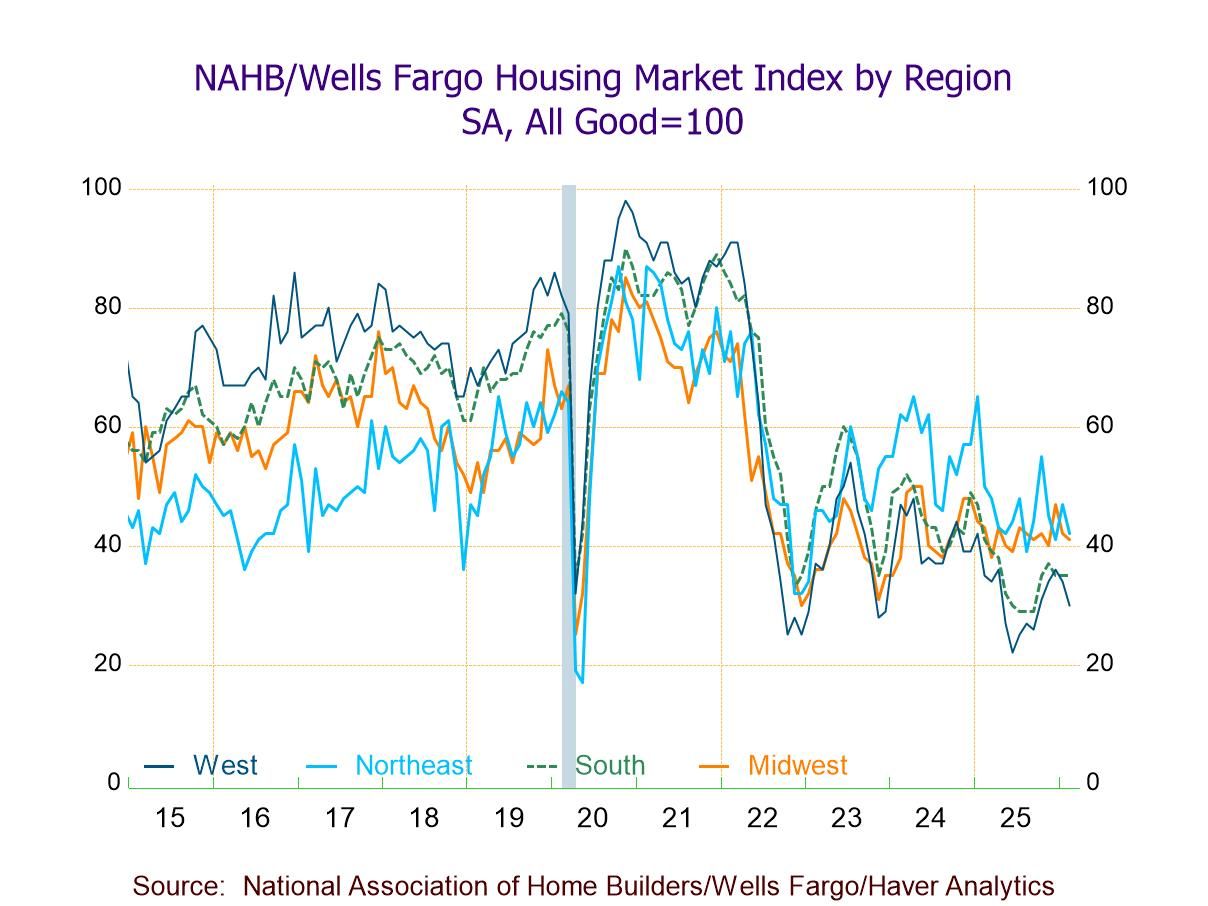
- HMI continues to weaken in Feb., indicating most builders remain pessimistic about the current and near-term housing outlook.
- Two of three HMI components fall, w/ the steepest m/m decline in potential buyers' traffic (-8.3%).
- Regional weakness continues, w/ the sharpest m/m drop in the West (-11.8%).
- of2696Go to 1 page


 Global