

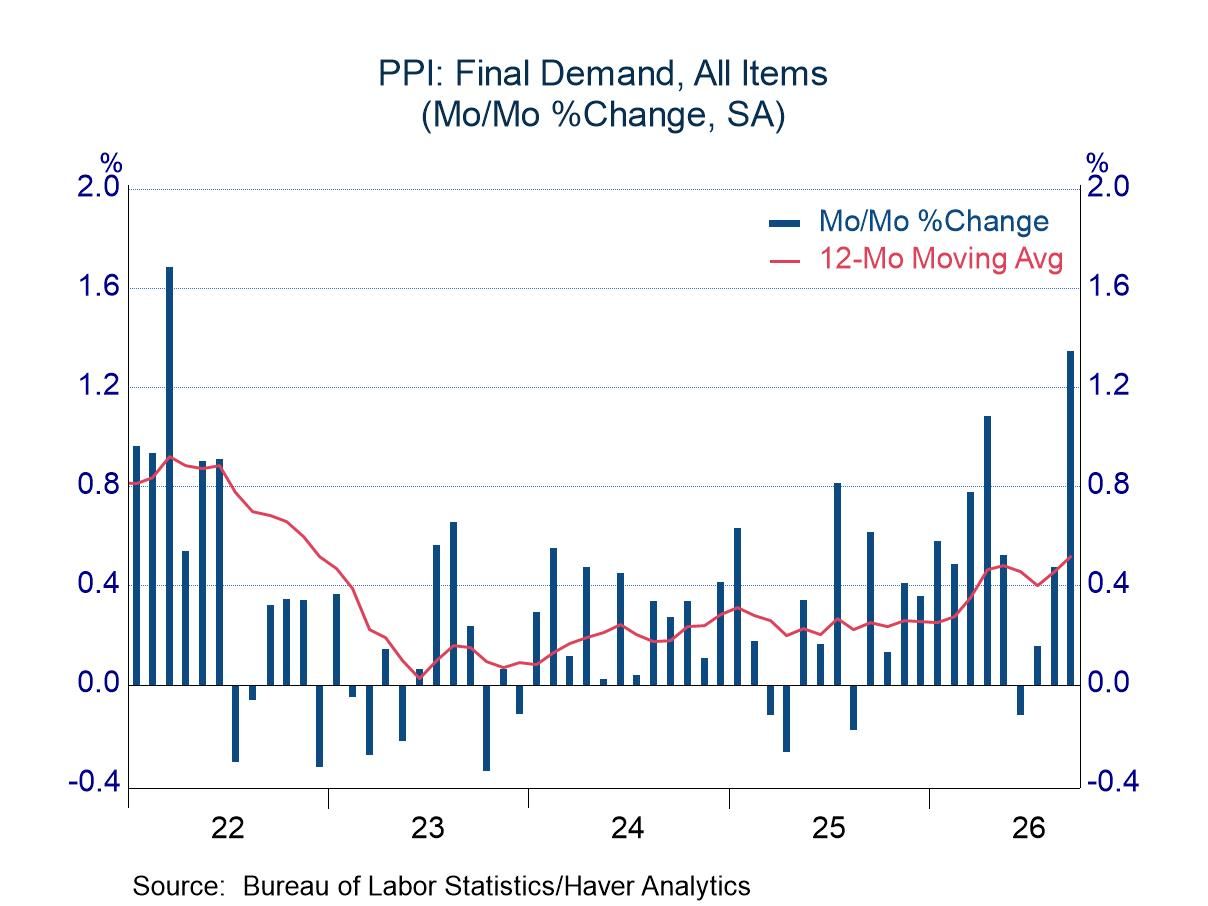
- Results exceed expectations by wide margins.
- Yr/Yr percent changes were the sharpest since December 2022.
USA| Oct 15 2026
September PPI: High-Side Readings on Food and Energy; Uncomfortable increase in Core
More Commentaries
 Europe| Oct 14 2026
Inflation in EMU Spikes. Yikes!
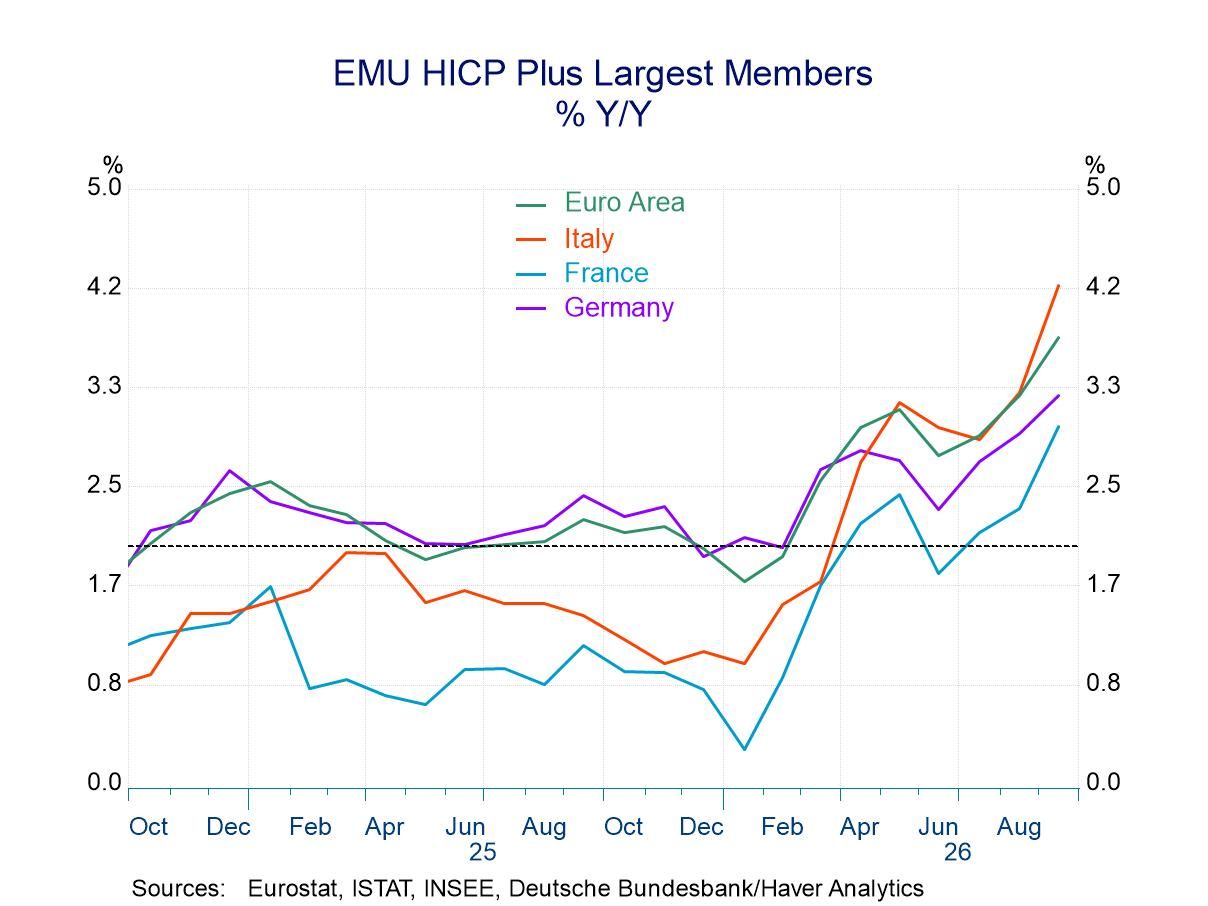
The inflation chart and the table are unanimous on the inflation verdict for the European Monetary Union in September. No matter how you twist and turn it, unless you turn the chart upside down, there's no good news here on the inflation front.
A really bad month for inflation, but not a surprise, part of a trend The monthly news is bad for the aggregate data. The monetary union inflation level, for both the headline and the core readings, looks worrying. Across the four largest economies, the monthly data are quite bad for the headline figures and not very good for the core or the ex-energy readings either.
Trending higher The chart just sticks to year-over-year percentage changes. It doesn't get knee-deep in different sequential measures, but it's clear from the chart that year-over-year inflation is once again engaged in an upswing, and the year-over-year gains for each of the four largest countries are above the 2% mark that the European Central Bank has set for the community. While the ECB target is for the whole community, not for any individual country, with all four of the largest economies showing this kind of an excess, it clearly indicates bad news for the community at large.
Sequential pressure The data in the table provide information on the sequential development of inflation. There we see the headline from 12 months to six months to three months, as we shorten the horizon, with accelerating trends from 3.8% over 12 months to 4% over six months to 6.5% over three months, all annualized rates. The core is better behaved but still shows acceleration from 2.5% over 12 months to 2.7% over six months to 3% over three months. Acceleration is the watchword.
Large economies adverse trends Looking at individual members, the four largest economies show us excessive increases in September month to month, ranging from a 1% gain in Italy to a 0.5% gain in Germany. Sequential inflation shows acceleration for each of the large foreign economies, which is by itself rather disturbing, but the year-over-year rates are as low as 3.3% for Germany and as high as 5% for Spain, and with the three-month rates as low as, and let me repeat this–as low as–a 5.5% annual rate over three months in Italy and as high as a 9.1% annual rate for Spain. This is a very painful habitat for inflation over three months to range from 5.5% to 9.1% when the target is 2%.
Inflation metrics There are three metrics for inflation: headline, core inflation, and ex-energy inflation. These numbers are a little more subdued but still over the top in terms of the ECB target of 2%. The month-to-month numbers are not as chilling, with Germany showing an ex-energy increase of just 0.2% and Spain showing 0.4% at the high end in September. But the sequential numbers show 12-month gains of 2.2% inflation in Germany ex-energy, a 1.5% gain in Italy, which leaves it below the ECB’s desired pace, and a 3.1% increase over 12 months in Spain. These core or ex-energy speeds step up over six months and then step up again over three months. Acceleration is broad-based. Over three months, we see a low pace of 2.4% for Italy, a high pace of 3.7% for Spain, with Germany at 2.6%. Progressing from 12 months to six months to three months, we lose the temperate inflation in Italy, which over three months moves up over the 2% mark, and we log inflation rates of 2.6% in Germany and 3.7% in Spain. The core inflation is lower than headline inflation by a good solid margin. In each of these cases, headline inflation over three months is at least twice the core (or ex-energy) three-month pace. However, core inflation is generally more stubborn and harder to get rid of. In the case of Germany, ex-energy inflation is at 2.6%; Italy logs a 2.4% pace. Those two are not too far above the 2% target, but Spain at 3.7% is much more troublesome.
 USA| Oct 13 2026
U.S. Existing Home Sales Rebound in September
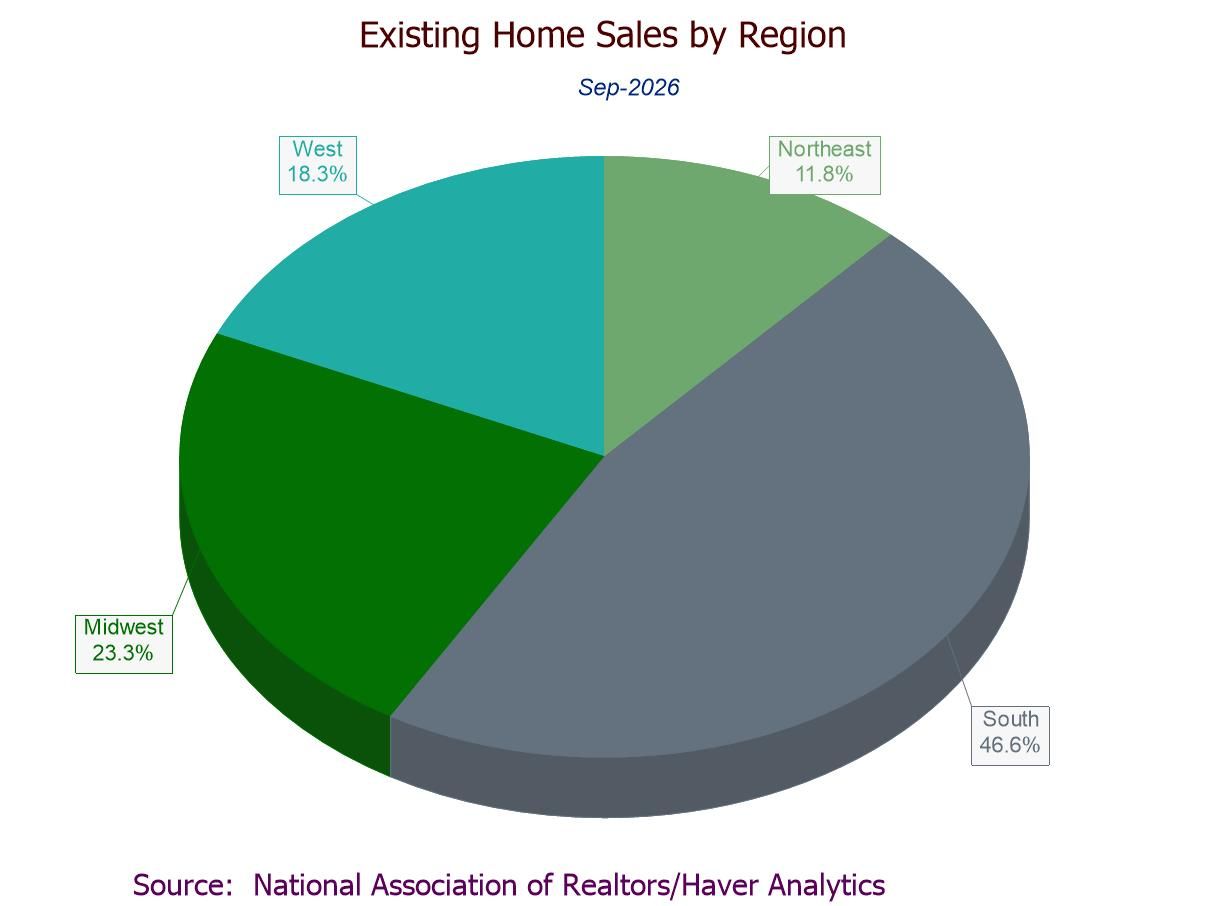
- September sales +1.5% m/m to 3.99 mil., first m/m rise since May; -2.2% y/y, second straight y/y drop.
- Sales m/m up in the South (+2.8%) and West (+2.8%); down in the Northeast (-2.1%); flat in the Midwest.
- Sales y/y down in all four regions, w/ the steepest decline in the West (-5.2%).
- Median sales price -2.4% (+1.3% y/y) to $417,500, lowest since April.
- Unsold inventory +1.9% (+4.6% y/y) to 1.60 mil. units, highest level since Nov. ’19; 4.8 months' supply, highest since Nov. ’15.
 Asia| Oct 12 2026
Economic Letter from Asia: Keeping it Real
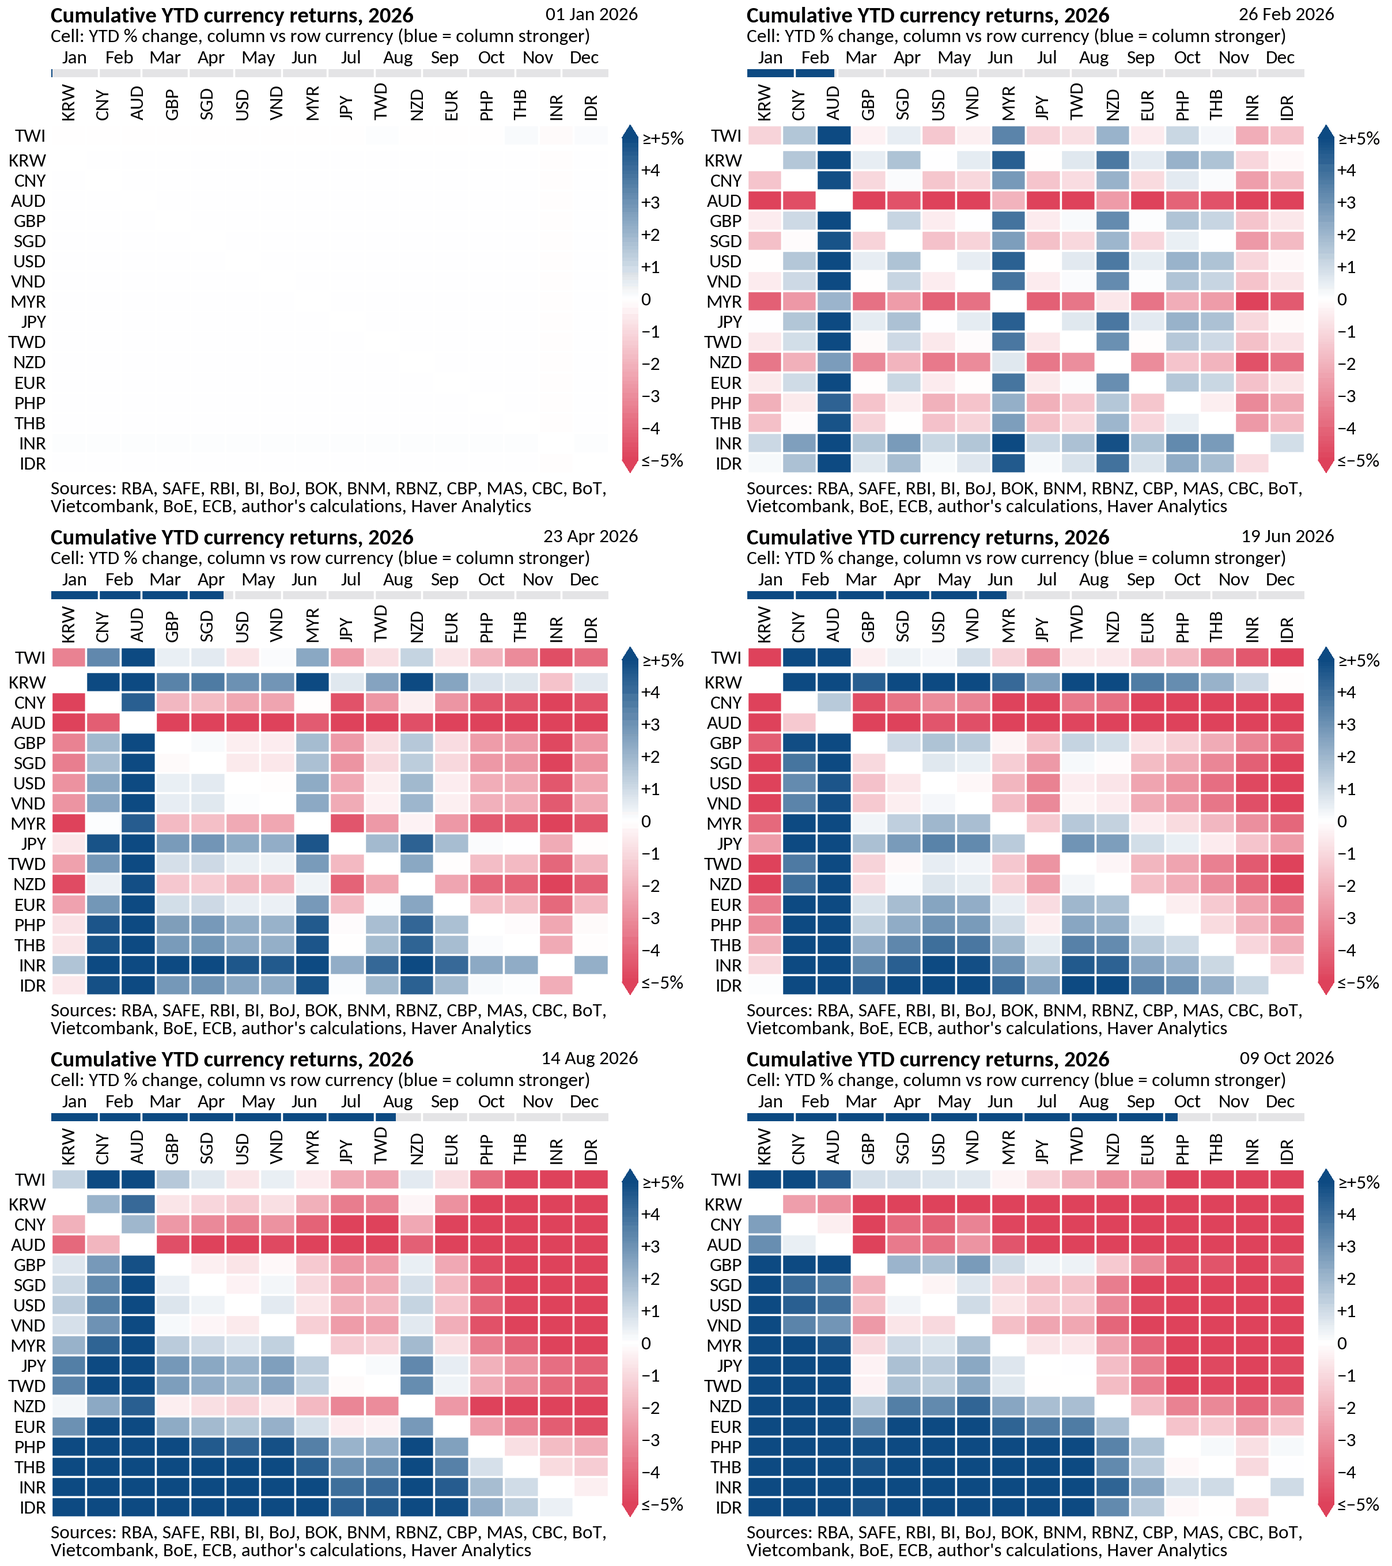
In this week’s Letter, we look past traditional drivers of exchange rates (e.g. interest differentials) to the real, and largely domestic, forces now shaping Asia’s currency and fixed income markets. Currency performance has diverged sharply this year, with the South Korean won (KRW), Chinese yuan (CNY), and Australian dollar (AUD) gaining on a trade-weighted basis while the Philippine peso (PHP), Thai baht (THB), Indian rupee (INR), and Indonesian rupiah (IDR) have lagged (chart 1). Daily moves against the dollar sort into two clusters (chart 2). One is a tight group of CNY, AUD, New Zealand dollar (NZD), THB, Singapore follar (SGD) [AC1.1]and Malaysian ringgit (MYR), reflecting a common dollar effect and the region’s close trade ties with China. The other, looser group links PHP, IDR and KRW. Yield differentials explain only part of this dispersion (chart 3). Across 13 economies, changes in 10-year spreads over the US account for a modest share of currency returns. Stripping out outliers improves the fit considerably, perhaps suggesting spreads still matter once idiosyncratic stories are set aside. In fixed income markets, economy-specific drivers have dominated. Indonesia, Australia, New Zealand and, most recently, India have tightened, yet real policy rates remain slightly negative in half the region (chart 4), leaving policy accommodative in real terms. Real bond yields have also climbed in Japan, Korea and Australia (chart 5), pointing beyond inflation expectations to heavier fiscal spending, the AI-driven export boom and tighter policy. Looking ahead, a strengthening El Niño, disrupted traffic through the Strait of Hormuz, the AI buildout and the risk of renewed US-China friction (chart 6) will shape the region’s fiscal and monetary planning. That, in turn, will steer the path of yields and currencies in the period ahead.
Asia currencies Trade-weighted currency performance across Asia has been strikingly uneven this year (chart 1). KRW and CNY have each significantly appreciated against their trading partners[AC2.1], with AUD not far behind. At the other end, PHP, THB, INR and IDR have each lost much ground on the same basis. Between these extremes, SGD, MYR, JPY and TWD have moved by about 2% or less in either direction. Some of this relative performance reflects correlated trades, whether with commodity prices or with other currencies. Yet a range of other drivers has also been at work, including economy-specific domestic considerations such as inflation, policy settings and external balances. Against the US dollar alone, the spread is wider still, from a gain of about 7% for KRW to a loss of a similar size for INR (chart 3). The sections that follow take these drivers in turn, starting with how the region’s currencies move together.
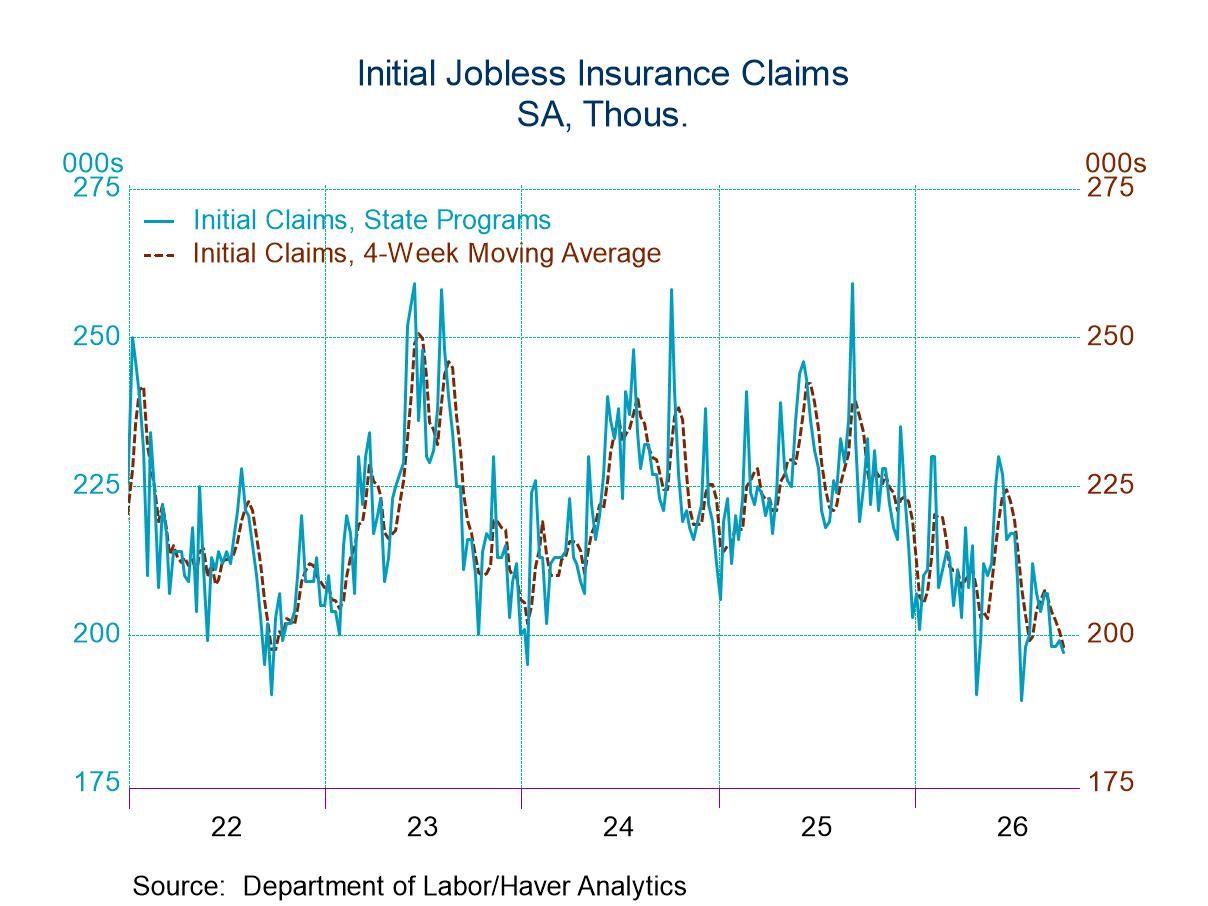
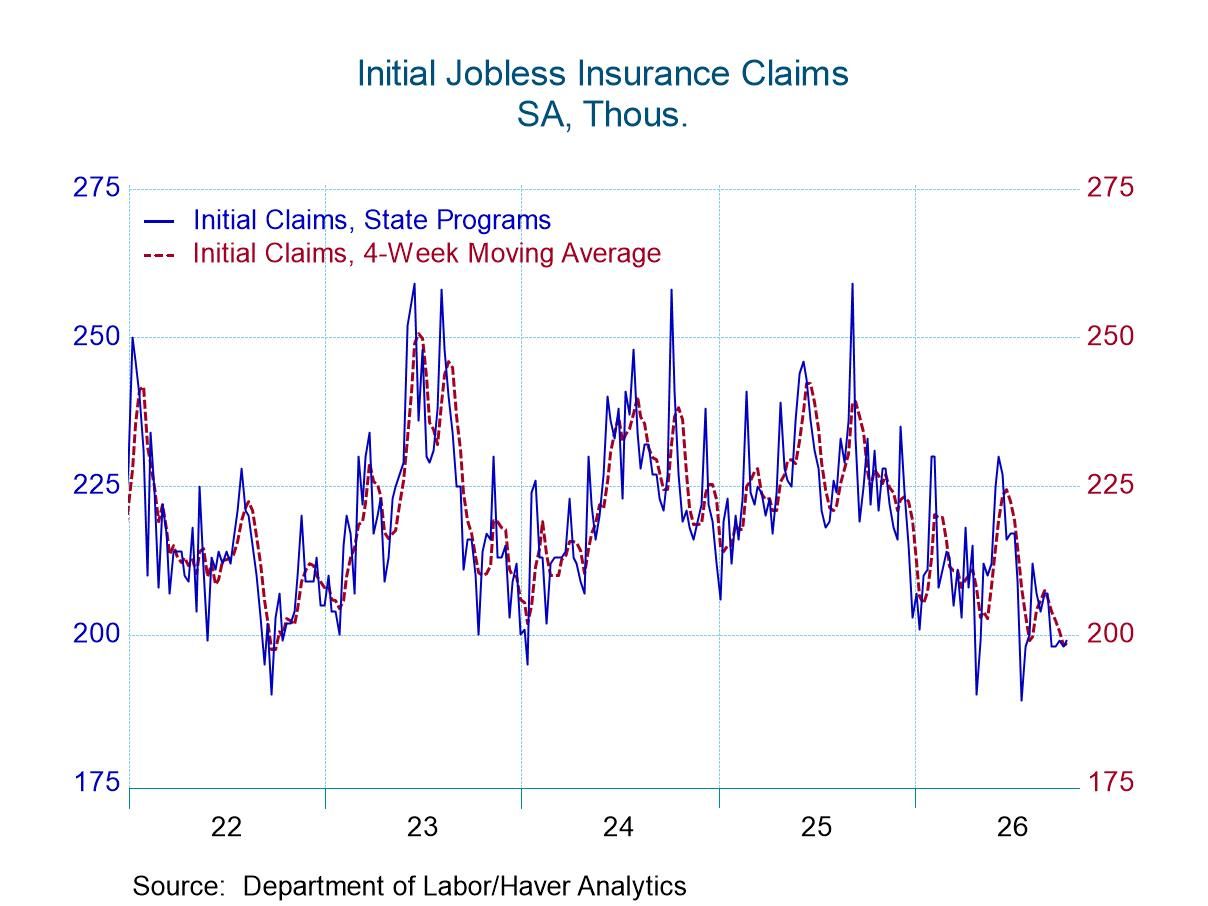
- New claims dropped by 2,000 to 197,000 in the week of October 3.
- Continuing claims rose by 17,000 to 1.716 million in the week ending September 26.
- The insured unemployment rate was unchanged at 1.1% in the week of September 26.
 Global| Oct 08 2026
Charts of the Week: The Political Premium
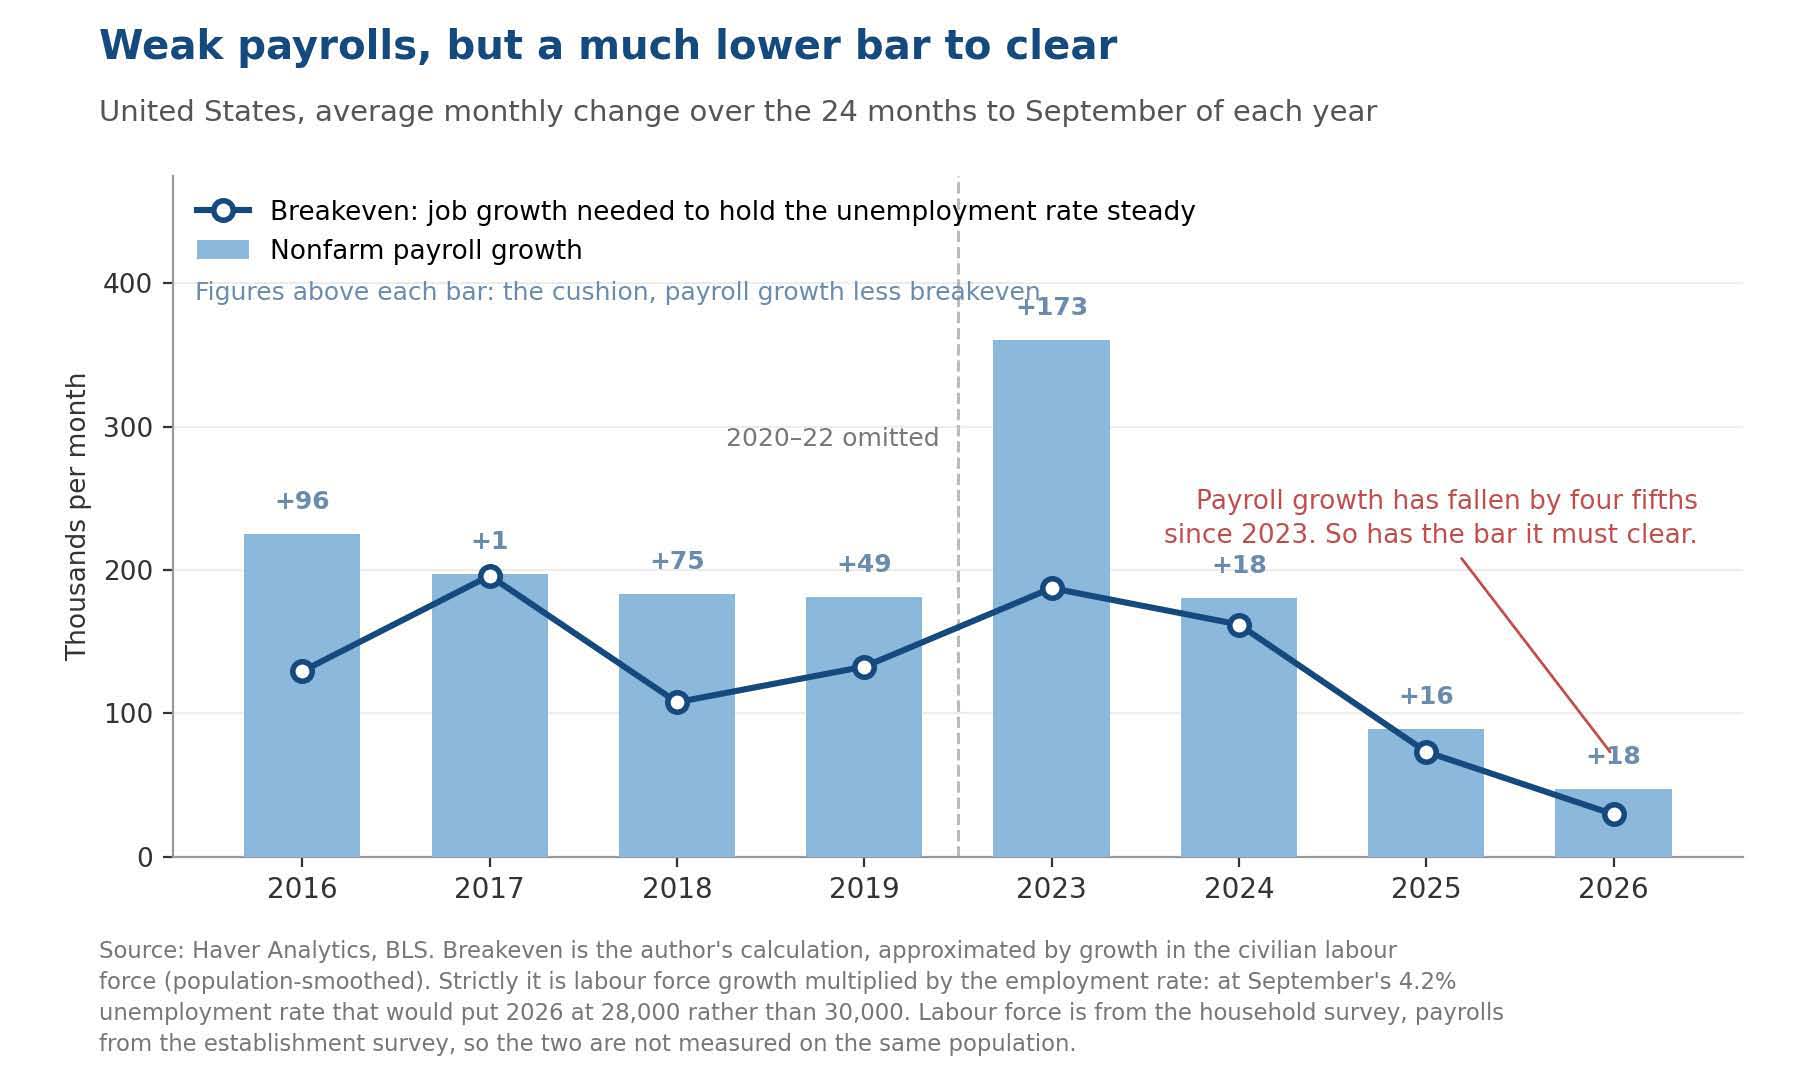
Equity markets in the United States pushed to fresh highs again this week, with implied volatility close to the lows of the year, the dollar firmer than it was a month ago and gold some way below its late-August peak. Capital is being pulled towards American investment rather than away from risk. The economic news beneath that is less comfortable. US hiring has slowed a long way, though the number of jobs needed to keep unemployment from rising has fallen with it, which leaves the American labour market cooler without being as weak as the headline numbers suggest (chart 1). Europe has offered no such ambiguity. French borrowing costs have moved above Italy's relative to Germany as a minority government struggles to assemble support for a budget, with a snap election in prospect in Spain and the German coalition under growing pressure from the right (chart 2). The deeper difficulty is that political stability across the advanced economies has eroded roughly in step with the growth of output per person since 2019, which makes the familiar division between a solid core and a fragile periphery harder to sustain (chart 3). Bond markets have repriced almost everywhere this year, but for different reasons: the American move has been almost entirely real, while in Europe a larger share reflects compensation for expected inflation (chart 4). Much of that compensation is geopolitical in origin, with oil back towards the upper end of its range, defence and energy security absorbing more public money, and trade being rearranged on strategic rather than commercial grounds (chart 5). The expansion that results is respectable but narrow, resting on one economy and, within it, on a single investment boom (chart 6).
by:Andrew Cates
|in:Economy in Brief
 USA| Oct 07 2026
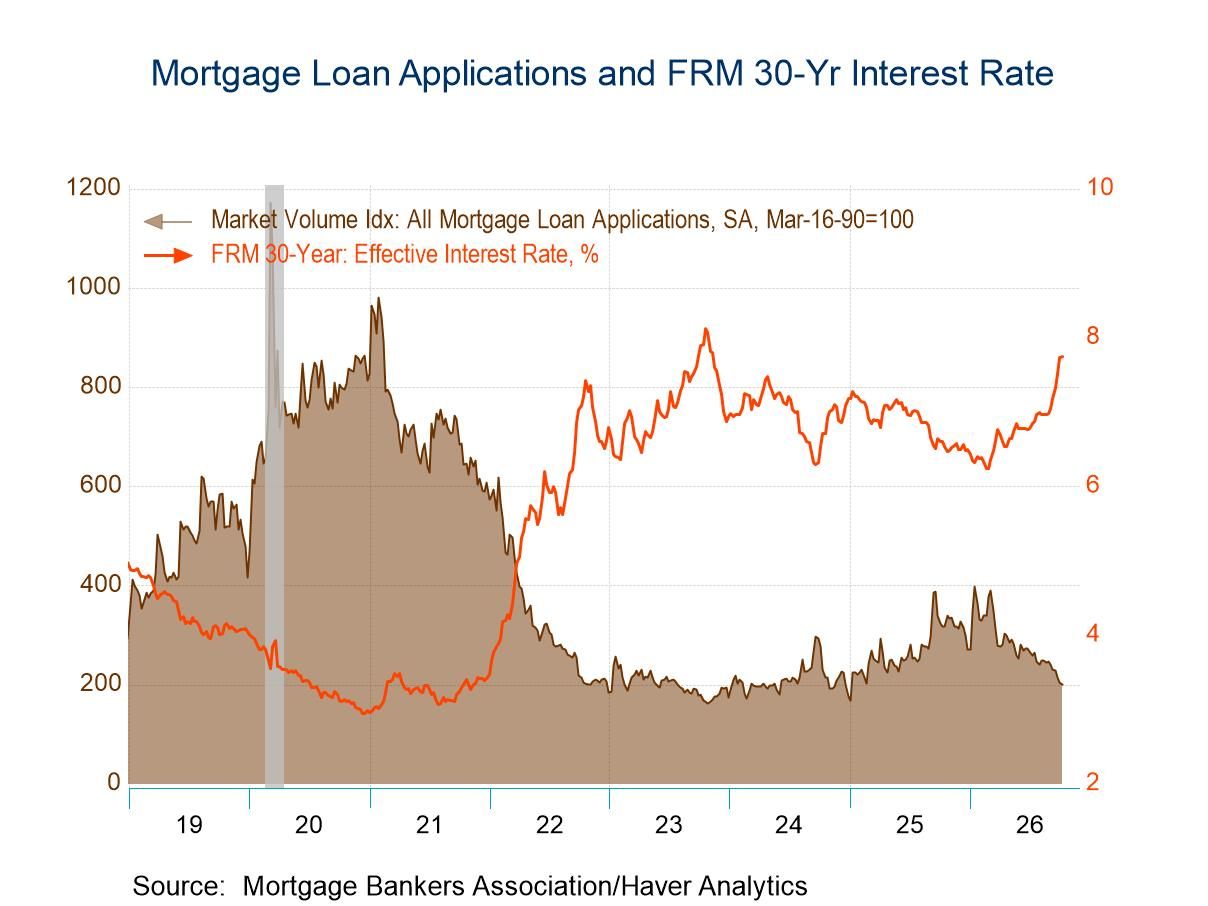
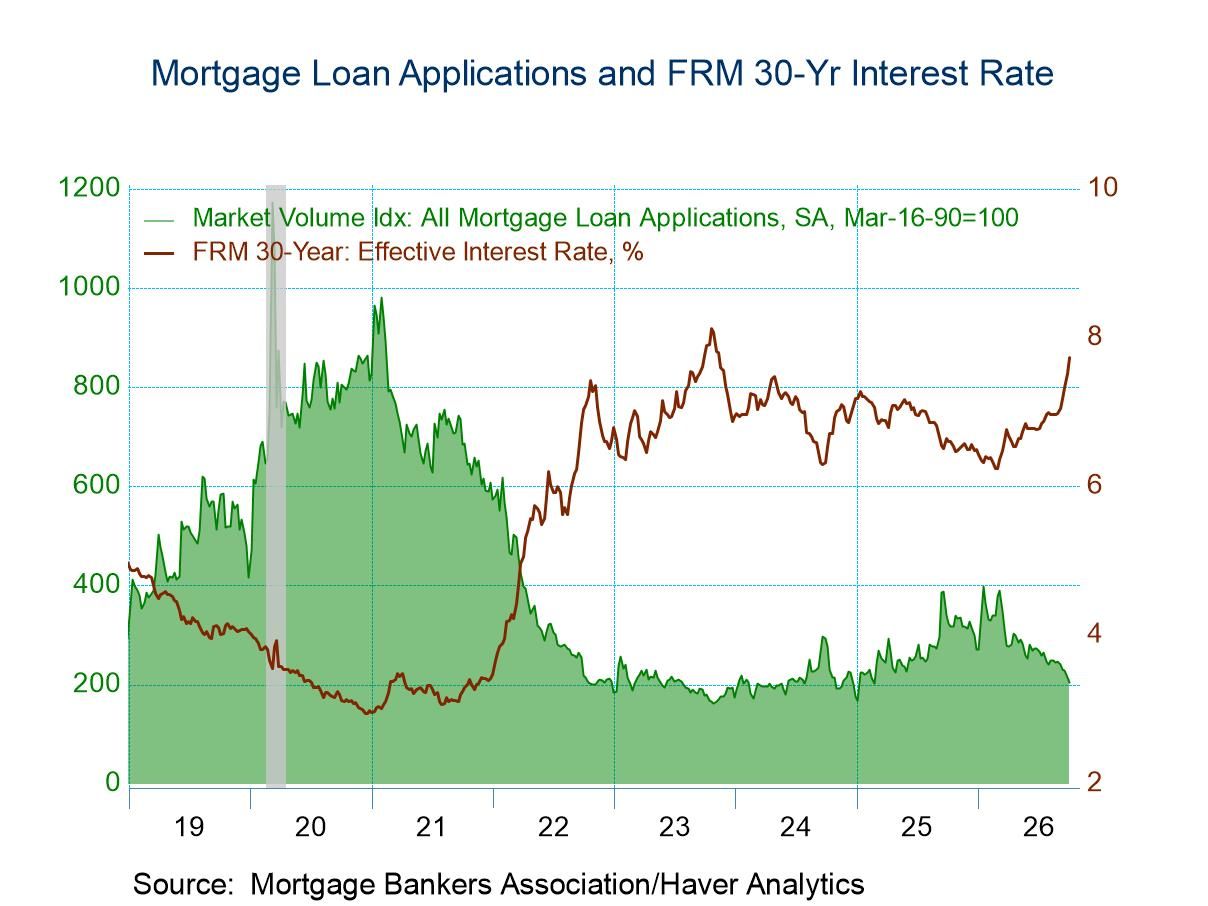
U.S. Mortgage Applications Fell in the October 2 Week
- Applications for loans to purchase and applications for loan refinancing both declined in the latest week.
- Interest rate on 30-year fixed-rate loans jumped 21bps to 7.73%.
- Average loan size fell moderately in the October 2 week.
 USA| Oct 06 2026
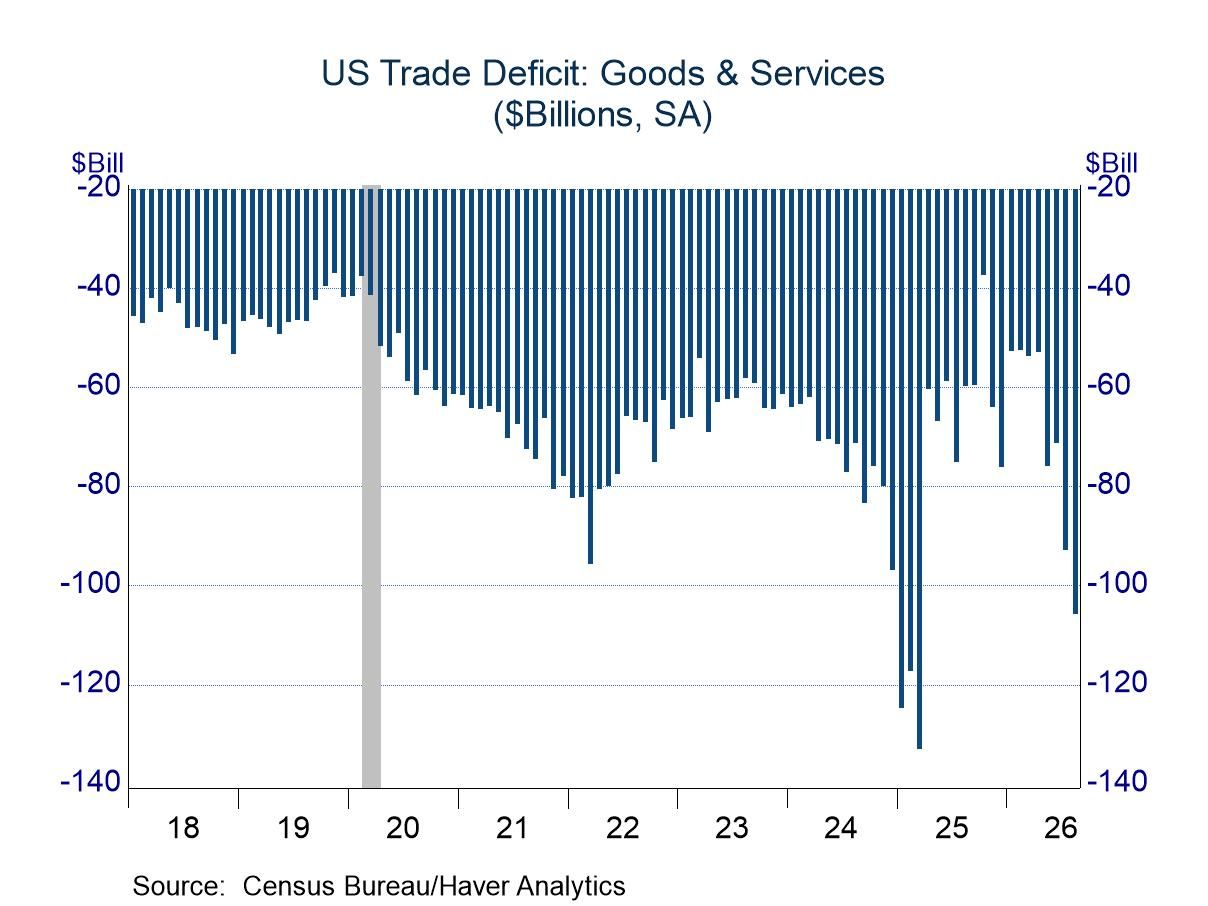
US International Trade: Deficit Surges in July and August
- The past few months have shown strong imports and soft exports
- Net exports are likely to be a substantial drag on GDP growth in Q3
 Global| Oct 06 2026
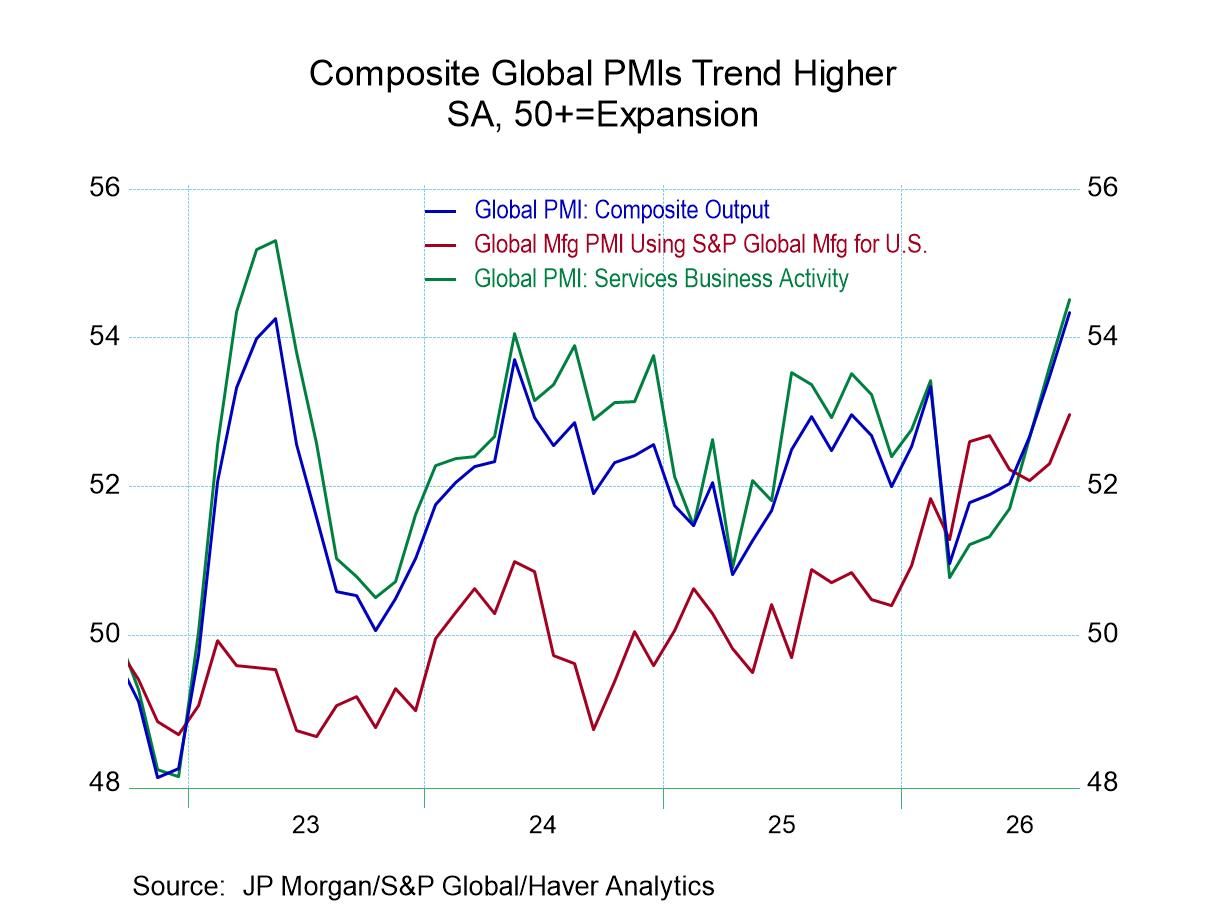
Composite Global PMIs Trend Higher
Expanding over all horizons based on median and average data Over the last 12 months and six months, the composite PMI data show mostly setbacks–weaker performance–across the various 25 countries and regions that report in this table. However, over no horizon is there more than 8 of the 25 reporters showing an outright decline in terms of PMI values (readings below 50). Over the recent three months, more significant advances have been recorded. Only 21.7% of the reporters show weakening in their average performance over three months compared to six months. This is a sharp contrast with 82.6% weakening over six months compared to 12 months, and even the 52.2% that shows weakening over 12 months compared to 12 months ago. The six-month comparison is a geopolitically difficult comparison.
Progress, yes – but will it endure? Progress is in gear. The last three months of month-to-month PMI readings yield median PMI values of 52.2 to 52.5 to 52.3 moving from July to September. September shows a slight backtracking, but all readings are above a diffusion value of 52. Averages show better growth transition from 52.1 to 52.4 to 52.8 on the same time sequence. Using averages we see a strengthening trend.
The US, UK, and EMU as an unweighted group also show progressive improvement. This group shows irregular improvement from 12 months to six months to three months, but the three-month diffusion average is higher than the 12-month average.
Among the 25 reporters surveyed, eleven have percentile standings over the last 4½ years of data that are below their respective medians; that’s a lot. So, there is still a considerable proportion of reporters with weak queue percentile standings on the standards of about the last five years–years that have not been terribly strong.
Summing up The good news in this report is the breadth of improvement in September, with only five reporters below a diffusion reading of 50, indicating contraction and with 60% of the reporters showing month-to-month improvement.
- of168Go to 1 page