Global| Oct 08 2026
Charts of the Week: The Political Premium
by:Andrew Cates
|in:Economy in Brief
Summary
Equity markets in the United States pushed to fresh highs again this week, with implied volatility close to the lows of the year, the dollar firmer than it was a month ago and gold some way below its late-August peak. Capital is being pulled towards American investment rather than away from risk. The economic news beneath that is less comfortable. US hiring has slowed a long way, though the number of jobs needed to keep unemployment from rising has fallen with it, which leaves the American labour market cooler without being as weak as the headline numbers suggest (chart 1). Europe has offered no such ambiguity. French borrowing costs have moved above Italy's relative to Germany as a minority government struggles to assemble support for a budget, with a snap election in prospect in Spain and the German coalition under growing pressure from the right (chart 2). The deeper difficulty is that political stability across the advanced economies has eroded roughly in step with the growth of output per person since 2019, which makes the familiar division between a solid core and a fragile periphery harder to sustain (chart 3). Bond markets have repriced almost everywhere this year, but for different reasons: the American move has been almost entirely real, while in Europe a larger share reflects compensation for expected inflation (chart 4). Much of that compensation is geopolitical in origin, with oil back towards the upper end of its range, defence and energy security absorbing more public money, and trade being rearranged on strategic rather than commercial grounds (chart 5). The expansion that results is respectable but narrow, resting on one economy and, within it, on a single investment boom (chart 6).
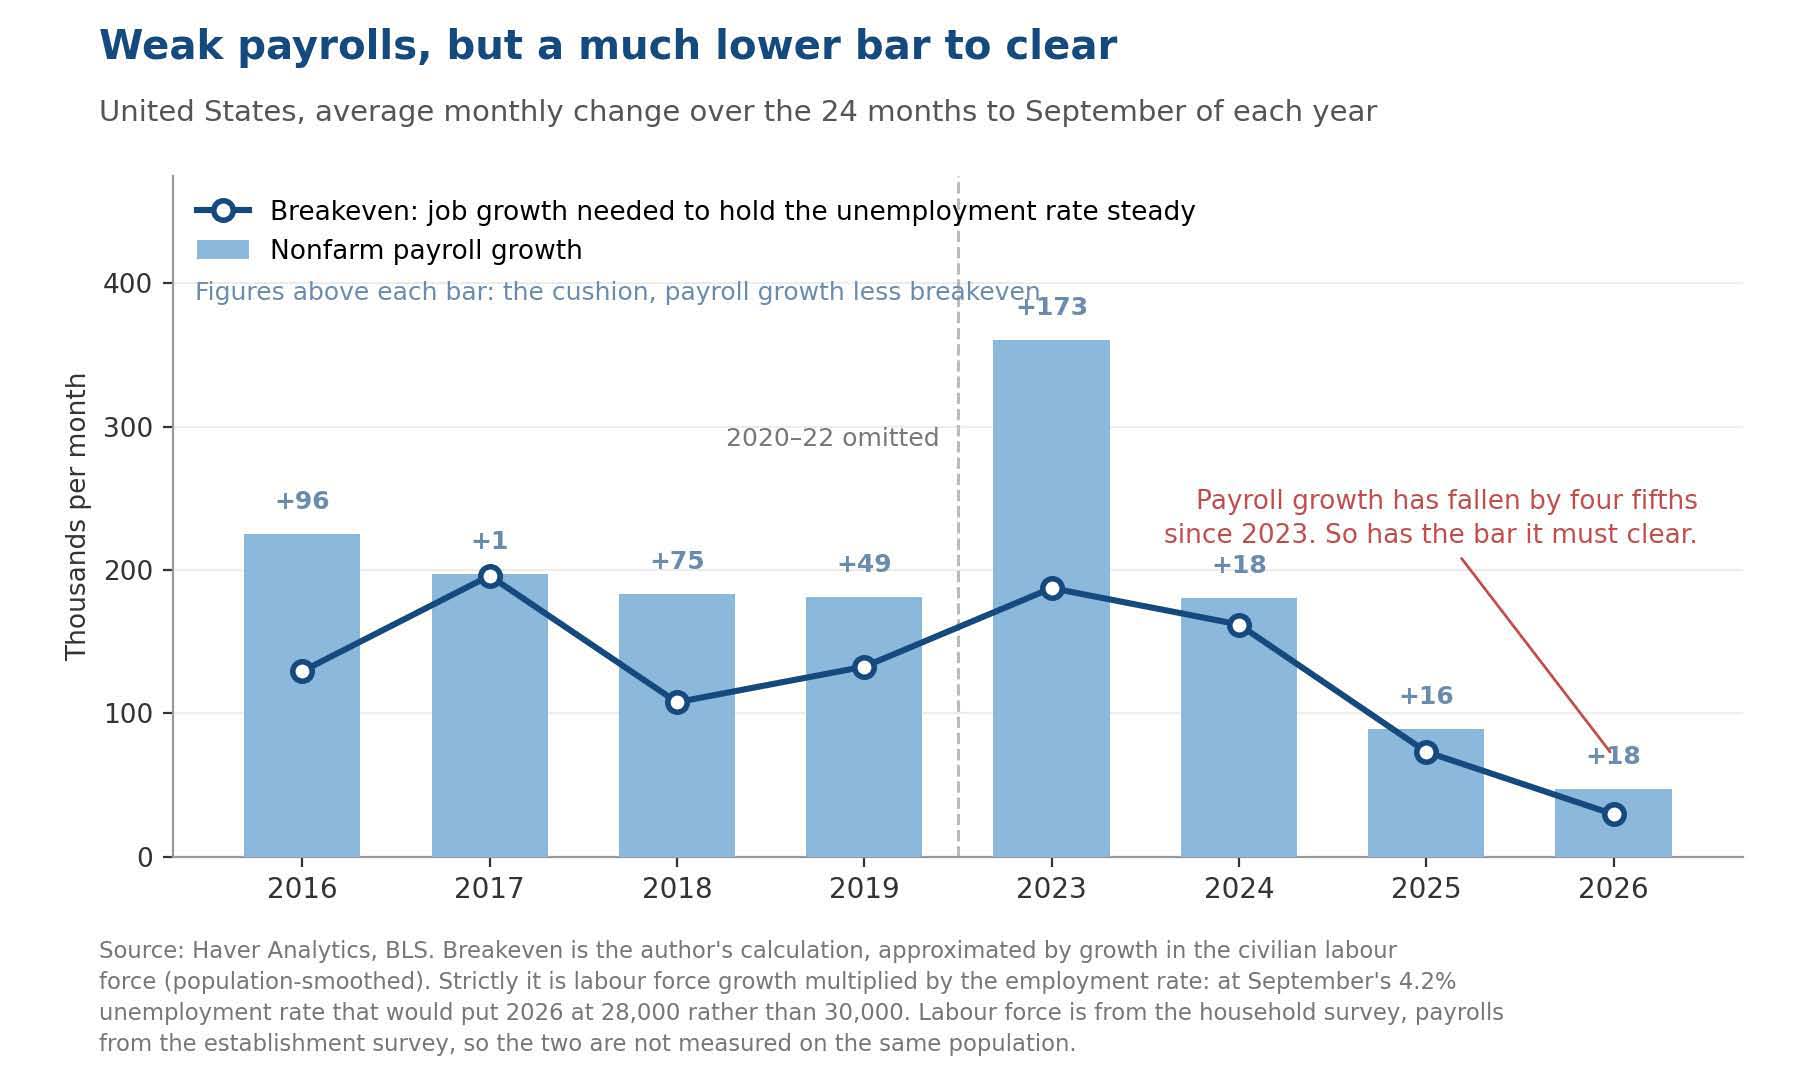
A lower bar, still cleared Job creation in the United States has slowed markedly over the past two years, to a pace that would once have been read as the approach of recession. The number of jobs required to hold unemployment steady has fallen alongside it. Tighter immigration and an ageing population have cut the growth of the labour force to a fraction of its pre-pandemic rate, so the economy now needs far fewer new jobs each month to absorb the people entering it. Hiring remains above that threshold, which is why unemployment has risen by less than the deceleration in payrolls alone would suggest. The awkwardness for policy is that weak employment numbers no longer carry the information about spare capacity that they used to, and the Federal Reserve must judge how much of the slowdown reflects faltering demand rather than a shrinking supply of workers.
Chart 1: US payroll growth and the labour force growth needed to hold unemployment steady
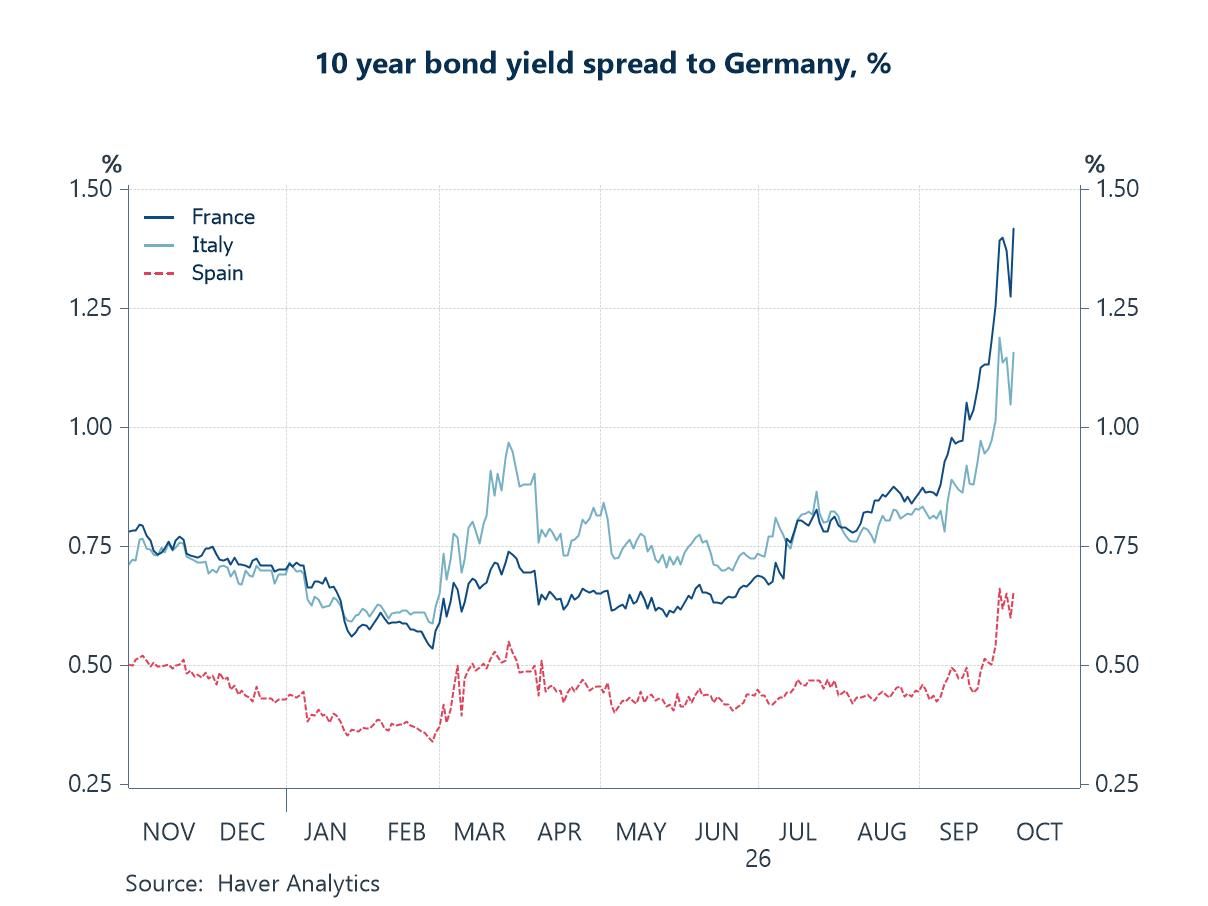
France at the front of the queue French government bonds have borne the brunt of Europe's political strain, with the premium over Germany climbing above the Italian equivalent as a minority government struggled to secure agreement on a budget intended to narrow the deficit. The difficulty is not confined to Paris. A parliamentary defeat over housing measures in Spain has prompted a snap election, and regional gains for the far right have left the German coalition under pressure. Different economic circumstances have produced a common problem: assembling durable support for expensive choices. Voters want relief from rising living costs and better services, defence and energy security require more spending, and governments must refinance debt issued when interest rates were far lower. Rising interest bills leave less room to reconcile those demands just as the cost of failing to do so increases.
Chart 2: Ten-year government bond spreads over Germany
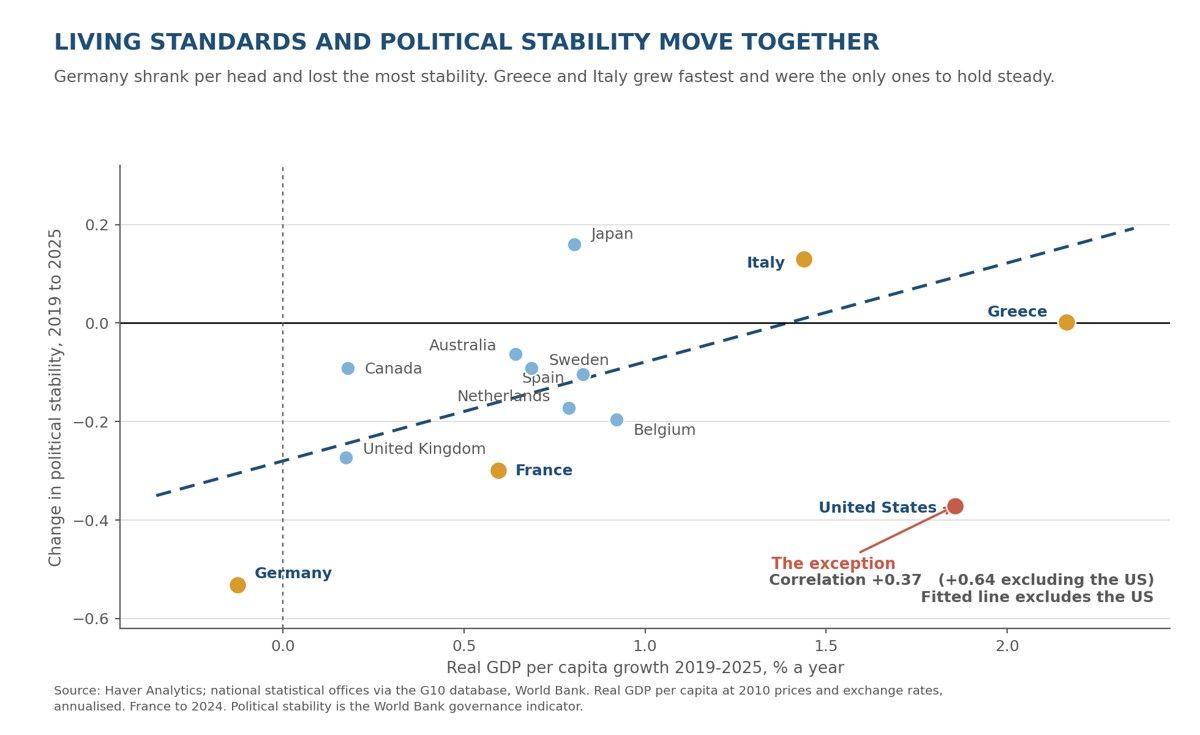
Consent follows living standards The roots of that difficulty extend well beyond the latest parliamentary arithmetic. Across the advanced economies, countries that have delivered stronger gains in output per person since 2019 have tended to preserve more of their political stability, with Germany and Greece marking the two extremes. The association does not establish causation, and the United States stands conspicuously outside it, combining rapid growth per head with a sharp deterioration in stability. Yet it is a reminder that governments find it easier to ask for restraint when households believe their prospects are improving. One reason the past five years have been so unforgiving is that the inflation surge flattered the arithmetic of public debt while many voters experienced it as a loss of purchasing power. Better ratios have not brought a stronger mandate to govern, and the familiar division between a dependable core and a vulnerable periphery has become harder to sustain.
Chart 3: Real GDP per capita growth and the change in political stability since 2019
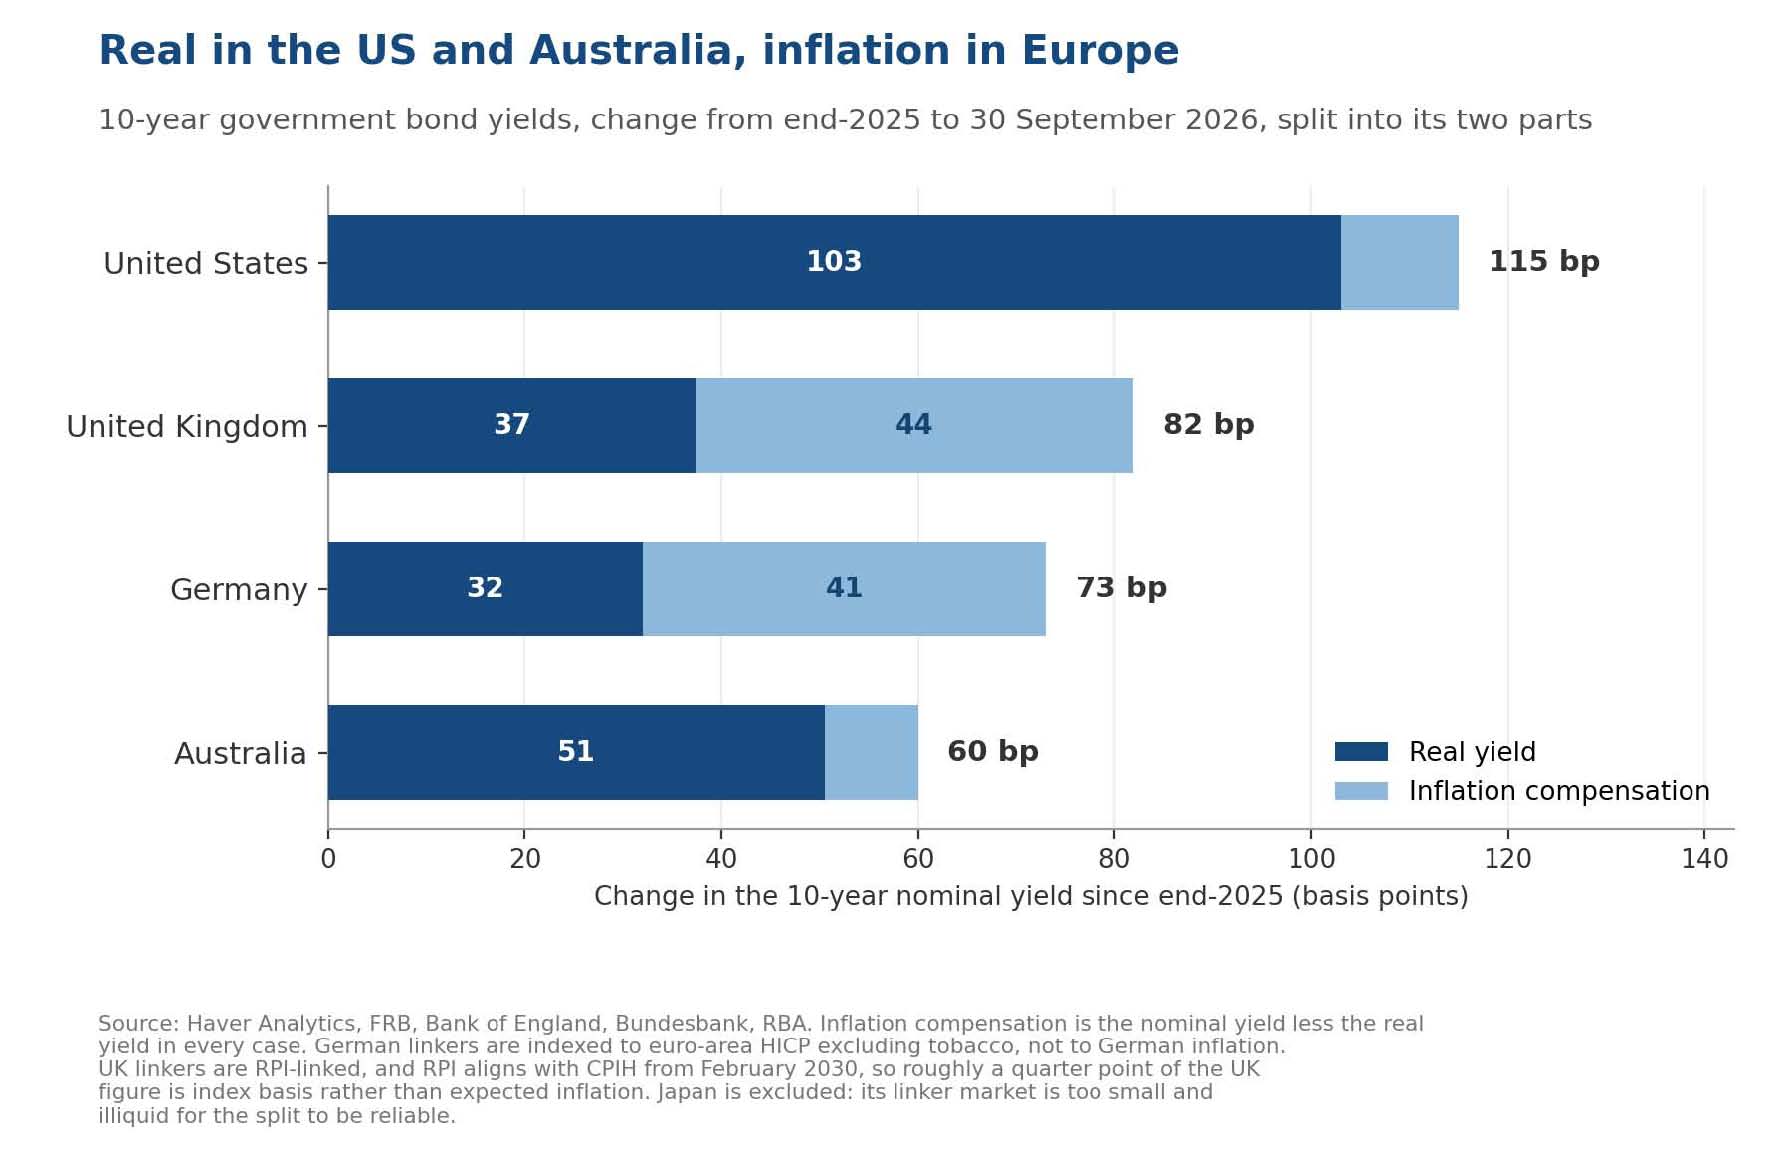
Real, not imagined Government bond yields have risen almost everywhere this year, but the composition of the move differs in ways that matter. In the United States almost all of the increase has come from real yields, which is what one would expect of an economy drawing in capital to finance investment at a pace the rest of the world cannot match. In Germany and the UK a larger share reflects compensation for expected inflation, with less of the rise attributable to the real return required to fund productive capacity. The distinction matters for the cost of adjustment. A real yield that rises because investment demand is strong is easier to live with than an inflation premium that rises because energy and wages are expected to keep pushing prices up, particularly for governments already struggling to reconcile their budgets with their politics.
Chart 4: The change in ten-year government bond yields since the end of 2025, split into real yields and inflation compensation
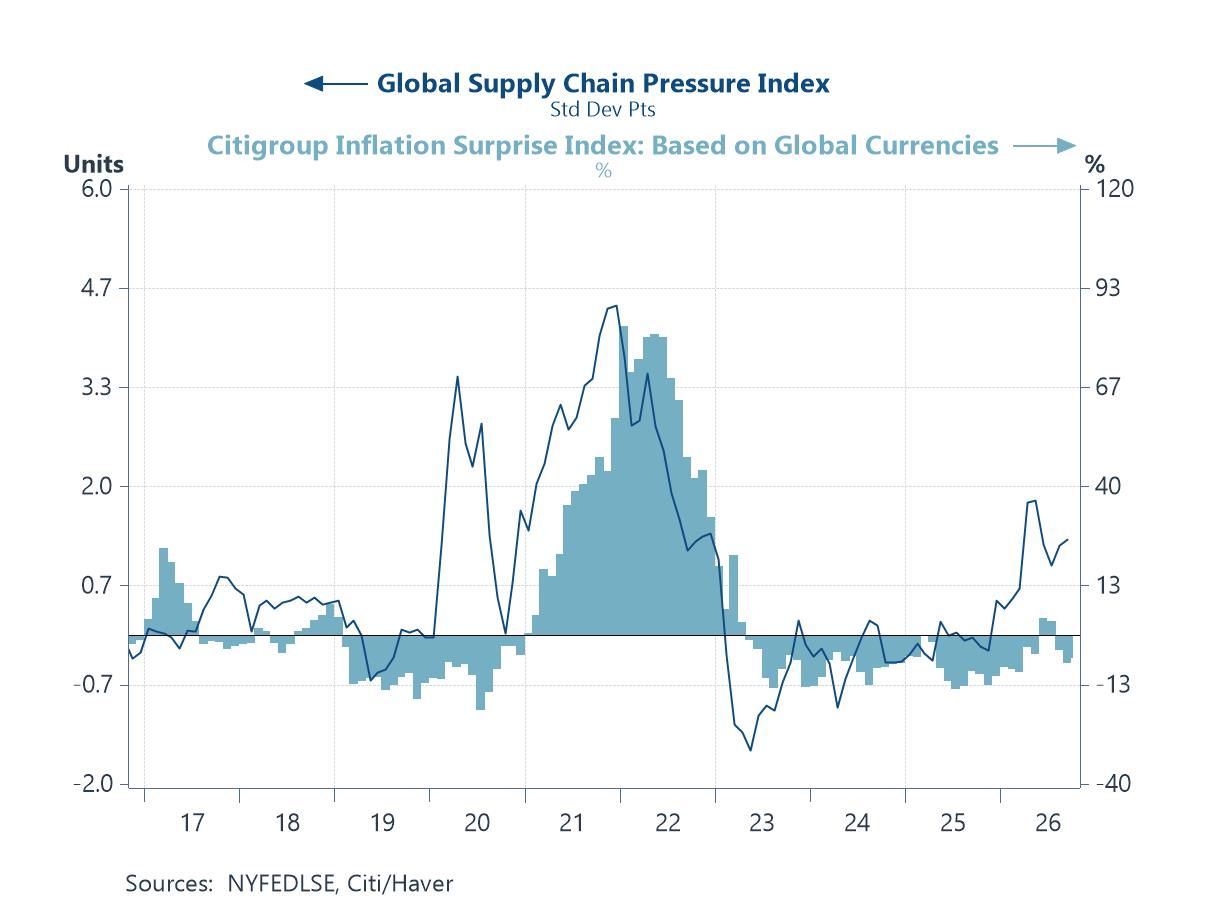
Pressure without surprise Supply chains are tightening again. The New York Fed's gauge of global supply chain pressure, which measures freight costs and delivery delays against their historical norms, has climbed back to levels last seen in 2022. Rerouted shipping, sanctions and the strategic reordering of trade are doing to logistics what they have done to the oil market, raising the cost of moving goods for reasons that have little to do with the strength of demand. What has not followed, so far, is the proclivity of inflation to surprise. Global price data have surprised forecasters barely at all in recent months, a marked contrast with 2021, when the two moved closely together. The benign reading is that firms hold better inventories and wield less pricing power than they did then, and that spare capacity in the goods-producing economies is absorbing the shock. The less comfortable one is that the pass-through is merely slow. Delivery costs took the best part of a year to reach consumer prices last time, which is a long enough lag to catch a central bank out.
Chart 5: The global supply chain pressure index and inflation surprises
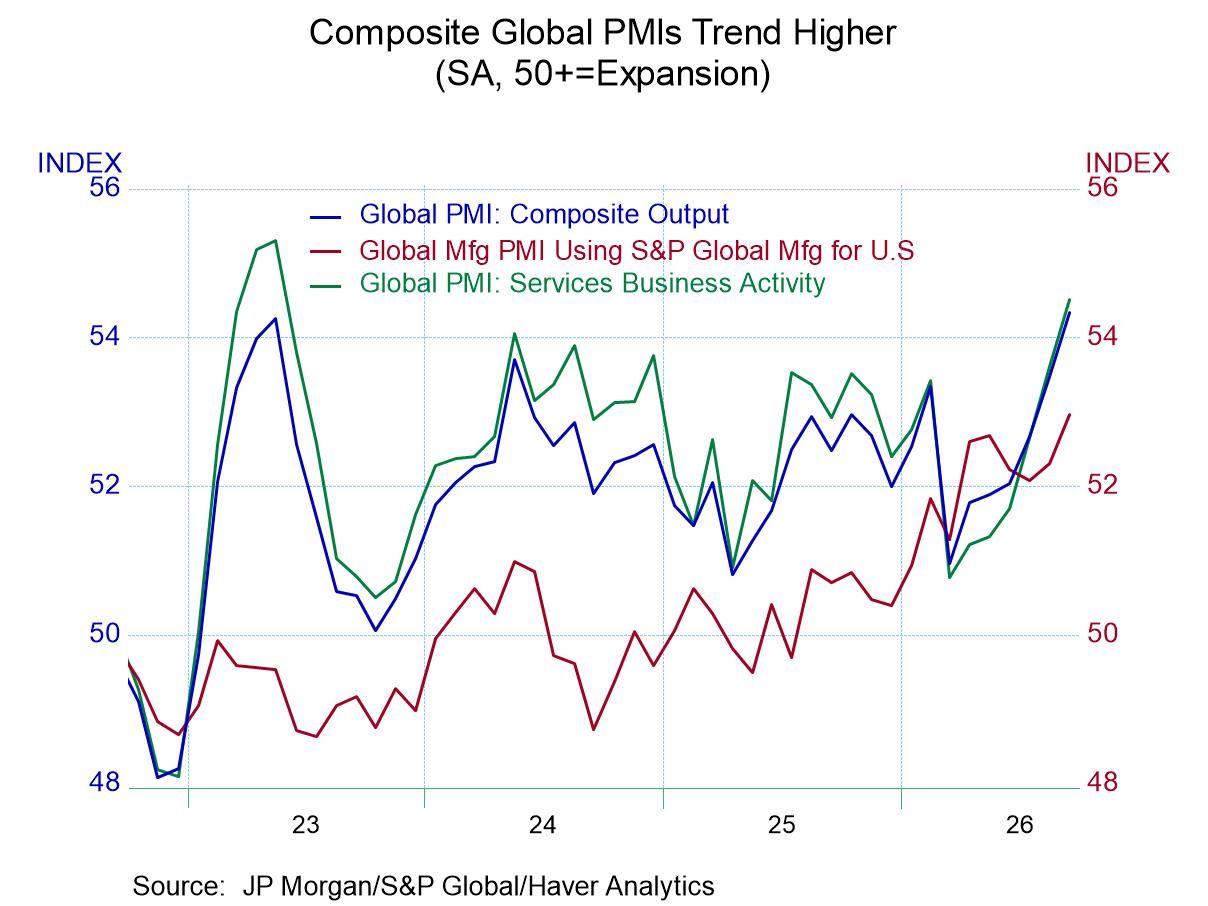
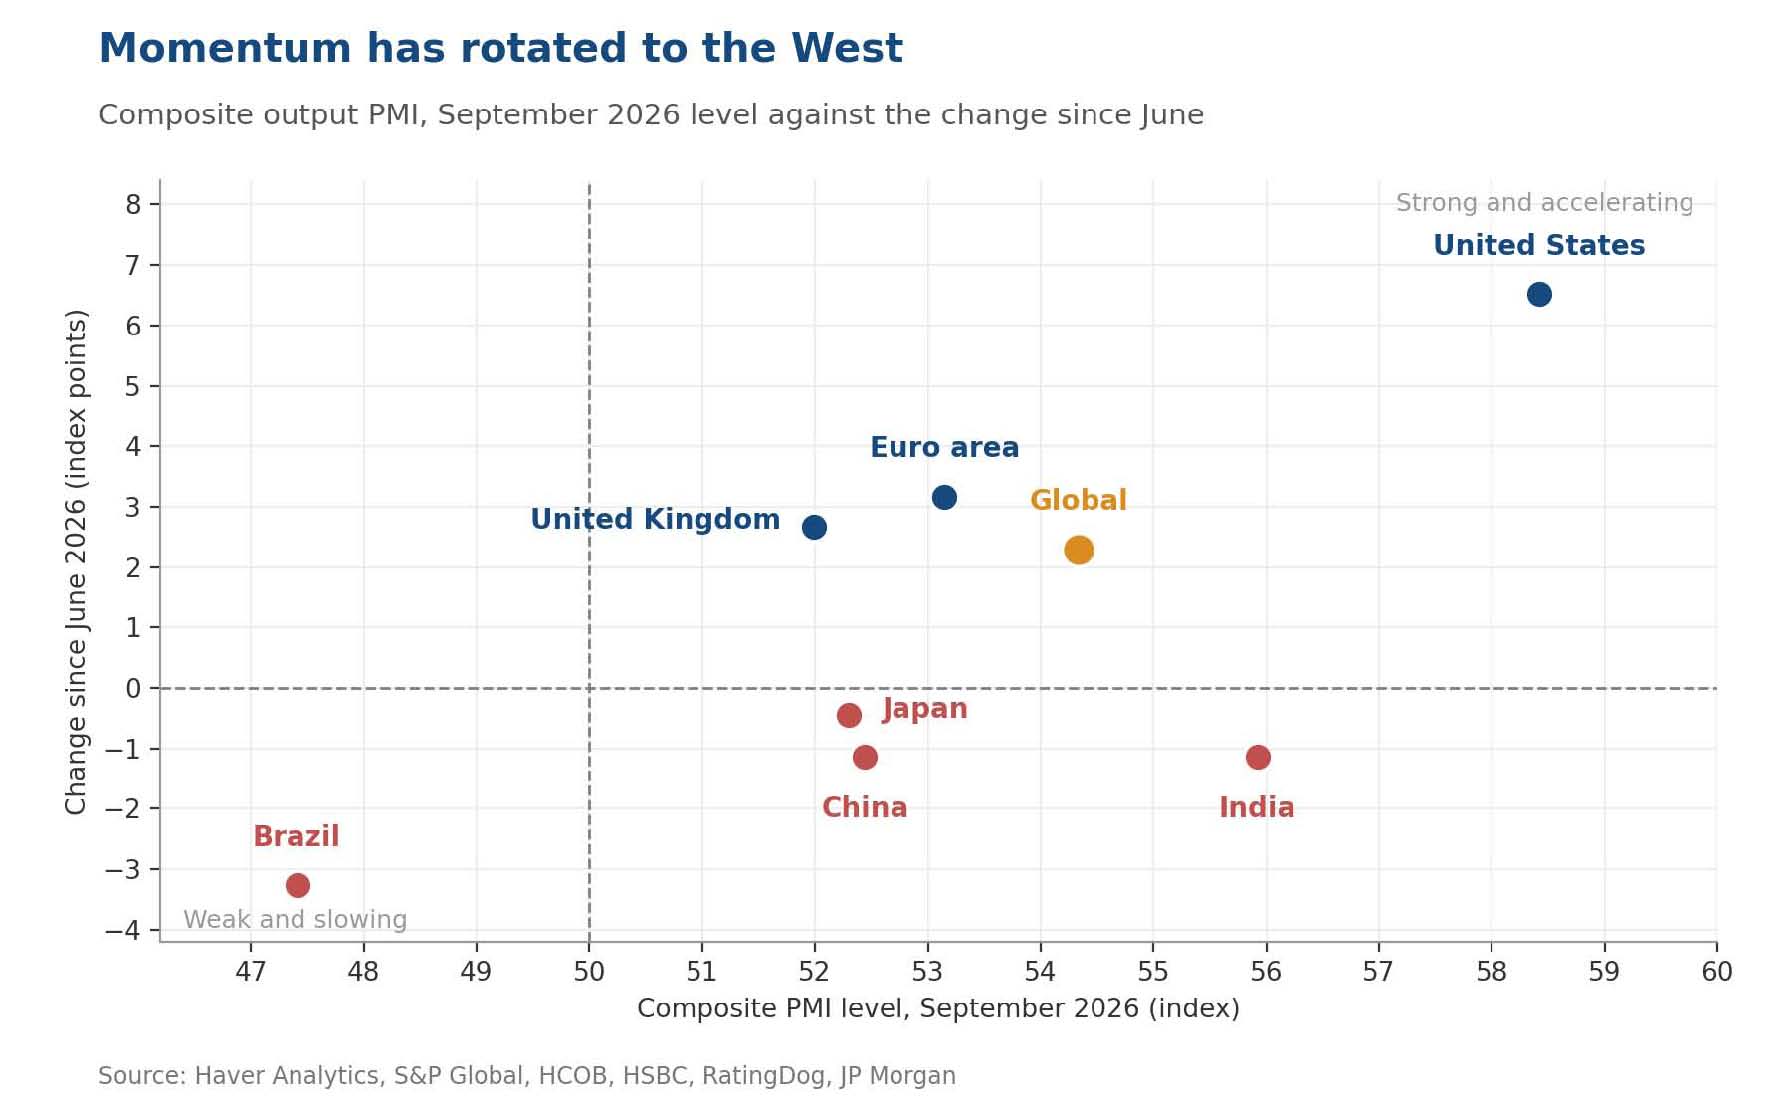
Alone in the top corner The September PMI surveys reinforced the impression of an uneven global expansion. The data suggest that activity in the United States is both the strongest and still accelerating, while the euro area and the United Kingdom have improved, but from a considerably lower base. Japan, China, India and Brazil have moved in the other direction. The global composite remains comfortably in expansion, but it is being held there in large part by a single economy, and that potentially has consequences for everyone else. A country growing faster than its own saving can finance will tend to draw in capital from the rest of the world, and it will usually do so by offering a higher real return. The rise in American real yields may therefore not be a purely domestic matter. It could help to set the terms on which governments and companies elsewhere must borrow, whatever the state of their own economies, and arguably at an awkward moment, with several of them already struggling to reconcile weak growth with heavy debts. The difficulty for much of the world may not be a shortage of demand so much as the cost of the capital needed to raise productive capacity. That cost is probably being shaped, at least in part, in a market where one borrower is currently bidding hardest.
Chart 6: Composite output PMIs, the September level and the change since June

Andrew Cates
AuthorMore in Author Profile »Andy Cates joined Haver Analytics as a Senior Economist in 2020. Andy has more than 25 years of experience forecasting the global economic outlook and in assessing the implications for policy settings and financial markets. He has held various senior positions in London in a number of Investment Banks including as Head of Developed Markets Economics at Nomura and as Chief Eurozone Economist at RBS. These followed a spell of 21 years as Senior International Economist at UBS, 5 of which were spent in Singapore. Prior to his time in financial services Andy was a UK economist at HM Treasury in London holding positions in the domestic forecasting and macroeconomic modelling units. He has a BA in Economics from the University of York and an MSc in Economics and Econometrics from the University of Southampton.
More Economy in Brief