Asia| Oct 12 2026
Economic Letter from Asia: Keeping it Real
In this week’s Letter, we look past traditional drivers of exchange rates (e.g. interest differentials) to the real, and largely domestic, forces now shaping Asia’s currency and fixed income markets. Currency performance has diverged sharply this year, with the South Korean won (KRW), Chinese yuan (CNY), and Australian dollar (AUD) gaining on a trade-weighted basis while the Philippine peso (PHP), Thai baht (THB), Indian rupee (INR), and Indonesian rupiah (IDR) have lagged (chart 1). Daily moves against the dollar sort into two clusters (chart 2). One is a tight group of CNY, AUD, New Zealand dollar (NZD), THB, Singapore follar (SGD) [AC1.1]and Malaysian ringgit (MYR), reflecting a common dollar effect and the region’s close trade ties with China. The other, looser group links PHP, IDR and KRW. Yield differentials explain only part of this dispersion (chart 3). Across 13 economies, changes in 10-year spreads over the US account for a modest share of currency returns. Stripping out outliers improves the fit considerably, perhaps suggesting spreads still matter once idiosyncratic stories are set aside. In fixed income markets, economy-specific drivers have dominated. Indonesia, Australia, New Zealand and, most recently, India have tightened, yet real policy rates remain slightly negative in half the region (chart 4), leaving policy accommodative in real terms. Real bond yields have also climbed in Japan, Korea and Australia (chart 5), pointing beyond inflation expectations to heavier fiscal spending, the AI-driven export boom and tighter policy. Looking ahead, a strengthening El Niño, disrupted traffic through the Strait of Hormuz, the AI buildout and the risk of renewed US-China friction (chart 6) will shape the region’s fiscal and monetary planning. That, in turn, will steer the path of yields and currencies in the period ahead.
Asia currencies Trade-weighted currency performance across Asia has been strikingly uneven this year (chart 1). KRW and CNY have each significantly against their trading partners[AC2.1], with AUD not far behind. At the other end, PHP, THB, INR and IDR have each lost much ground on the same basis. Between these extremes, SGD, MYR, JPY and TWD have moved by about 2% or less in either direction. Some of this relative performance reflects correlated trades, whether with commodity prices or with other currencies. Yet a range of other drivers has also been at work, including economy-specific domestic considerations such as inflation, policy settings and external balances. Against the US dollar alone, the spread is wider still, from a gain of about 7% for KRW to a loss of a similar size for INR (chart 3). The sections that follow take these drivers in turn, starting with how the region’s currencies move together.
Chart 1: 2026 Cumulative year-to-date FX returns
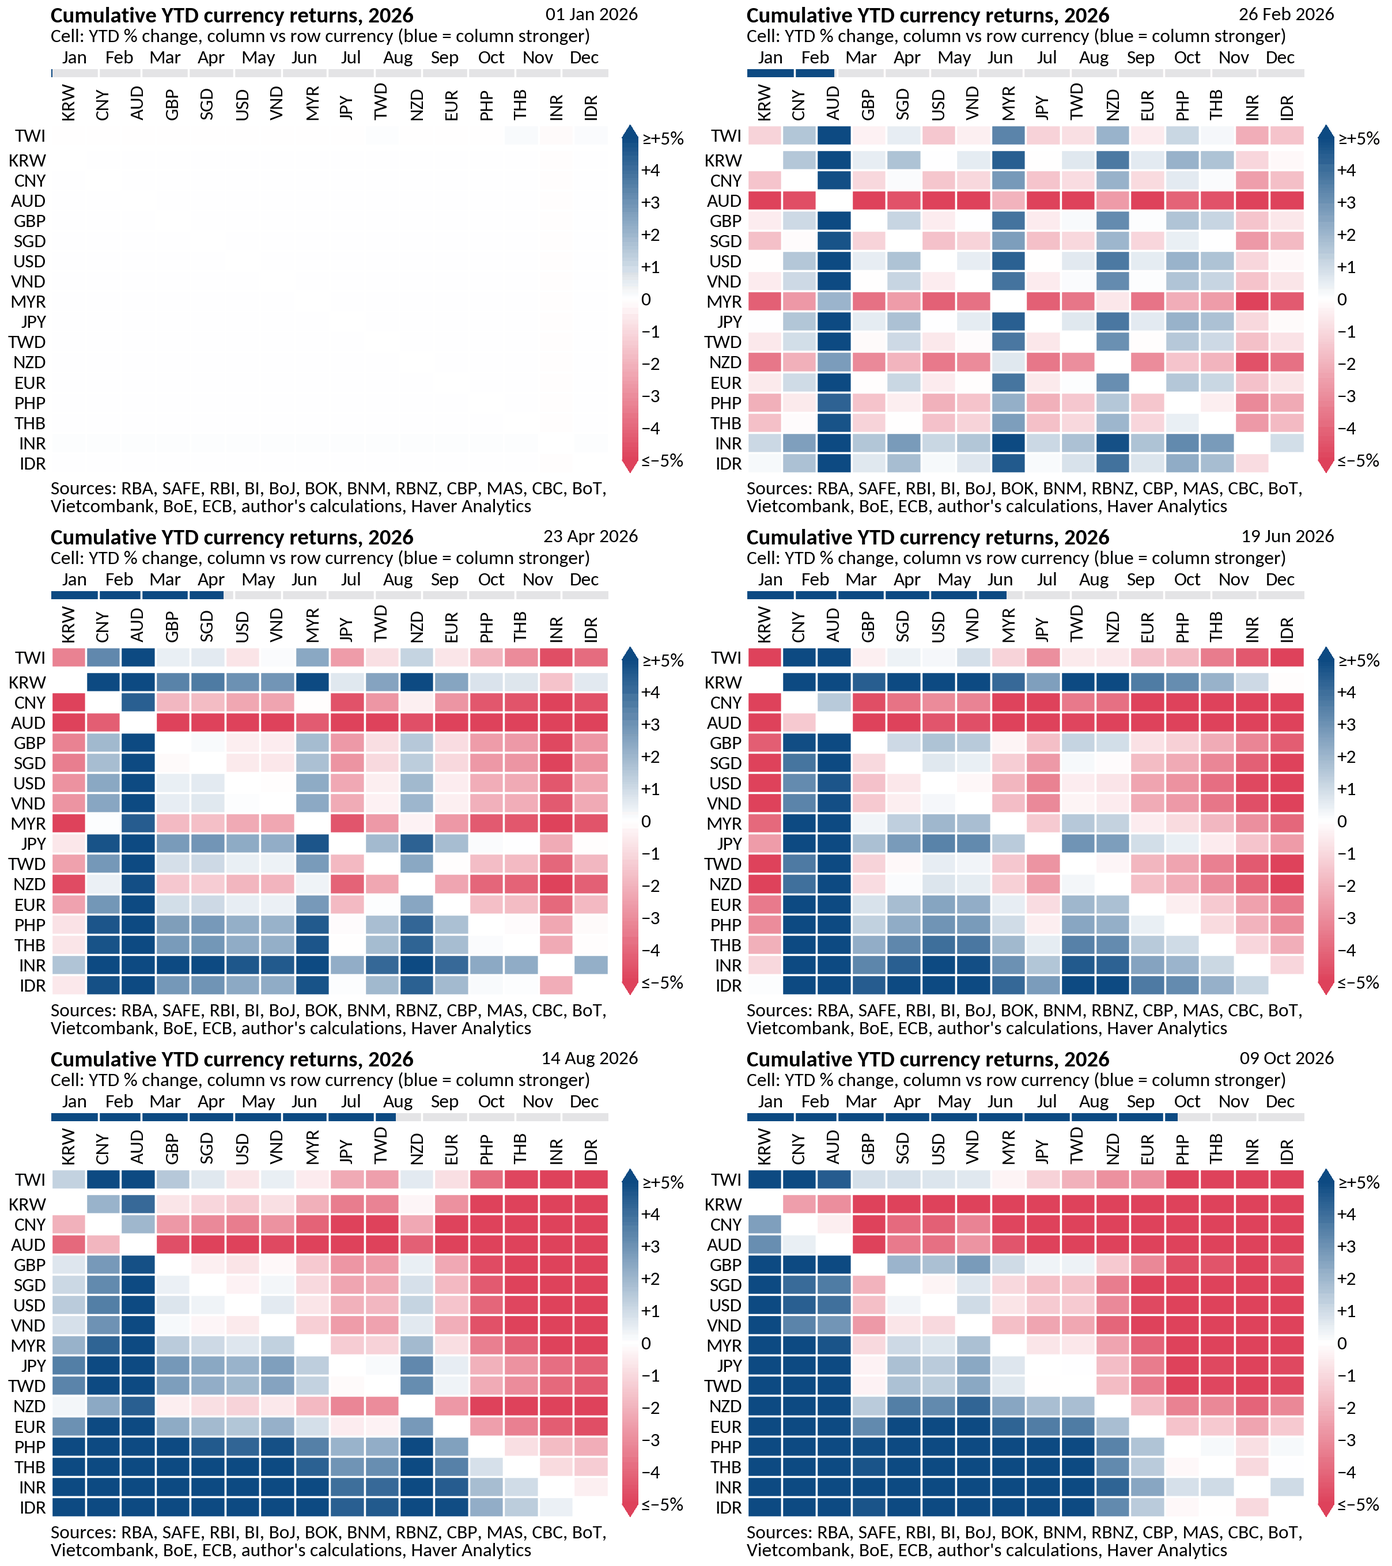
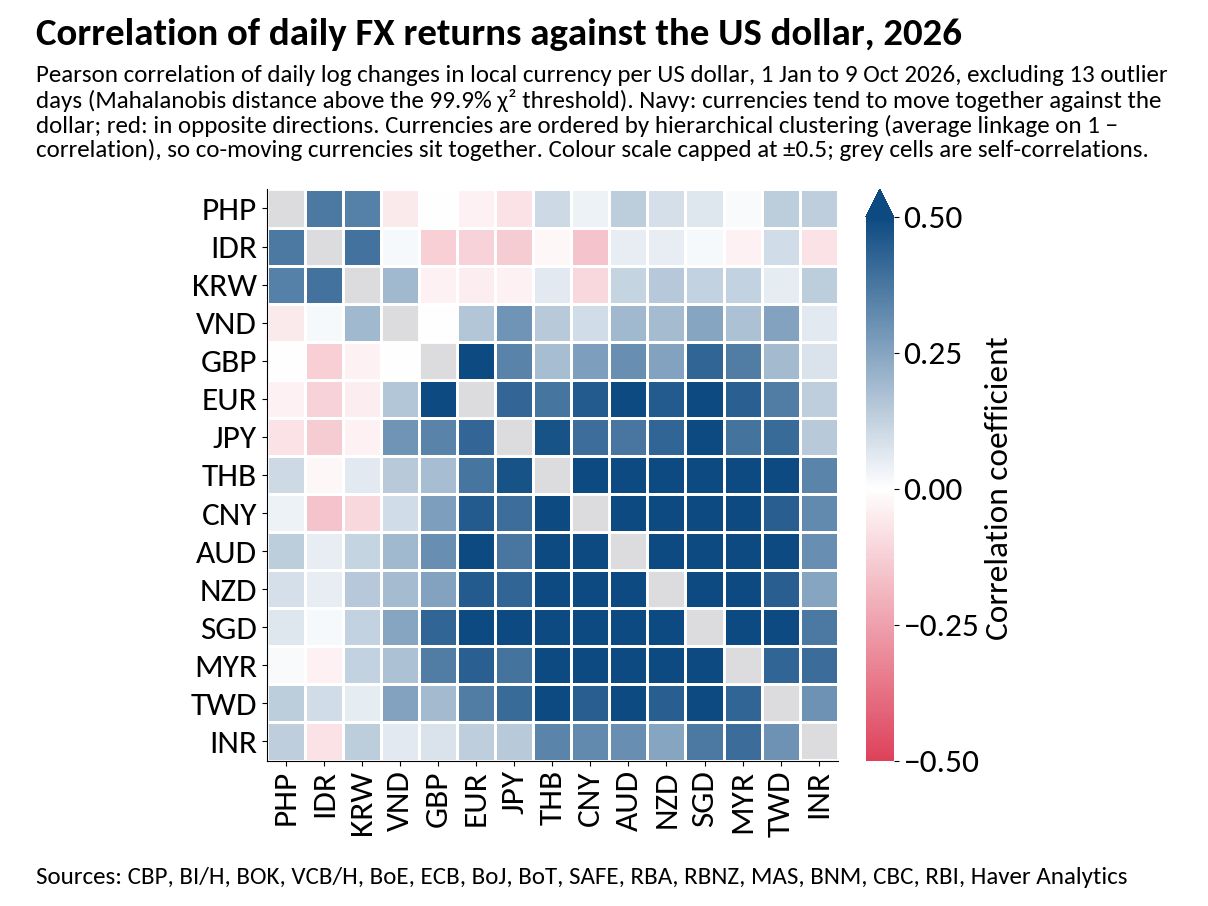
We start with the cross-currency correlations across Asian and major economies, measured on daily returns against the US dollar this year. Two main clusters emerge (chart 2). The first, and tighter, groups CNY, AUD, NZD, THB, SGD and MYR, with TWD attached to a somewhat lesser extent. The second, weaker cluster links PHP, IDR and KRW. The first cluster reflects a confluence of drivers. One is a common US dollar effect, since every pair is quoted against the dollar and so shares its swings. Another is the pull of CNY on the other currencies in the group, which likely reflects the region’s traditionally close trade ties with China. Stripping away these effects, some of the strongest remaining links are between AUD and NZD, and between SGD and MYR. In Singapore’s case the link is partly mechanical, since SGD is managed against a trade-weighted basket of its main trading partners’ currencies, which includes Malaysia’s.
Chart 2: Correlation of daily FX returns vs. the US dollar
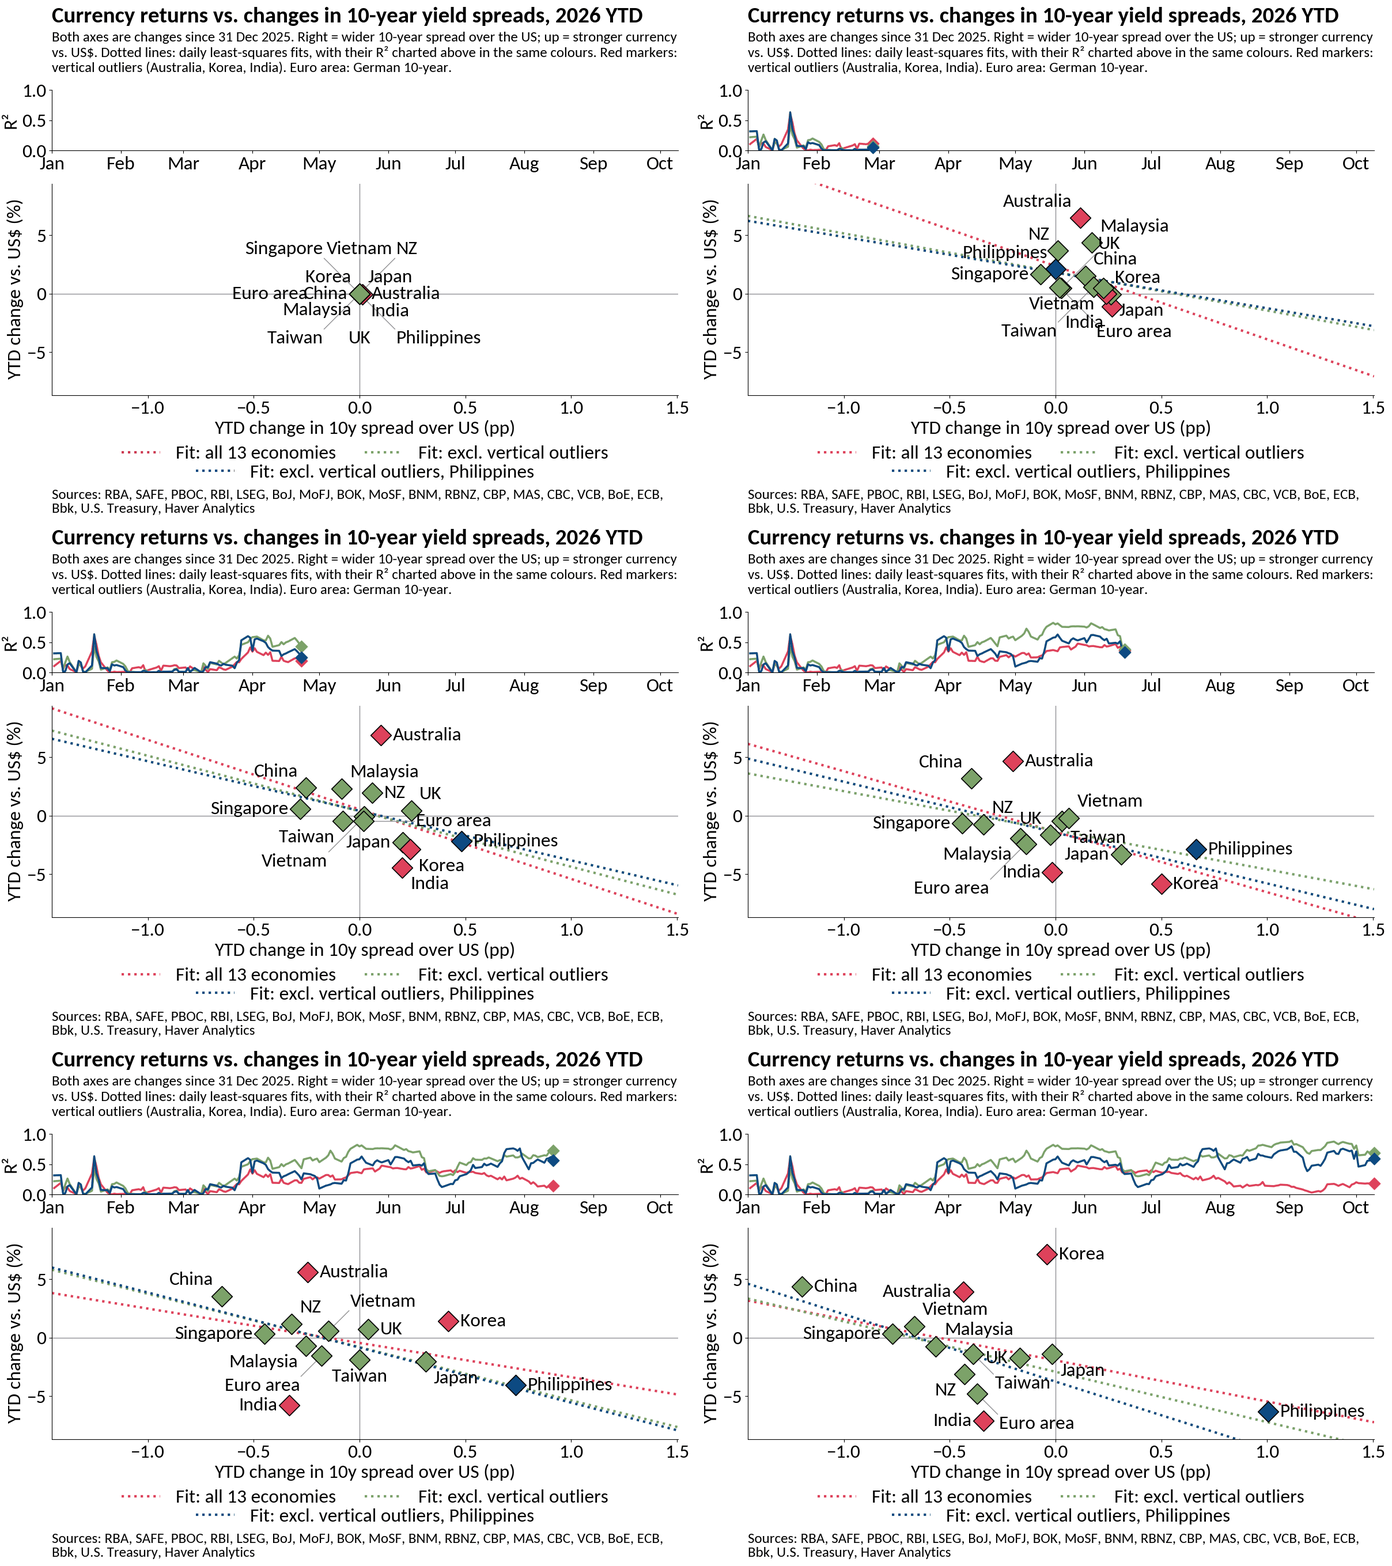
Yield differentials are a common gauge of currency performance but explain only part of the picture (chart 3). Regressing year-to-date currency returns against the US dollar on changes in 10-year spreads over the US gives an R² of about 0.2 across 13 economies. Carry logic would place economies in the top-right and bottom-left quadrants, with currencies strengthening as spreads widen and weakening as they narrow. Excluding borderline cases, only New Zealand, the euro area and India sit clearly within them, all in the bottom-left. Yet the fitted line slopes downward: economies whose spreads narrowed most have seen stronger currencies. Australia, Korea and India are vertical outliers, sitting far above or below the fitted line, so their currency moves owe little to their spreads. The Philippines is a leverage point: its extreme horizontal position gives it outsized pull on the fitted line itself. Its spread has widened about 1pp while the peso has fallen about 6%. Outside these cases, the R² rises to about 0.6 to 0.7. Even so, the inverted slope suggests something other than carry is at work.
Chart 3: FX returns and changes in 10-year yield spreads
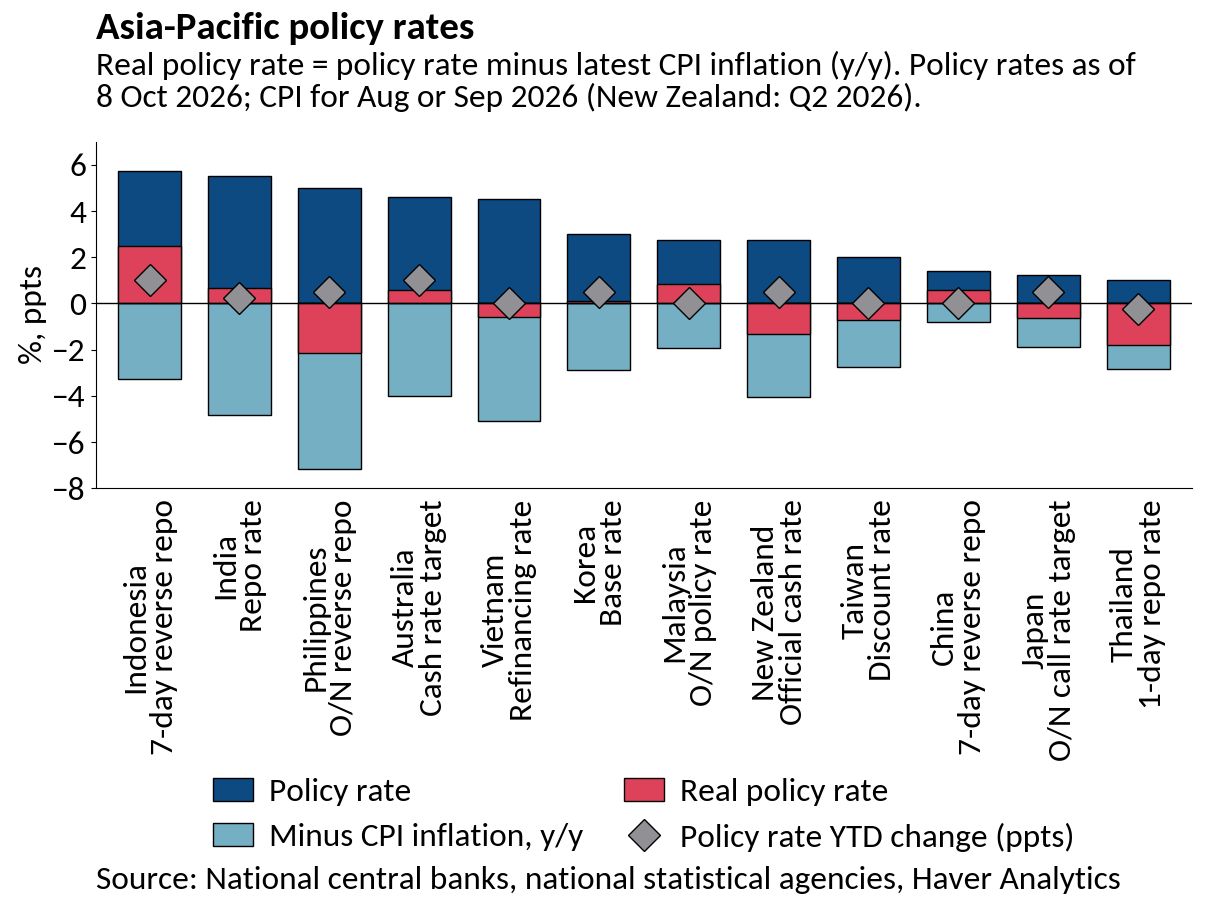
Asia rates Asia’s rates environment this year has been shaped by economy-specific drivers alongside broad external developments, and several central banks have tightened (chart 4). The RBA has hiked four times to 4.60%, most recently in September, citing sticky core inflation and capacity pressures. Bank Indonesia raised its policy rate by a cumulative 100bp in May and June to 5.75%, to stabilise the rupiah amid volatility from the Middle East conflict. The RBNZ has added 50bp since July, with headline inflation reaching 4.1% y/y in Q2, largely on fuel prices. Most recently, the RBI raised its repo rate to 5.50% on 7 October, its first hike since February 2023. Even so, real policy rates remain slightly negative in half the economies charted, including the Philippines, Thailand and New Zealand, leaving policy there accommodative in real terms. Where real rates are positive, as in Indonesia at about 2.5%, central banks hold more buffer against further inflation shocks.
Chart 4: Asia-Pacific policy rates
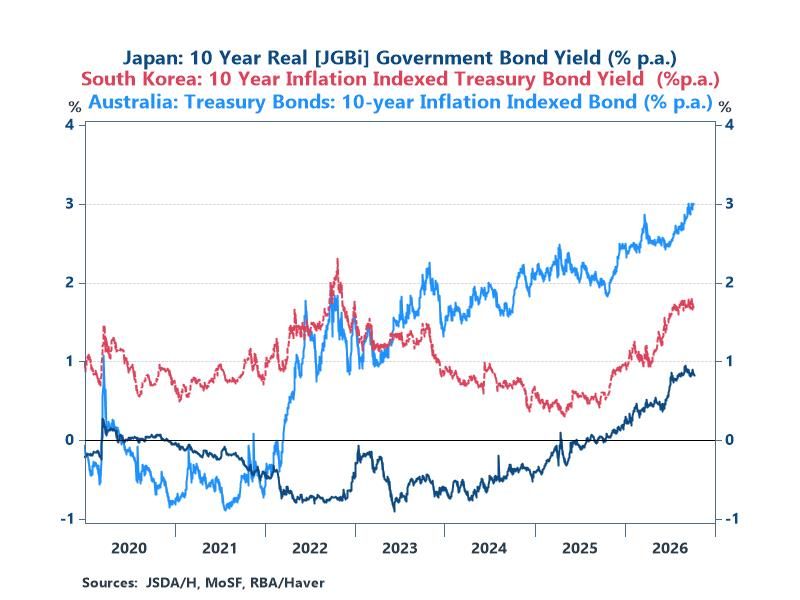
Part of the recent surge in nominal yields reflects inflation expectations, given lingering price risks from the US-Iran conflict and, more recently, building food price risks from El Niño. Yet real yields have climbed too (chart 5), suggesting more than an inflation story. Japan’s 10-year real yield has risen to just under 1%, from around minus 0.5% in 2024. That rise has coincided with market concern over heavier fiscal spending, including a supplementary budget for energy subsidies financed by deficit bonds. Korea’s real yield has climbed to about 1.7%, from roughly 0.4% in mid-2025, as the AI-driven chip export boom has lifted growth and rate hike expectations. Australia’s has reached about 3%, its highest over the period shown, alongside four RBA hikes and persistent capacity pressures. In each case, higher real yields point to expectations of tighter policy and stronger demand for capital, whether from governments or from investment.
Chart 5: Asia-Pacific real government bond yields
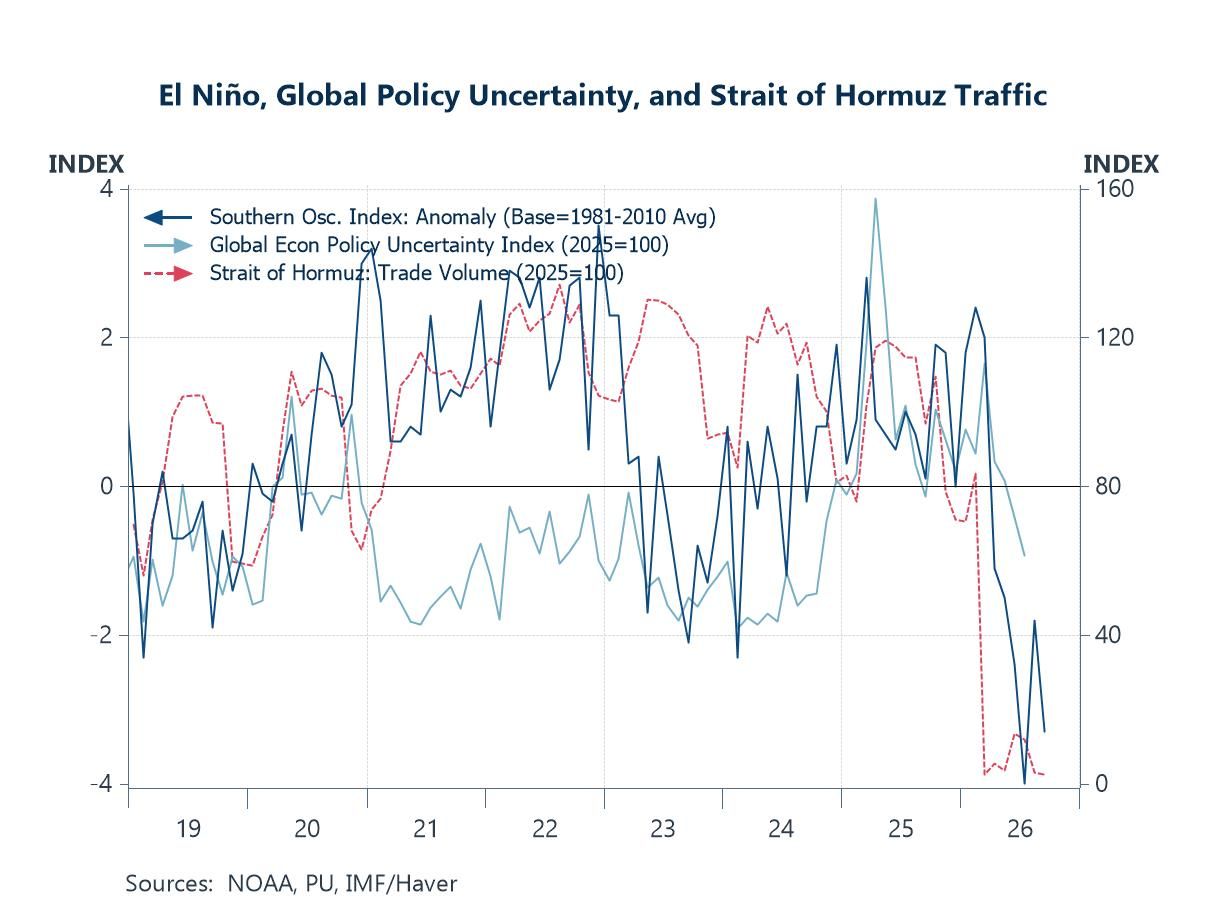
The road ahead The road ahead remains uncertain, with several forces still in play (chart 6). The Southern Oscillation Index has fallen deep into negative territory, consistent with a strengthening El Niño that threatens harvests across South and Southeast Asia. Trade volumes through the Strait of Hormuz collapsed after the conflict began in late February and remain a fraction of their 2025 level in the latest data. The AI capex and buildout phase is a third force, with its effects on growth, trade and bond markets still unfolding. US-China relations have also returned to the spotlight, following the recent summit. Global economic policy uncertainty, by contrast, has eased from its April 2025 peak. How these forces play out will shape domestic fiscal and monetary planning in the period ahead, and by extension the path of yields and currencies across the region.
Chart 6: Southern Oscillation Index, global policy uncertainty, and Strait of Hormuz traffic

Tian Yong Woon
AuthorMore in Author Profile »Tian Yong joined Haver Analytics as an Economist in 2023. Previously, Tian Yong worked as an Economist with Deutsche Bank, covering Emerging Asian economies while also writing on thematic issues within the broader Asia region. Prior to his work with Deutsche Bank, he worked as an Economic Analyst with the International Monetary Fund, where he contributed to Article IV consultations with Singapore and Malaysia, and to the regular surveillance of financial stability issues in the Asia Pacific region.
Tian Yong holds a Master of Science in Quantitative Finance from the Singapore Management University, a Master of Science in Analytics from the Georgia Institute of Technology, a Bachelor of Science in Mathematics from the Singapore University of Social Sciences, and a Bachelor of Science in Banking and Finance from the University of London.
More Economy in Brief