U.S. Existing Home Sales Rebound in September
Summary
- September sales +1.5% m/m to 3.99 mil., first m/m rise since May; -2.2% y/y, second straight y/y drop.
- Sales m/m up in the South (+2.8%) and West (+2.8%); down in the Northeast (-2.1%); flat in the Midwest.
- Sales y/y down in all four regions, w/ the steepest decline in the West (-5.2%).
- Median sales price -2.4% (+1.3% y/y) to $417,500, lowest since April.
- Unsold inventory +1.9% (+4.6% y/y) to 1.60 mil. units, highest level since Nov. ’19; 4.8 months' supply, highest since Nov. ’15.
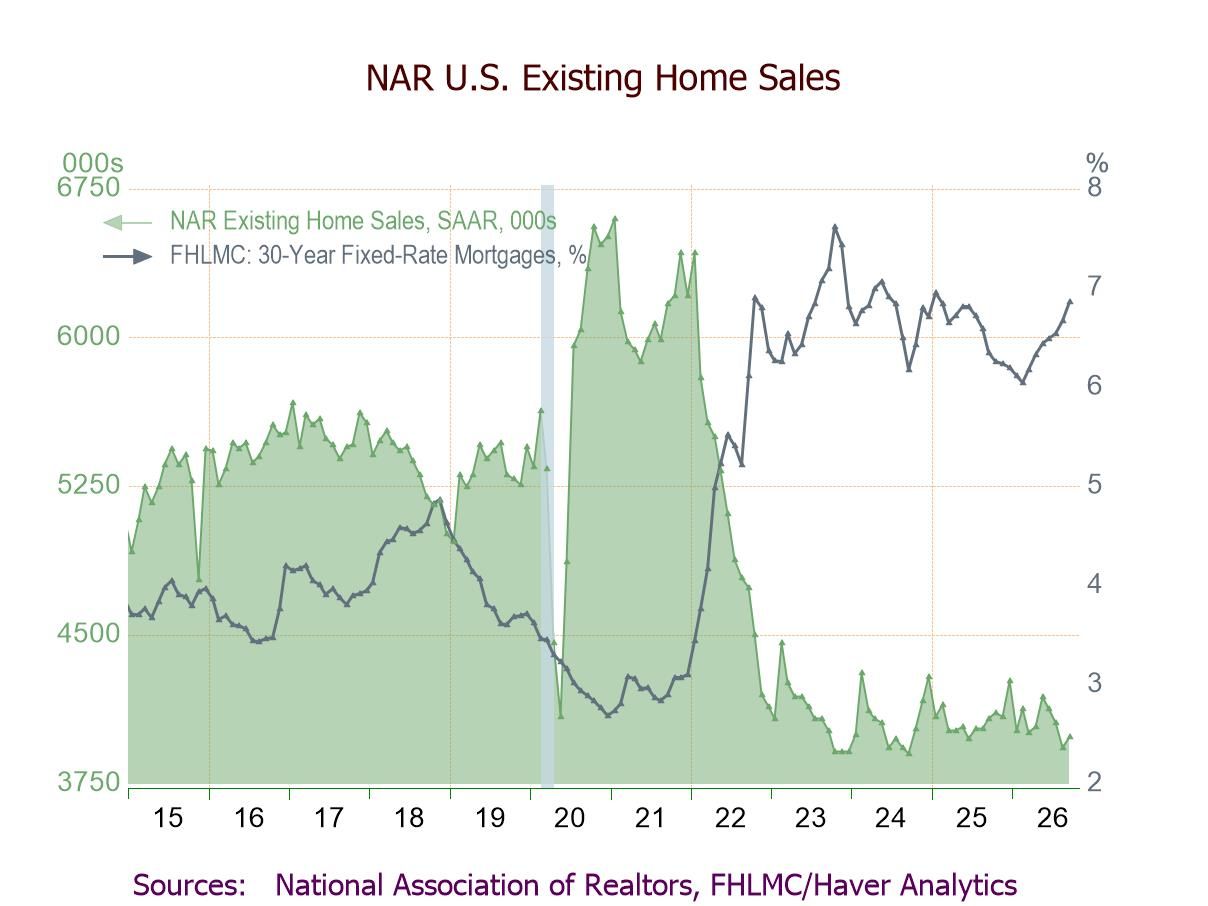
Existing home sales rose 1.5% m/m (-2.2% y/y) to 3.99 million units (SAAR) in September, the first monthly increase since May, after a 3.2% decline to 3.93 million in August (previously -2.0%; 3.98 mil.), according to the National Association of Realtors (NAR). Despite the latest m/m gain, August and September marked the two slowest months for home sales in 2026. The Action Economics Forecast Survey had expected September sales of 3.96 million units. Sales were 2.3% above a low of 3.90 million in September 2024 but 37.9% below a high of 6.43 million in January 2022 and 39.5% below a peak of 6.60 million in January 2021. The September gain coincided with a rise in the average 30-year fixed mortgage rate to 6.86%, the highest since January 2025, after increasing to 6.67% in August, according to Freddie Mac. The sales figures are based on closings of sales contracts signed over the past couple of months.
Existing single-family home sales rebounded 2.0% (-1.9% y/y) to 3.64 million units in September, the first m/m rise in four months, following a 3.3% decrease to 3.57 million in August, still 36.1% below a high of 5.70 million in January 2022. Sales of condos and co-ops fell 2.8% (-5.4% y/y) to 350,000 in September, matching the lowest level since May 2020, after registering at 360,000 in August and at 370,000 from February through July, remaining 52.1% below a high of 730,000 in January 2022.
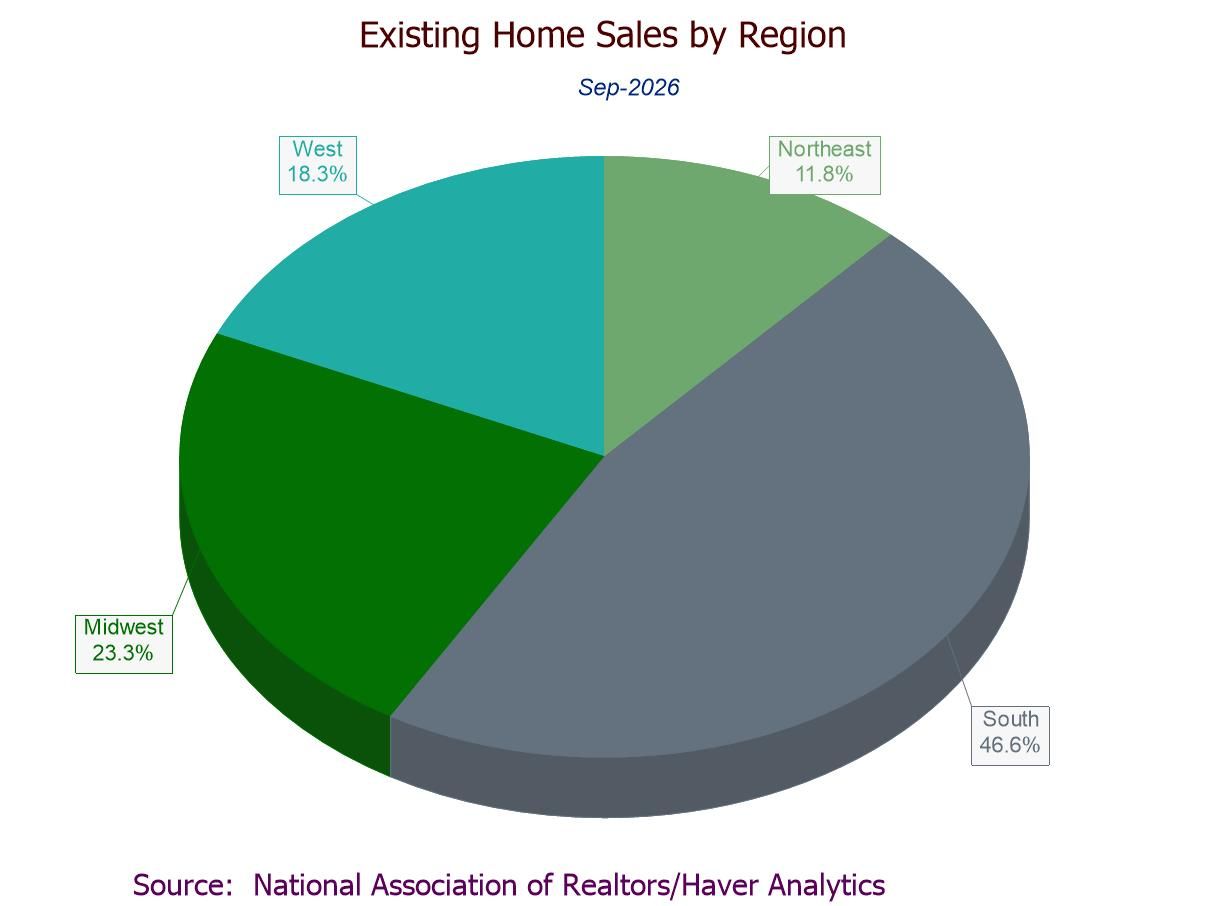
Regionally, September existing home sales showed a mixed performance. Sales in the South rose 2.8% (-0.5% y/y) to 1.86 million in September, the first m/m increase since May, after a 3.2% decline in August. Sales in the West grew 2.8% (-5.2% y/y) to 730,000, the highest level since June, after falling 1.4% in August and July. Sales in the Northeast fell 2.1% (-4.1% y/y) to 470,000, the lowest level since May, on top of a 4.0% August slide. Meanwhile, sales in the Midwest held steady m/m (-2.1% y/y) at 930,000 after a 4.1% August drop, matching the lowest reading since March. Notably, the South remained the dominant region, accounting for 46.6% of total U.S. existing home sales.
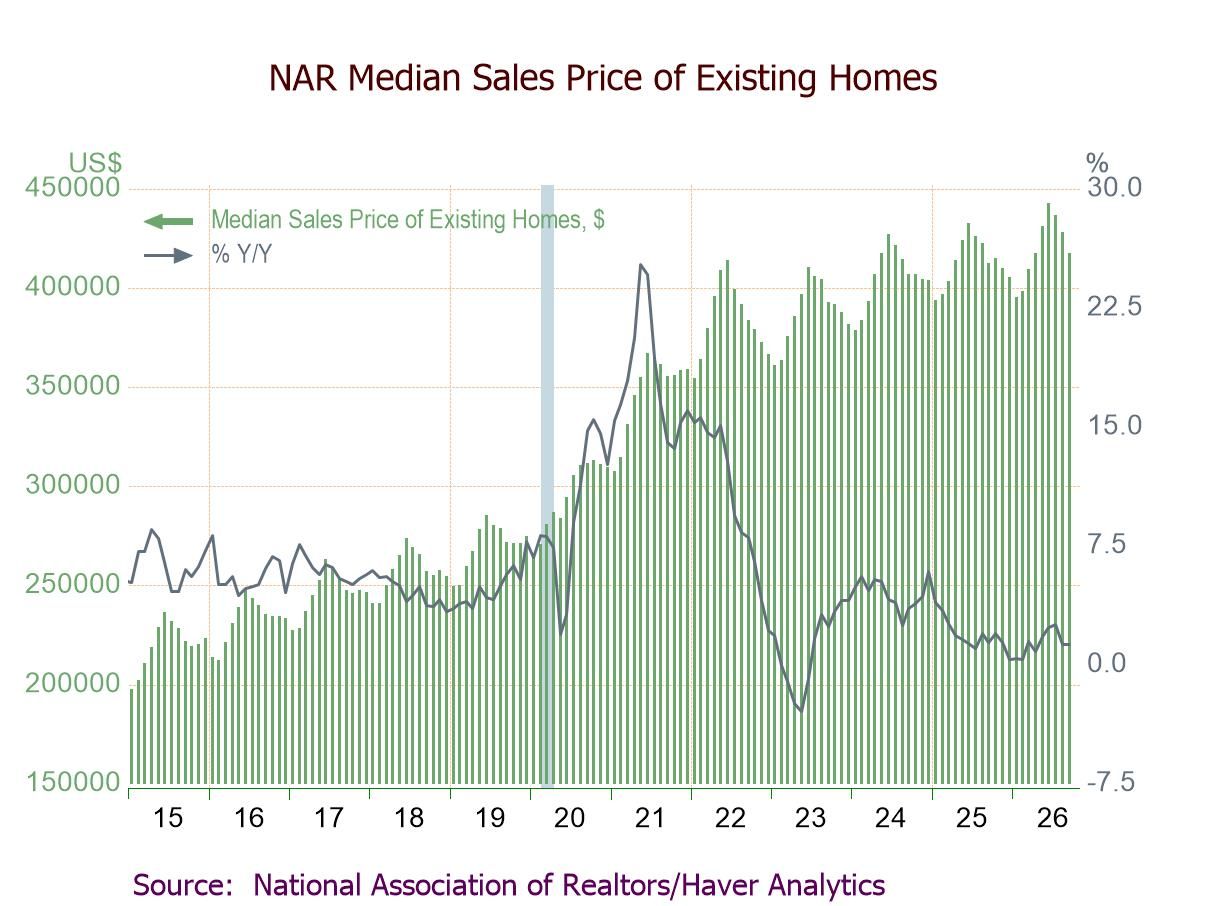
The median price of all existing homes (NSA) fell 2.4% (+1.3% y/y) to $417,500 in September, the lowest since April, after a 2.0% decrease to $427,700 in August ($429,100 previously). Prices remained 15.7% above a low of $360,800 in January 2023. The median price of an existing single-family home slid 2.5% (+1.2% y/y) to $422,700 in September following a 2.0% decline to $433,600 in August. Both prices posted the third successive m/m fall and the lowest level since April. The median price of condos and co-ops, down for the third consecutive month, slipped 1.7% (+1.2% y/y) to $363,700, the lowest since February, after a 1.3% August decrease to $370,000. Regionally, overall prices fell m/m in September in the Midwest (-3.9%; +3.1% y/y), Northeast (-3.4%; +4.7% y/y), South (-1.4%; +0.2% y/y), and West (-0.9%; -0.3% y/y).
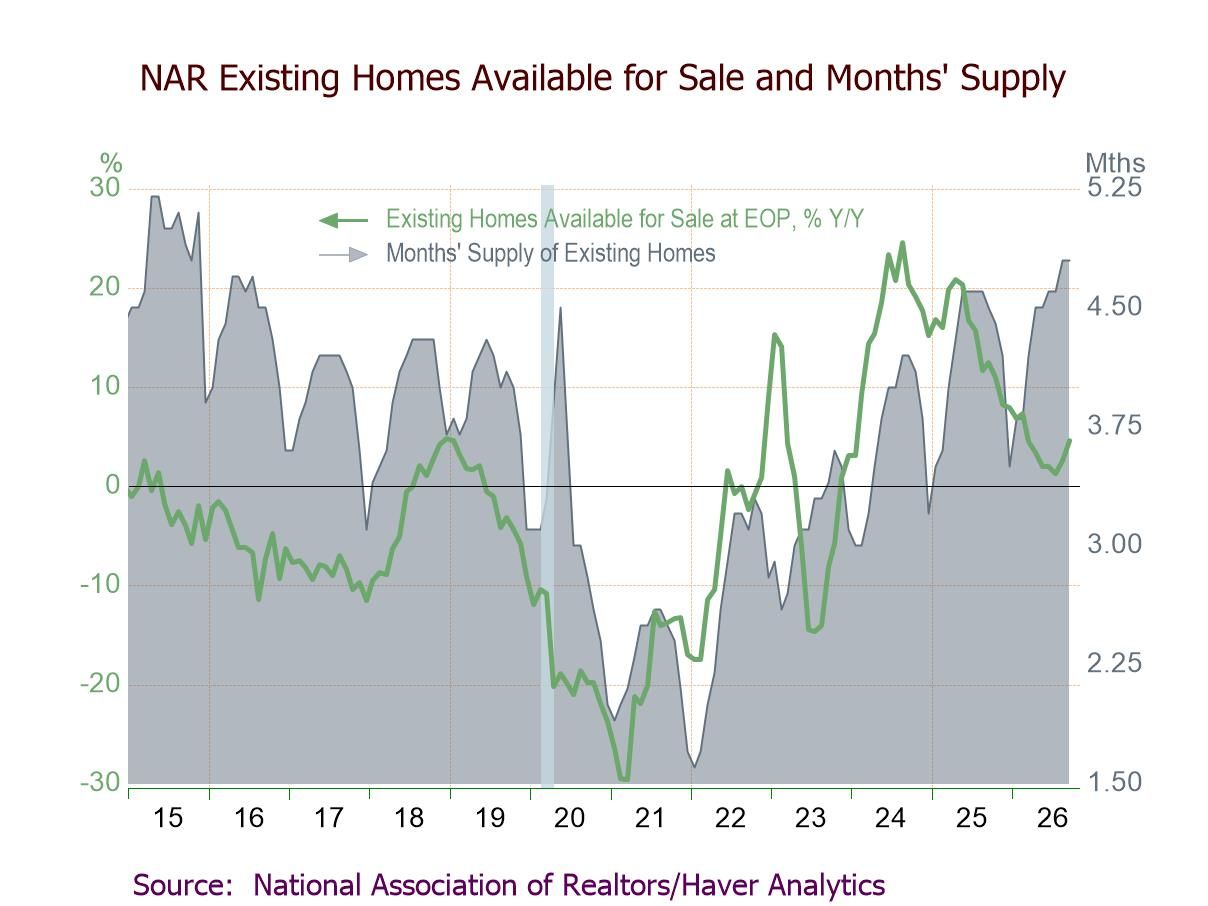
Inventories of homes for sale advanced to the highest level since November 2019. The number of existing homes for sale (NSA) climbed 1.9% (4.6% y/y) to 1.60 million units in September after registering at 1.57 million during the May to August period. The supply of homes on the market at the current selling rate (NSA) held at 4.8 months in September and August, the highest level since November 2015, up from 4.6 months in July and June. A record low in supply of 1.6 months was in January 2022.
The data on existing home sales, prices and affordability are compiled by the National Association of Realtors. The data on single-family home sales extend back to February 1968. Total sales and price data and regional sales can be found in Haver's USECON database. Regional price and affordability data and national inventory data are available in the REALTOR database. Mortgage interest rates can be found in the WEEKLY database. The expectations figure is from the Action Economics Forecast Survey, reported in the AS1REPNA database.

Winnie Tapasanun
AuthorMore in Author Profile »Winnie Tapasanun has been working for Haver Analytics since 2013. She has 20+ years of working in the financial services industry. As Vice President and Economic Analyst at Globicus International, Inc., a New York-based company specializing in macroeconomics and financial markets, Winnie oversaw the company’s business operations, managed financial and economic data, and wrote daily reports on macroeconomics and financial markets. Prior to working at Globicus, she was Investment Promotion Officer at the New York Office of the Thailand Board of Investment (BOI) where she wrote monthly reports on the U.S. economic outlook, wrote reports on the outlook of key U.S. industries, and assisted investors on doing business and investment in Thailand. Prior to joining the BOI, she was Adjunct Professor teaching International Political Economy/International Relations at the City College of New York. Prior to her teaching experience at the CCNY, Winnie successfully completed internships at the United Nations. Winnie holds an MA Degree from Long Island University, New York. She also did graduate studies at Columbia University in the City of New York and doctoral requirements at the Graduate Center of the City University of New York. Her areas of specialization are international political economy, macroeconomics, financial markets, political economy, international relations, and business development/business strategy. Her regional specialization includes, but not limited to, Southeast Asia and East Asia. Winnie is bilingual in English and Thai with competency in French. She loves to travel (~30 countries) to better understand each country’s unique economy, fascinating culture and people as well as the global economy as a whole.
More Economy in Brief
 Asia
Asia