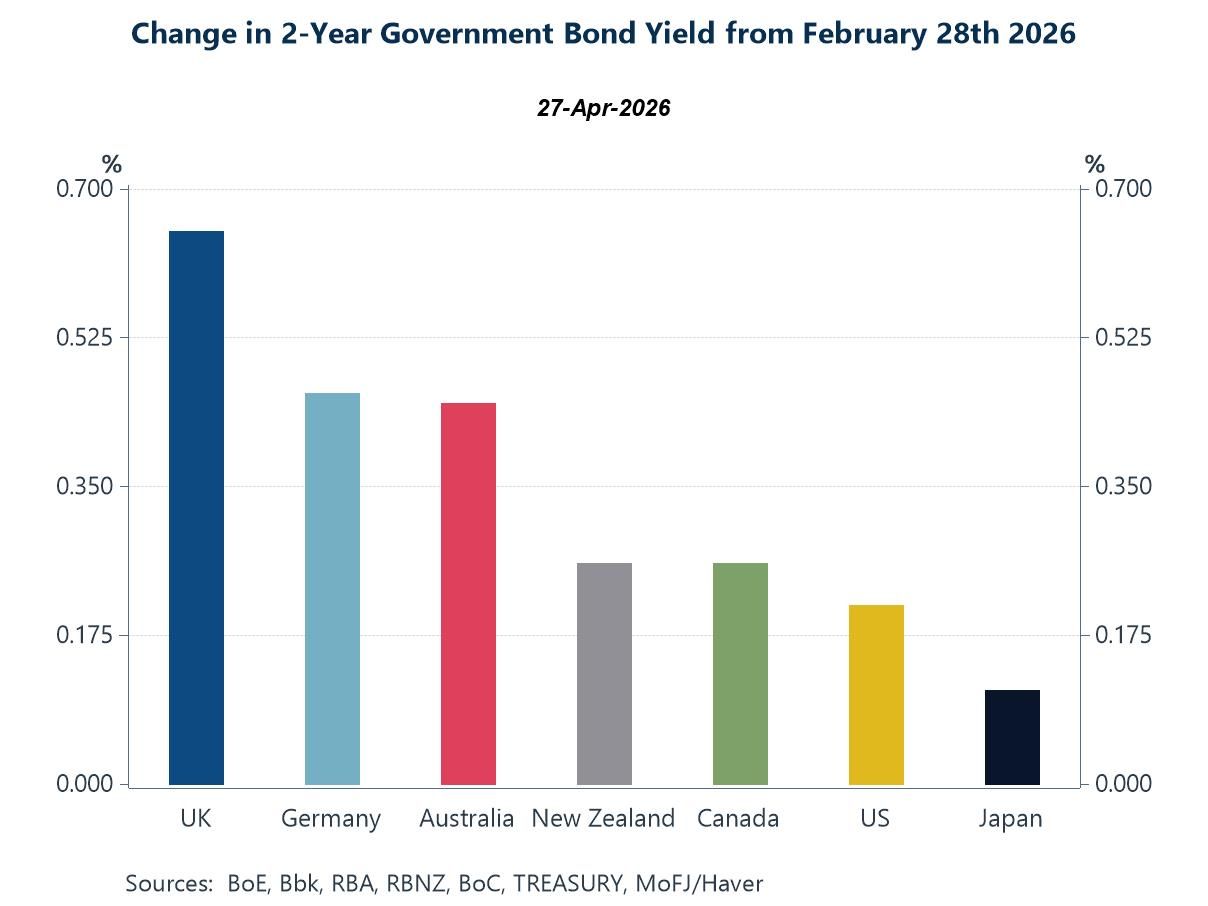
Against a backdrop of persistent geopolitical tensions, firmer energy prices and a busy week of central bank meetings—including the Fed, ECB, BoE and BoJ—financial markets have remained notably resilient, even as the macro narrative has softened at the margin. The message from this week’s charts is one of growing tension beneath that surface calm. Front-end bond yields have moved higher, signalling a shift toward a more cautious, “higher-for-longer” policy outlook (chart 1). At the same time, real-time recession indicators for the United States suggest risks remain contained for now (chart 2). Consumer confidence data paint a more uneven picture, with sharper declines in the euro area and UK than in the US, highlighting regional vulnerabilities to the current energy shock (chart 3). The ECB’s latest bank lending survey reinforces this, pointing to tighter credit conditions and weaker demand—factors that are likely to weigh further on European growth (chart 4). By contrast, developments in the semiconductor sector underline a different dynamic: an intensifying global boom, with accelerating price pressures reflecting both strong AI-driven demand and emerging supply-side constraints linked indirectly to energy and logistics disruptions (chart 5). Finally, labour market data confirm that the AI surge is not merely a market narrative but a tangible structural shift, with hiring for AI-related roles accelerating across economies (chart 6). Taken together, these signals point to a more complex macro environment—one in which resilient markets coexist with softening growth, more persistent inflation risks and increasingly delicate policy trade-offs.
 Global| Apr 30 2026
Charts of the Week: Tension Beneath the Surface
by:Andrew Cates
|in:Economy in Brief
 USA| Apr 30 2026
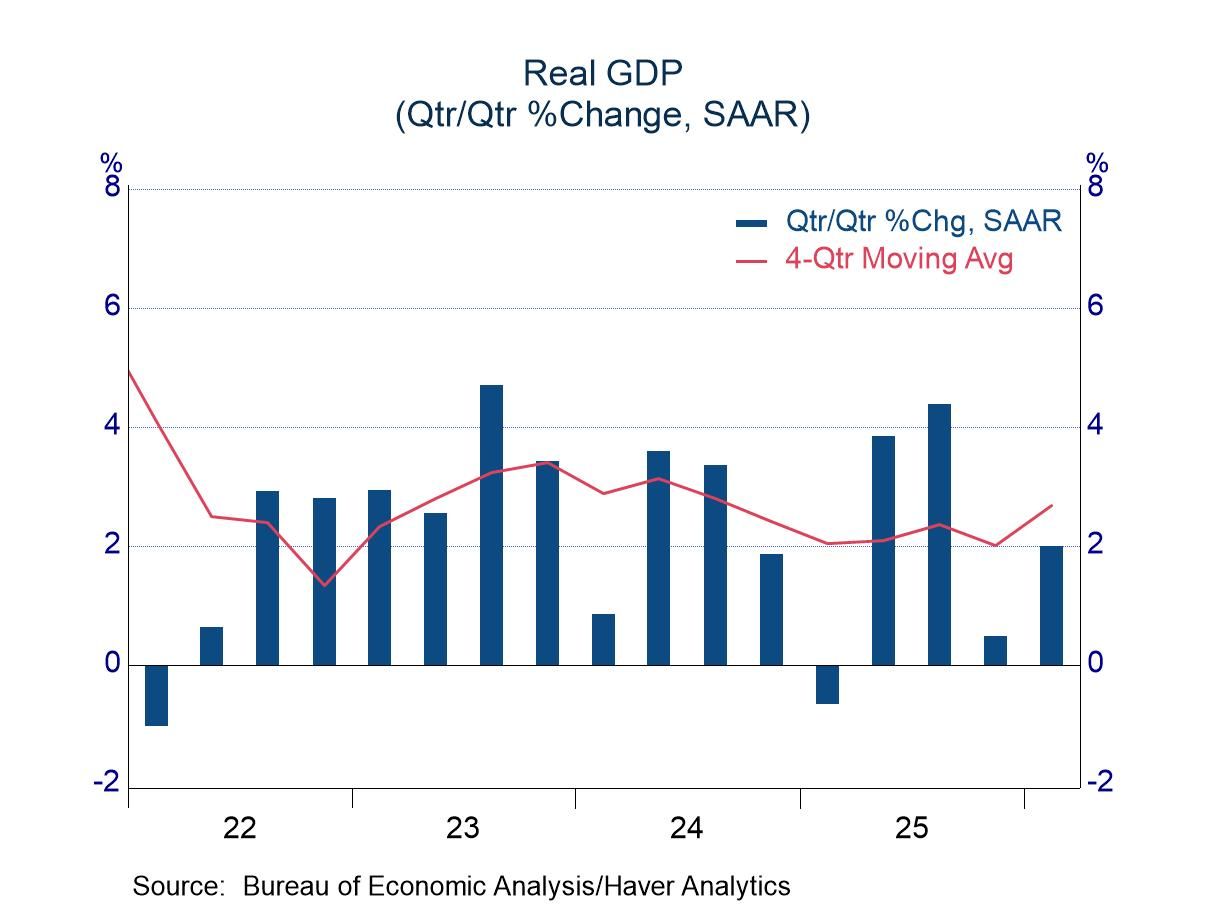
Q1 GDP: Weathering the Challenges; Trend-Like Growth
- Robust business investment led the advance; moderate support from consumers.
- Government spending jumped with the reopening of most federal agencies.
- The trade sector remained volatile, making a sizeable negative contribution in Q1.
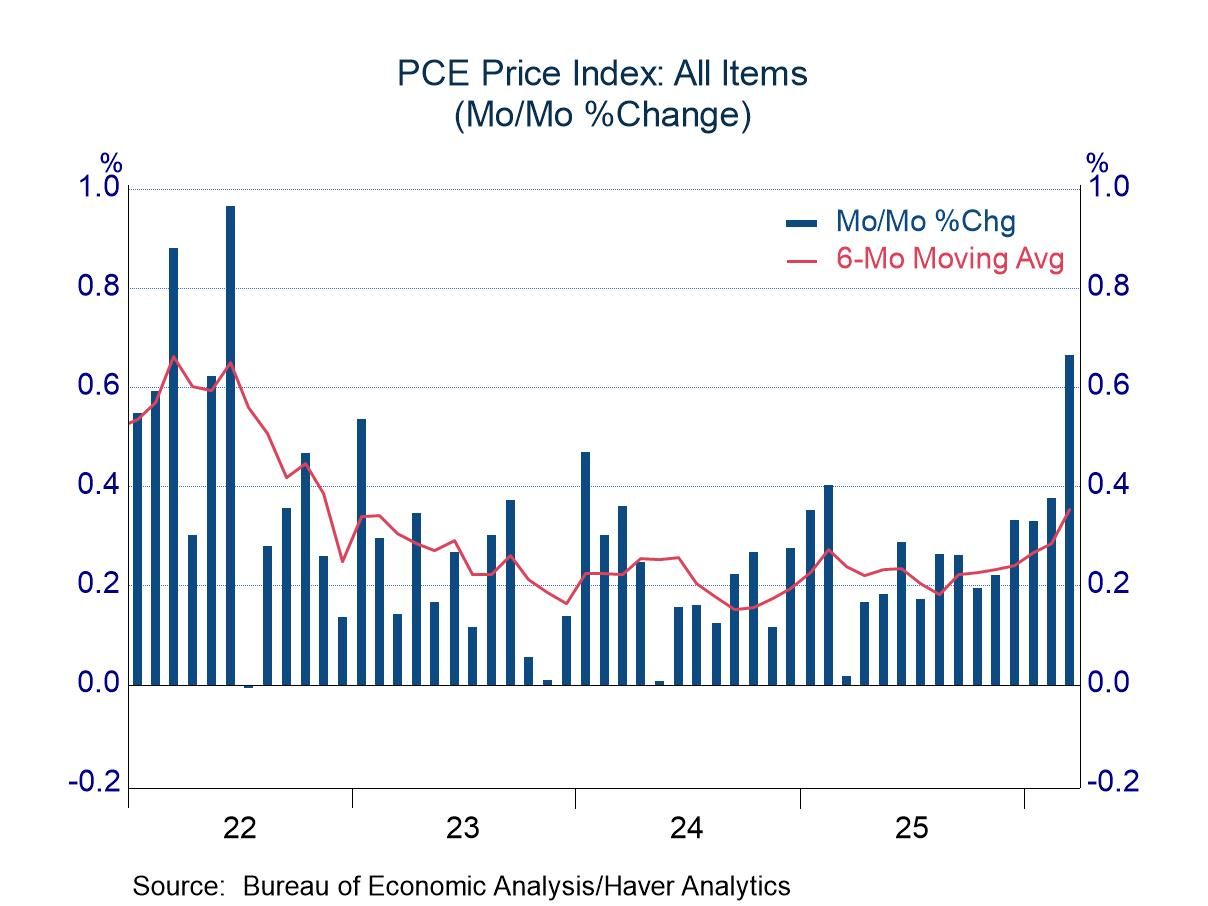
- The PCE price index jumped 0.7%, reflecting an 11.6% m/m surge in energy prices.
- The core index was up 0.3%, in line with expectations but still well above the Fed’s target.
- Personal income increased 0.6% m/m, led by a 0.4% m/m rise in compensation.
- Personal consumption jumped 0.9% m/m with a slight upward revision to February.
- However, much of the March gain in nominal consumption also reflected the jump in energy prices.
- Real consumption rose by a more modest 0.2% m/m.
by:Sandy Batten
|in:Economy in Brief
 USA| Apr 30 2026
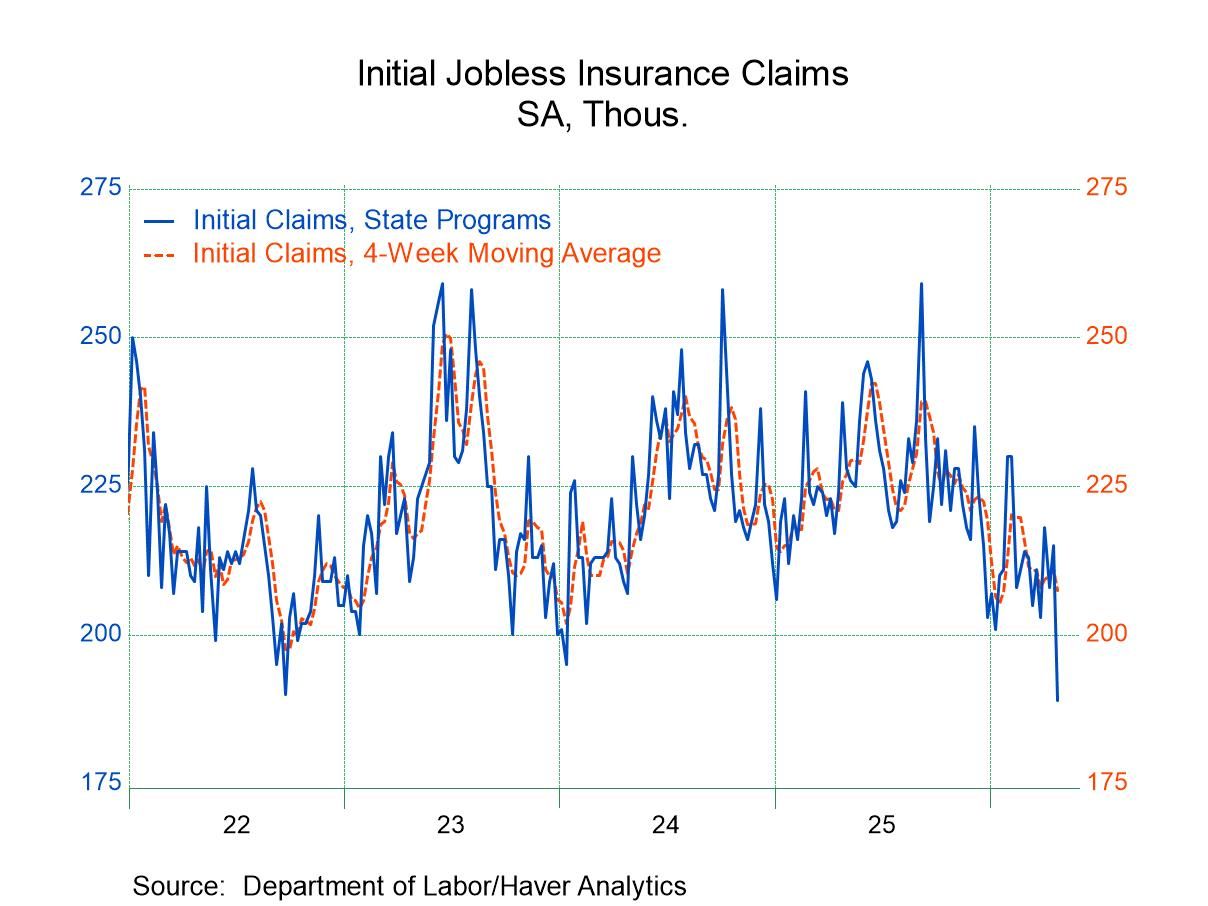
U.S. Initial Unemployment Claims dropped in the Week of April 25
- New claims dropped by 26,000 to 189,000.
- Continuing claims declined by 23,000 to 1.785 million.
- The insured unemployment rate remained at 1.2%.
 Europe| Apr 30 2026
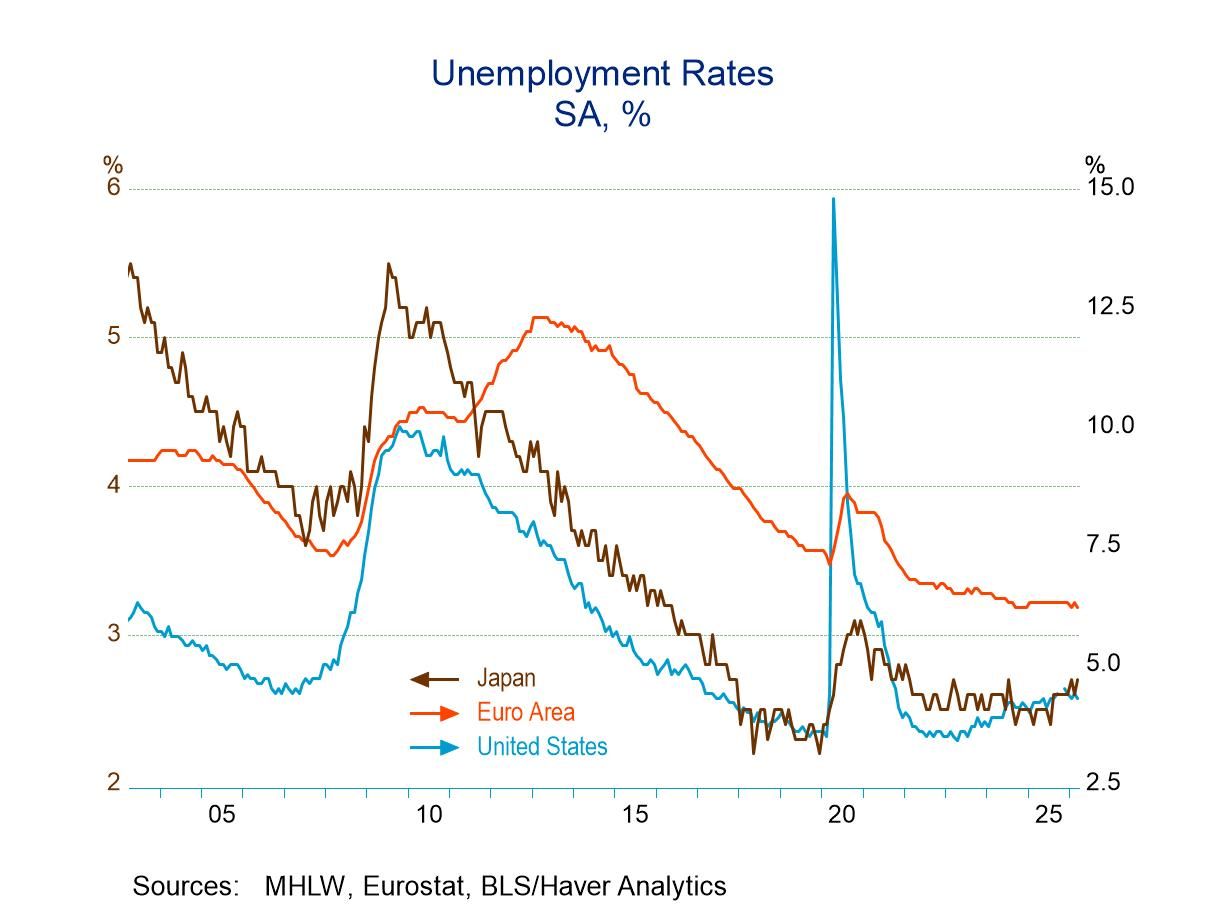
Low EMU Unemployment Rates Still Yield Monetary Restraint
Unemployment rates are stable near all-time lows for EMU Unemployment rates in the European Monetary Union (EMU) continued to hover at the lowest level. The EMU all-time low unemployment rate is 6.2%, and that’s the number reported for March. There have been five of these 6.2% unemployment rates monthly in the history of the monetary union.
Unemployment rates in March saw declines in five of the 12 early reporting countries: the Netherlands, Italy, Finland, Belgium, and Austria. Over the last three months, there were net declines in the unemployment rates in four countries, while year-over-year once again four countries—though a different four—showed declines in the unemployment rate.
Unemployment rates, evaluated relative to their historic standings, have a median rank standing in their 33.6 percentile. That is the median unemployment rank among these 12 countries; it shows that the unemployment rate is in the lower one-third of its historic rank. Among the 12 early reporting countries, only three failed to have unemployment rate rankings below their 30th percentile; those three are Austria with a 71.3 percentile ranking, Finland with an 80th percentile ranking, and Luxembourg with a 98.8 percentile ranking. So, there are three countries among these 12 that have relatively high unemployment rates compared to their histories, whereas the rest of the reporters have unemployment rates below their respective 30th percentiles.
 USA| Apr 29 2026
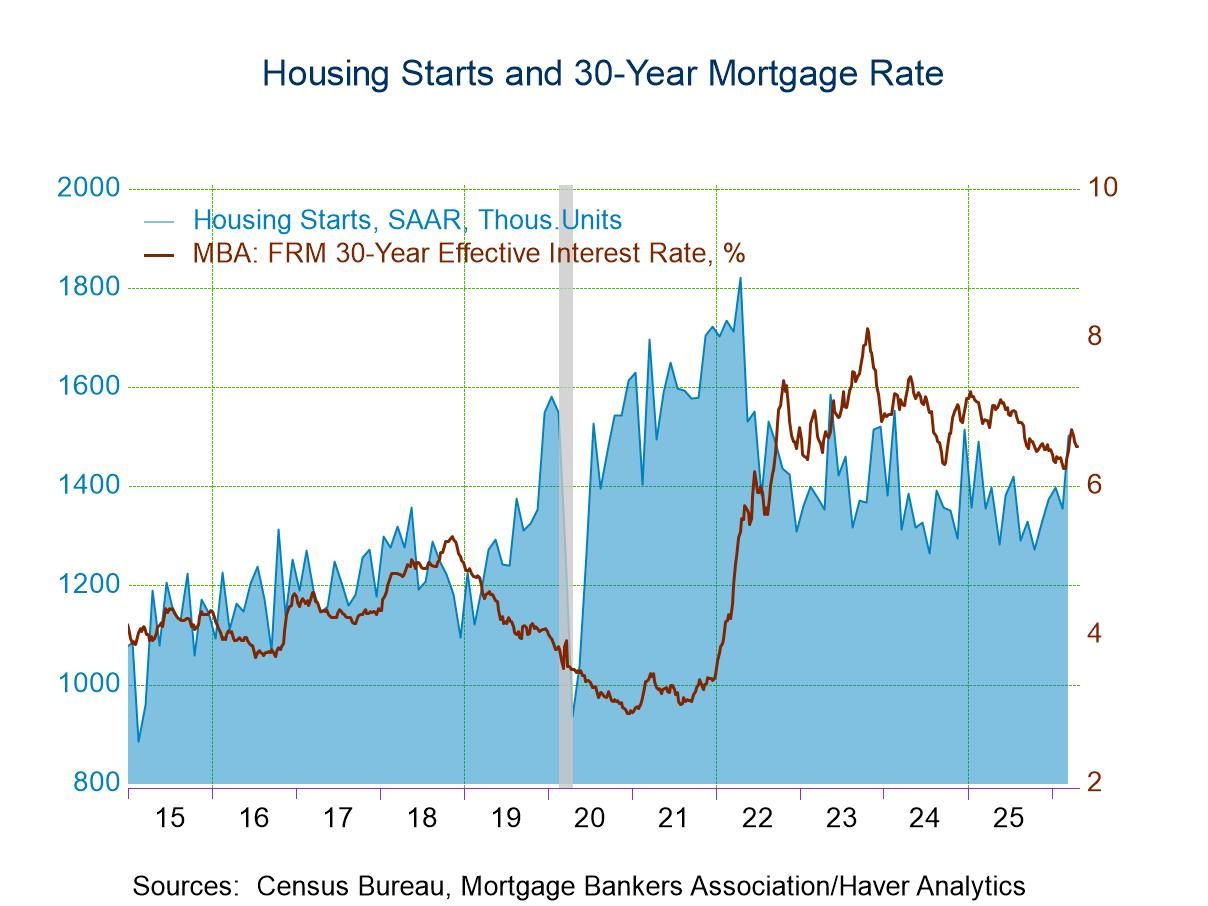
U.S. Housing Starts Fell in February but Rebounded in March
- Data for both February and March were included in today’s report to catch up from delays due to the federal government shutdown last October.
- Starts fell 3.0% m/m in February but rebounded 10.8% m/m in March.
- The 7.2% q/q increase in Q1 was the largest quarterly gain since the economy reopened after the pandemic shutdown in 2020.
- In contrast, permits jumped 11.0% m/m in February but fell 10.8% m/m in March and were up only 1.0% q/q in Q1.
by:Sandy Batten
|in:Economy in Brief
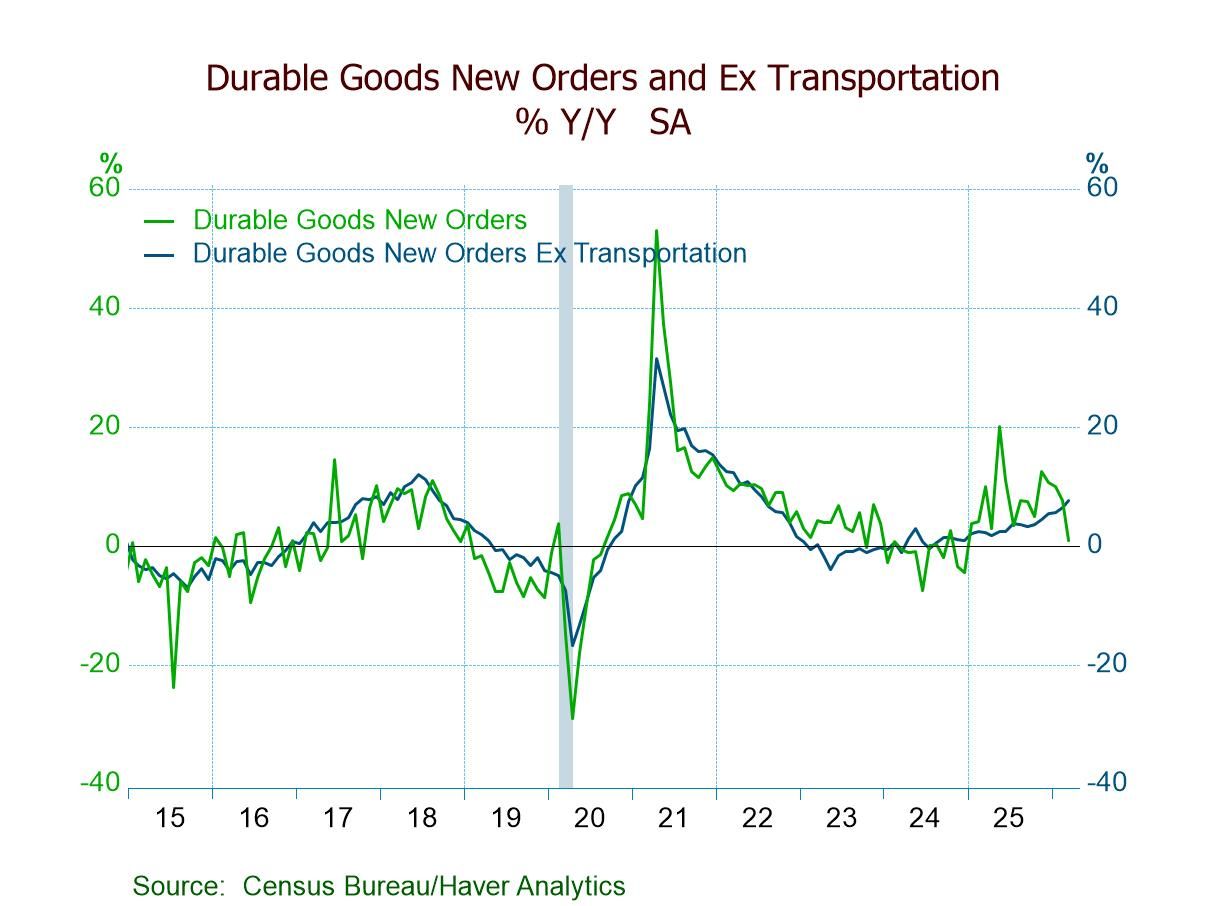
- March headline orders +0.8% m/m, first increase in four mths.; +0.8% y/y, lowest since Dec. ’24.
- Defense aircraft & parts +16.9% m/m following February’s +0.5%.
- Transportation orders +0.8%, first m/m rise since Nov.; orders ex transp. +0.9%, 11th straight m/m increase.
- Core capital goods shipments +1.2%, sixth m/m gain in seven mths., pointing to a solid contribution to Q1’26 GDP from business equipt. spending.
- Durable goods shipments +0.7%; unfilled orders +0.1%; inventories +0.2%.
 USA| Apr 29 2026
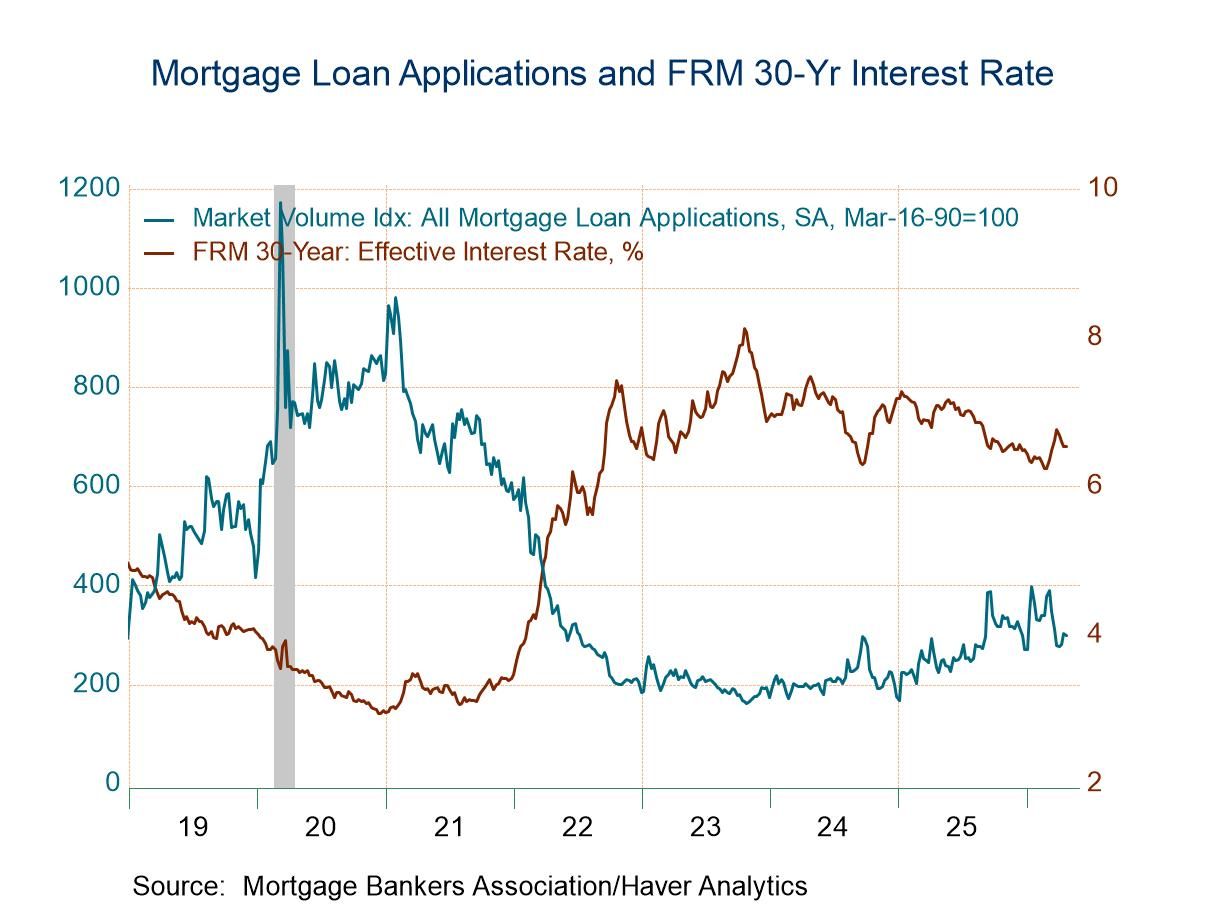
U.S. Mortgage Applications Edged Down in the April 24 Week
- Applications for loans to purchase rose, while applications for loan refinancing declined in the latest week.
- Interest rate on 30-year fixed-rate loans rose 1bps to 6.54%.
- Average loan size edged up.
- of8Go to 1 page