

- Monthly gains in headline CPI (0.4%) & core CPI (0.3%) advance.
- Year-over-year rates unchanged for headline CPI (3.4%) and slightly down for core CPI (2.4%), both remaining above the Fed’s target.
- Energy prices up 2.1% m/m, w/ the y/y rate accelerating to 16.3%, highest since May.
- Services prices up 0.3% m/m, w/ the y/y rate steady at 3.0%.
- Shelter prices up 0.3% m/m, w/ the y/y rate easing to 3.0% from 3.2%.
- Supercore CPI up 0.5%, w/ the y/y rate accelerating to 3.0% from 2.8%.
USA| Sep 11 2026
U.S. Consumer Price Inflation Steady in August at 3.4% Y/Y


More Commentaries
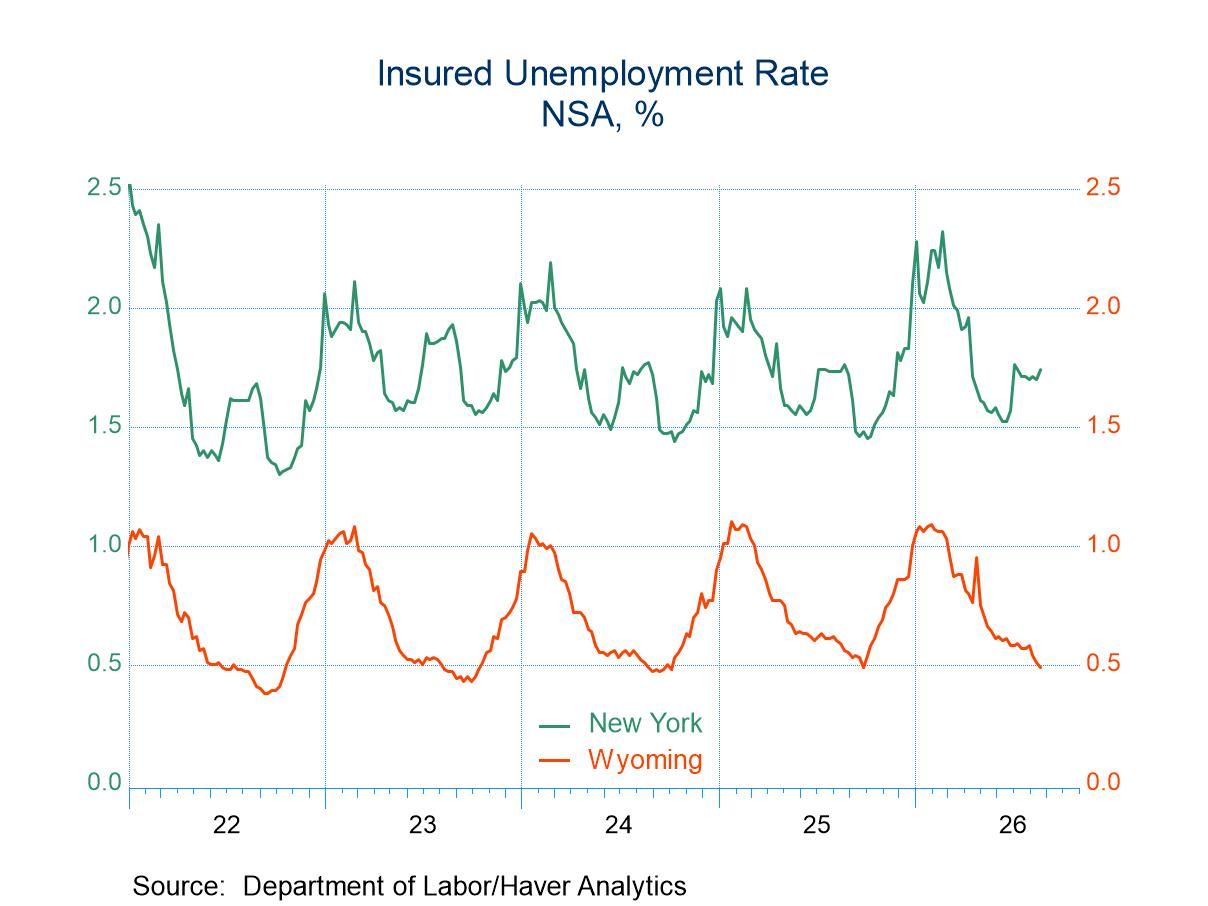
- New claims edged down by 1,000 to 206,000 in the week of September 5.
- Continuing claims inched down by 1,000 to 1.774 million in the week ending August 29.
- The insured unemployment rate was unchanged at 1.2% in the week of August 29.
 Germany| Sep 10 2026
A Counterpoint to the ECB Rate Hike from German Core Inflation
On the day that the European Central Bank met and decided to raise interest rates by 25 basis points, the German inflation report for August firmed, showing that headline inflation rose 0.3% on the month, with the core rising by 0.1%. Year-over-year headline inflation in Germany is excessive at 3%. However, the core rate at only 2.3% is not that far above the ECB target for all of the monetary union, a pace of 2%. German inflation for the headline is 3.6% over six months and 3.7% over three months; however, over three months and six months, German core inflation is running at 2%, the ECB’s chosen speed for inflation for the union as a whole.
German core inflation provides a counterpoint to headline inflation. It enables a strong argument that energy price inflation has not spread throughout the monetary union. However, with the ECB raising rates, German bond yields have risen to a 17-year high and the ECB seems determined to treat energy price inflation as something important and significant that it needs to fend off.
Economic conditions still show growth in the monetary union as weak at 1.0%. Growth among the top four economies is 1.1% with growth for the rest of the union year-over-year at 0.5%. So, the ECB is raising interest rates in an environment where growth is modest-to-low and where headline inflation is surging but where core inflation is much better behaved. The pace for Germany at 2% over three months and six months is right on target; 2.3% over 12 months is slightly excessive. For the entire euro area, the core inflation rate is closer to 2.5%, which is uncomfortable but not a terrible overshoot, certainly not with energy prices having flared the way they have.
Diffusion statistics show that inflation over three months in Germany has accelerated in only 27.3% of the categories; however, inflation has accelerated in 72.7% of the categories over six months and in 63.6% of the categories over 12 months. The tempered three-month inflation rate breadth does not dominate the other two metrics; however, it provides another counterpoint to the notion that inflation from oil price increases is spreading.
 USA| Sep 09 2026
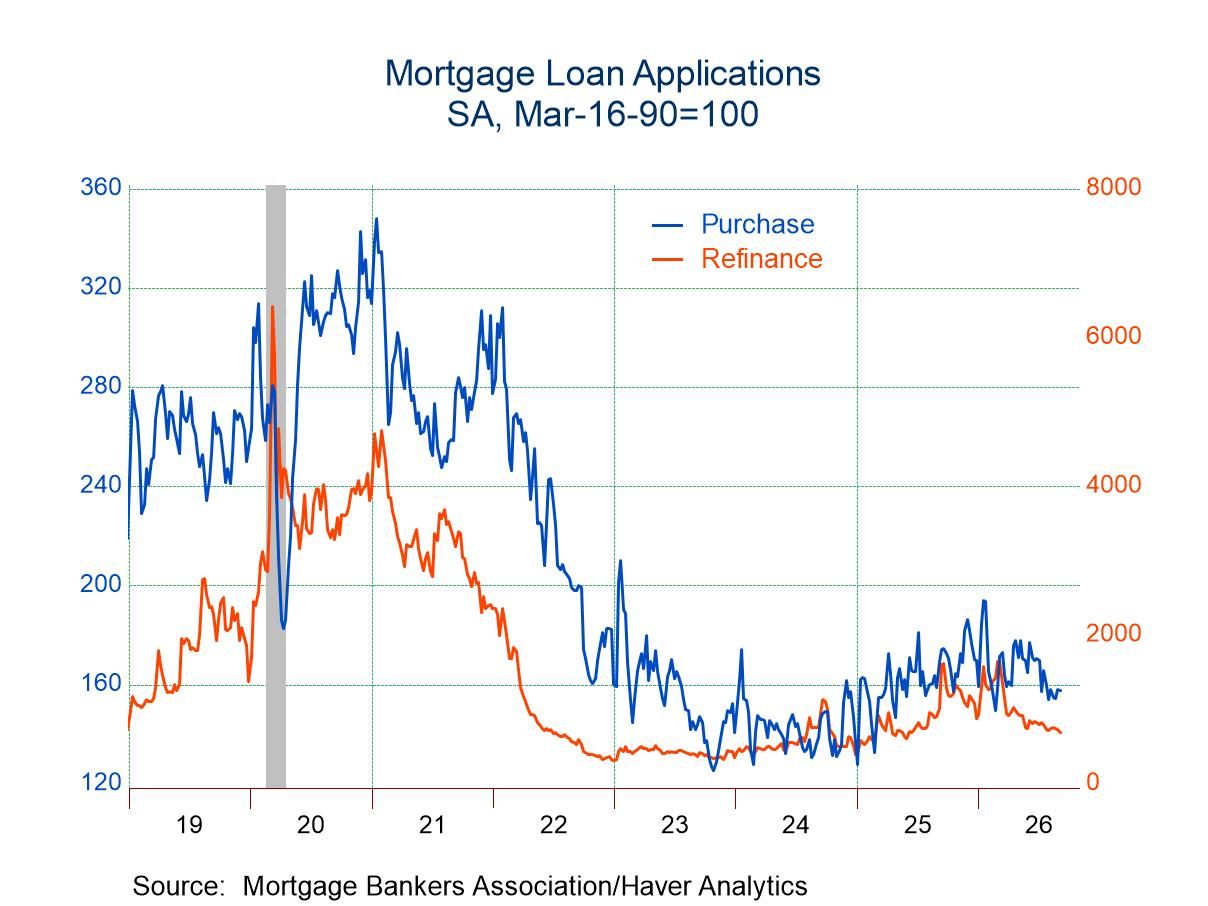
U.S. Mortgage Applications Declined in the September 4 Week
- Both applications for loans to purchase and applications for loan refinancing declined in the latest week.
- Interest rate on 30-year fixed-rate loans rose to 7.05%.
- Average loan size rose in the September 4 week.
 Europe| Sep 09 2026
German, French, and Portuguese IP Fall
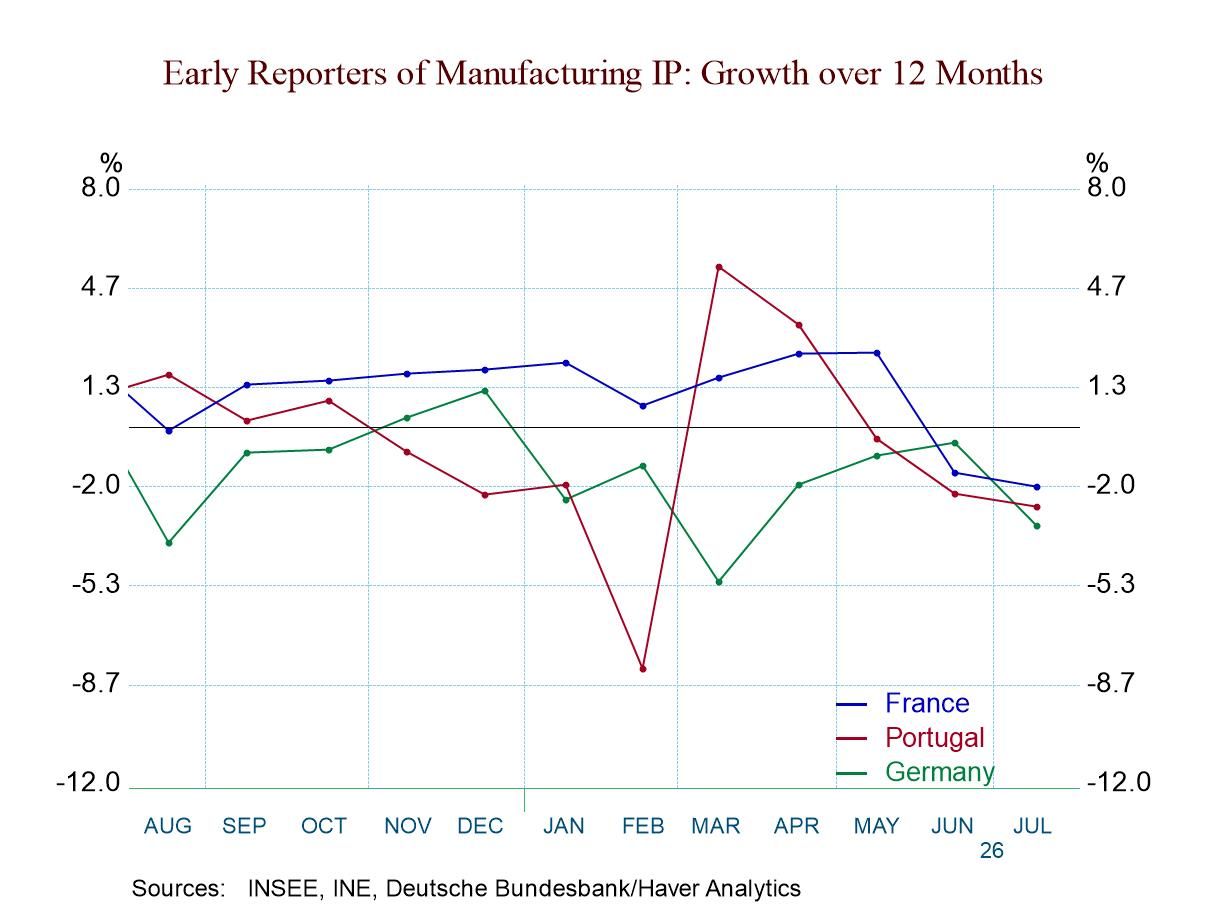
Early reports for industrial production showed declines in Europe, with German industrial production falling 1.1% in July, French output falling 0.8%, and Portuguese output falling 0.2%. Nonmonetary union members Sweden and Norway both showed increases in July. The German IP report was released on Monday during the U.S. holiday; the Portuguese IP was released on September 1, while the French IP was reported today.
German production shows relatively steady declines over 12 months, six months, and three months of around 1% or a little bit more at an annual rate. Outputs of consumer goods and capital goods on all three horizons show declines. Intermediate goods output shows declines over 12 months and three months, with an intervening increase over six months at a 2.2% annual rate.
German manufacturing output fell by 2.3% in July, showing steady declines over 12 months, six months, and three months, the same as headline output. However, German manufacturing orders in real terms increased by 2.5% in July, showing an accelerating pattern from 12 months to six months to three months. Current real manufacturing sales fell by 1.5% in July and may still be holding back output. There is a sequential deceleration in real sales, with sales falling by 0.3% over 12 months, by 3.5% over six months at an annual rate, and by 7.3% over three months at an annual rate. Presumably, that pattern is about to be dominated and reversed by the strength in real orders.
Other German indicators from ZEW, IFO, and the EU Commission showed improvement in July compared to June, although the sequential readings are less reassuring since only the EU Commission index shows persistent improvement.
French industrial output fell by 0.8% in July, showing accelerating output declines from 12 months to six months to three months. Similarly, Portugal showed a 0.2% decline in July, with accelerating output declines from 12 months to six months to three months.
The nonmonetary union members Sweden and Norway not only showed strong output increases in July but also sequential acceleration from 12 months to six months to three months.
The EMU begins the quarter to date with weak results as German, French, and Portuguese outputs show declines, while Sweden and Norway are showing very strong increases. For the European Monetary Union members, it's a poor start to a new quarter.
- NFIB Small Business Optimism Idx down 1.1 pts. to 98.7 in Aug., still above its 52-year avg. of 98.0.
- Uncertainty Idx down 2 pts. to 89, remaining above the historical avg. of 68.
- Expectations for economy down 5 pts. to 10%, lowest since May.
- Hiring plans down 3 pts. to 17%; earnings trends down 3 pts. to -19%.
- Expected real sales down 1 pt. to 6%, a three-month low.
- Plans to expand business unchanged at 12%, highest since Feb.
- Firms raising avg. selling prices steady at 31%, lowest since April.
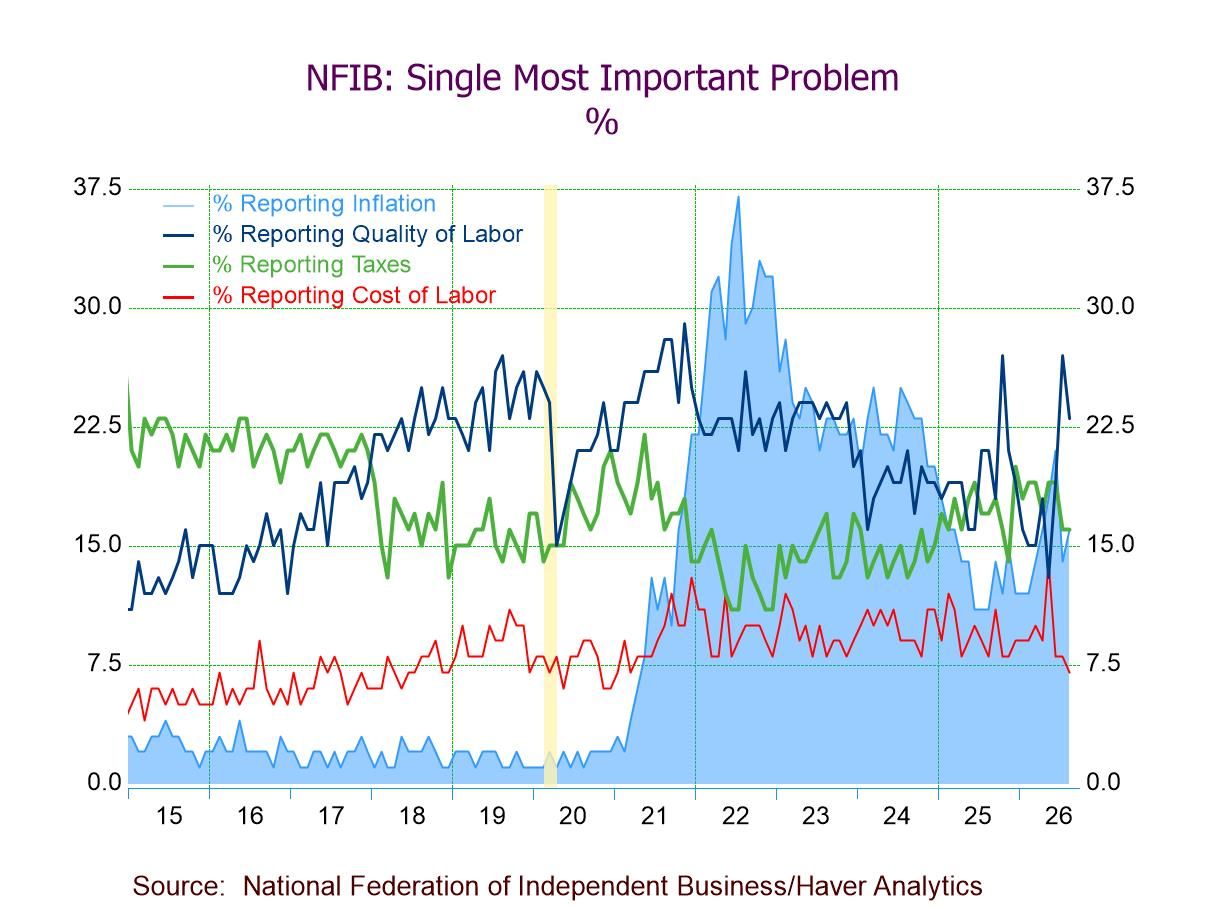
- Top three business concerns: labor quality (23%), taxes (16%), and inflation (16%).
 Japan| Sep 08 2026
Japan’s Economy Watchers Regain Faith Steadily
Japan's economy watchers are not in a state of bliss, but they have gradually been improving their outlook after suffering a severe setback when the attacks on Iran began.
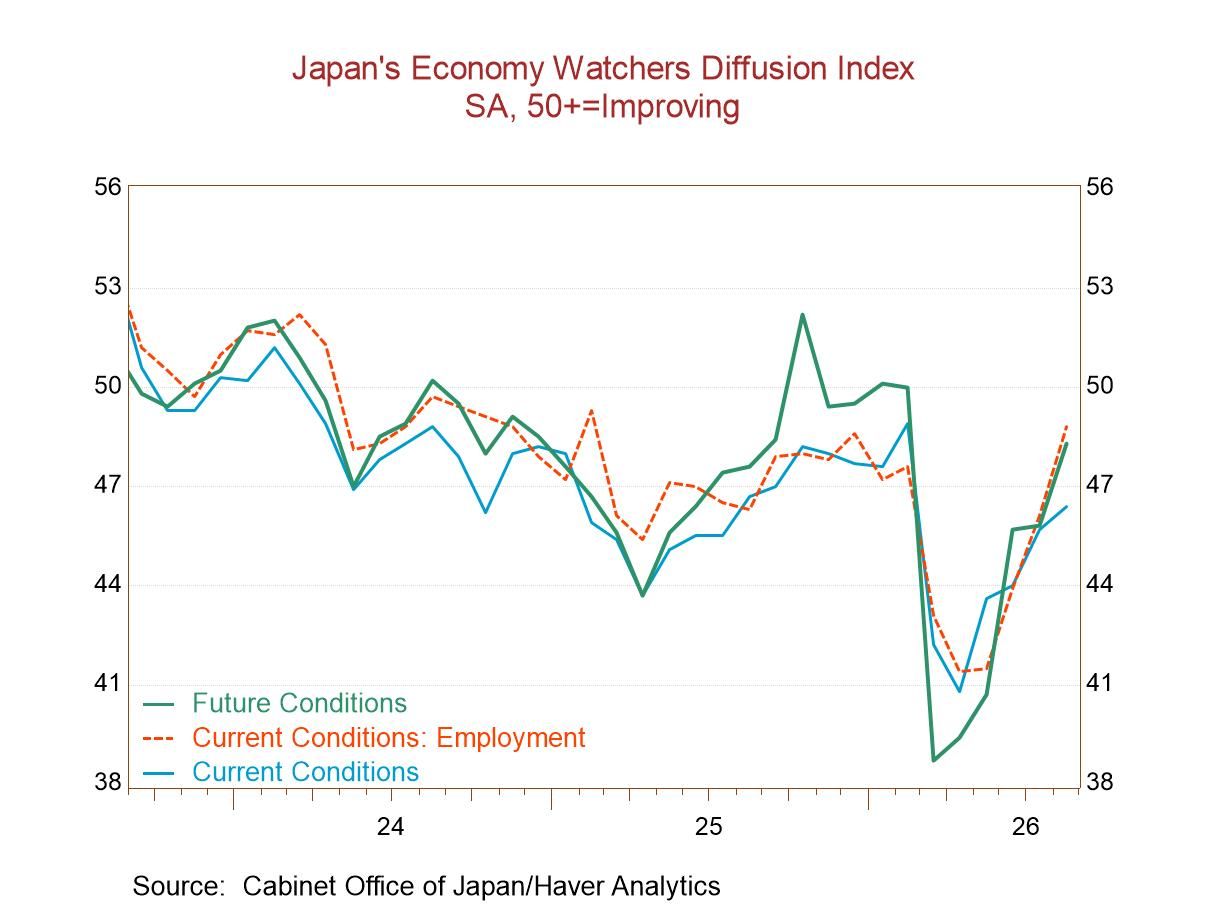
The current index for economy watchers, which is a diffusion index, at 46.4, is below 50 and therefore indicates some deterioration in attitudes about the economy. However, the reading reflects an improvement, and there has been an ongoing improvement in the current situation.
The future reading, similarly, has been improving; in August, the future index is at 48.3, also indicating some deterioration, but less than a month ago, with an ongoing improvement visible there as well.
Standings The percentile standings of the current index and the future index show slightly stronger readings for the future than for current assessments. The future index has a 49.4 percentile standing, placing it near its median for the evaluation period that goes back to August 2005. The current situation has a standing at its 43rd percentile, about 7 percentile points below its median for that period.
Current Index The current index shows three readings above their 50th percentile standings: eating & drinking places, corporations, and corporate manufacturers. However, even so, all of the current readings in August have diffusion values below 50, indicating that all are showing deterioration, although less deterioration than in the previous month.
Future Index The future reading itself is below its 50th percentile; however, six components are above their 50th percentiles. These include the overall assessment of households, the reading for eating & drinking establishments, services, corporations, including both manufacturers and nonmanufacturers as separate readings. The future reading for housing is extremely weak, with a 29.2 percentile standing, and employment has only a 36th percentile standing in the future index; that's similar to its weak 33rd percentile standing in the current index.
The lagging performance of employment in both indexes is certainly worrisome because that's the basis for jobs and spending. On the other hand, the future reading for households is above its 50th percentile. Households in the current index show a 44.7 percentile standing, below their median as well as below 50 overall, but not weak in a way that is especially worrisome.
The graph shows that there is an ongoing improvement in the assessments by the economy watchers. Their assessments dropped very sharply at the time of the Middle East conflict and the threat to oil supplies. Those assessments have since been recovering quite steadily and have moved to positions back closer to neutral, although still not to the point of registering growth. Among the current and future readings, only the reading for the service sector of the future shows a diffusion value in August above 50, indicating actual expansion; at least there's one, and that's a start.
 Asia| Sep 07 2026
Economic Letter from Asia: Shock and Boom
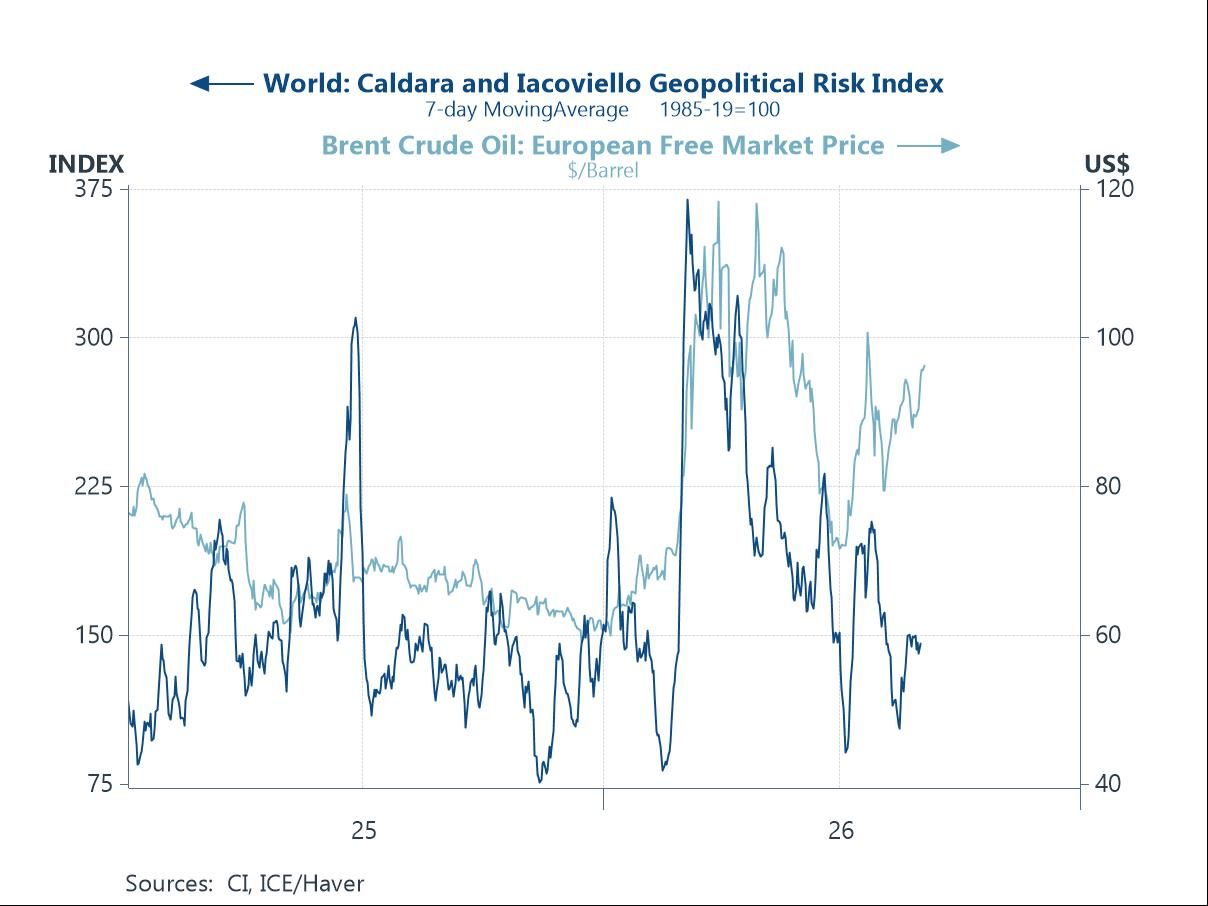
In this week's Letter, we weigh Asia's building supply-side inflation risks against the AI export boom still powering regional growth. The US-Iran conflict has escalated once again, lifting crude prices and keeping geopolitical risk elevated (chart 1). Should oil hold at current levels without advancing further, base effects should eventually pull that impulse out of inflation. A second price risk is now building, and it is El Niño, an event already under way (chart 2). Drier conditions in parts of Southeast Asia and redistributed rainfall elsewhere stand to disrupt crops and lift food prices. Markets have started to price these risks in through higher yields. Japanese government bond yields have surged alongside global peers, also pushed by fiscal concerns as the budget is drawn up. Domestic buyers have reduced their net sales of JGBs, with the 10-year yield now flirting with 3% (chart 3). Set against these pressures, advanced Asia's AI buildout continues to run apace. Producers of critical AI chips in Japan, Taiwan and South Korea are posting double and triple-digit export growth (chart 4). The focus is also broadening from AI infrastructure towards physical applications such as humanoid robots. China has benefited too, with integrated circuits and computer equipment contributing about half of its export growth (chart 5). The remainder has come from other goods, including EVs, amid a still-robust overall export trend. By region, ASEAN-6 and India have driven that growth, offsetting the steep fall in shipments to the US (chart 6). That success, however, has again deferred China's longer-term rebalancing towards consumption.
US-Iran tensions: No let up The US-Iran situation has escalated once again with a familiar headline, as both sides traded strikes over the weekend, with no clear resolution in sight. The latest strikes have brought the conflict well into its sixth month, pushing crude oil prices higher and keeping measures of geopolitical risk elevated (chart 1). All of this continues to give policymakers reasons to worry. With that said, while elevated oil prices have been pushing inflation upwards, that impulse should eventually fade. If prices stay at current high levels for at least another six months without advancing substantially further, base effects will pull them out of inflation calculations.
 USA| Sep 04 2026
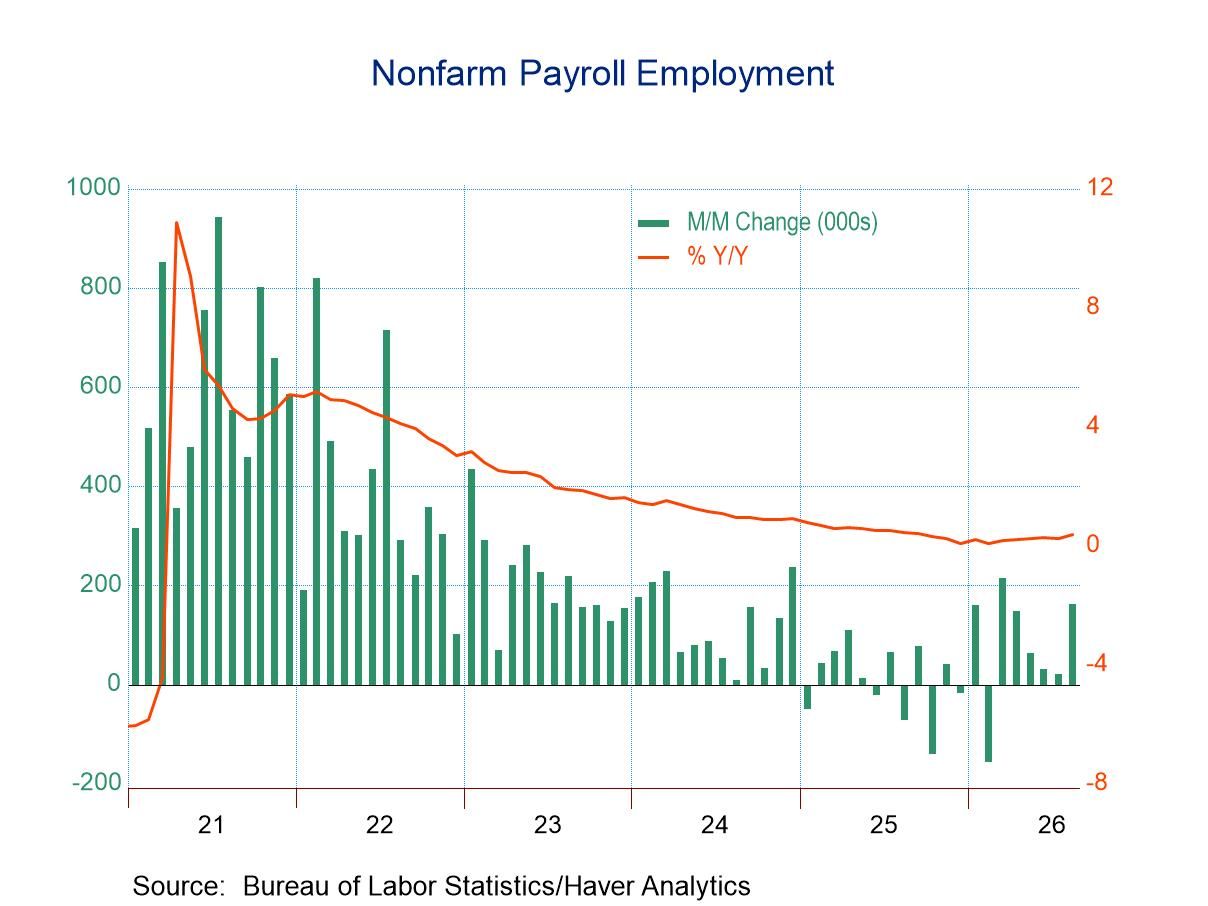
U.S. Payroll Employment Surged in August
- U.S. nonfarm payrolls surged 162,000 in August with upward revisions to both June and July.
- The market consensus looked for a 52,000 increase.
- The unemployment rate was unchanged at 4.1%, the lowest rate since June 2025.
- In the household survey, employment jumped 569,000, its largest population-adjusted increase since November 2023.
- Average hourly earnings rose 0.3% m/m, but the y/y rate continued to trend down, sliding to 3.1%, the lowest since May 2021.
by:Sandy Batten
|in:Economy in Brief
- of161Go to 1 page