U.S. Producer Prices Boosted by Rebound in Energy Prices in August
by:Sandy Batten
|in:Economy in Brief
Summary
- The PPI increased 0.4% m/m (5.4% y/y) in August, in line with expectations, reflecting a 4.2% m/m rebound in energy prices.
- The core PPI rose 0.3% m/m (4.7% y/y).
- Final demand goods prices jumped 1.1% m/m, largely due to higher energy prices, following a 0.4% m/m decline in July.
- Final demand services prices edged up 0.1% m/m in August, the slowest monthly gain in three months.
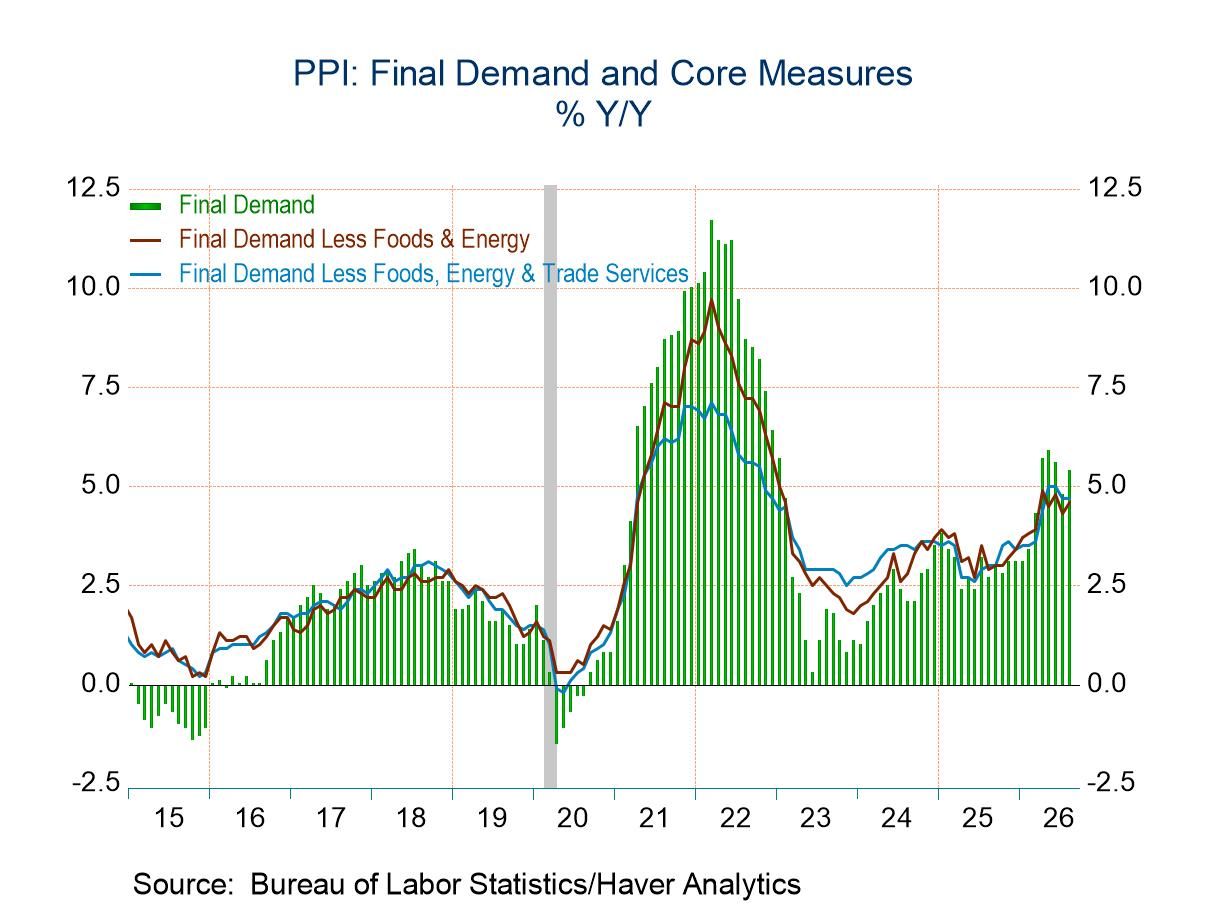
The Producer Price Index for final demand increased 0.4% m/m (5.4% y/y) in August following an upwardly revised 0.1% monthly gain in July (previously unchanged), according to the Bureau of Labor Statistics (BLS). The Action Economic Forecast Survey expected a 0.4% m/m increase in August. Producer prices excluding food, energy & trade services (the new core index) rose 0.3% m/m (4.7% y/y) after rising an unrevised 0.4% m/m in July. The PPI excluding food and energy (the previous core index) increased 0.2% m/m (4.6% y/y) versus an upwardly revised 0.3% monthly gain in July (previously 0.2% m/m). A 0.3% m/m increase was expected for August.
Financial markets have placed a great deal of emphasis on today’s PPI report and tomorrow’s CPI report in forming expectations for the outcome of next week’s FOMC meeting. Today’s PPI report showed a slight pickup in inflation due mostly to a rebound in energy prices, but this was generally as expected. So, today’s report is not likely to have very much influence on expectations for next week’s FOMC meeting. The fed funds futures market is currently pricing in a 70% probability of a 25bps rate hike next week versus 64% just before the PPI report.
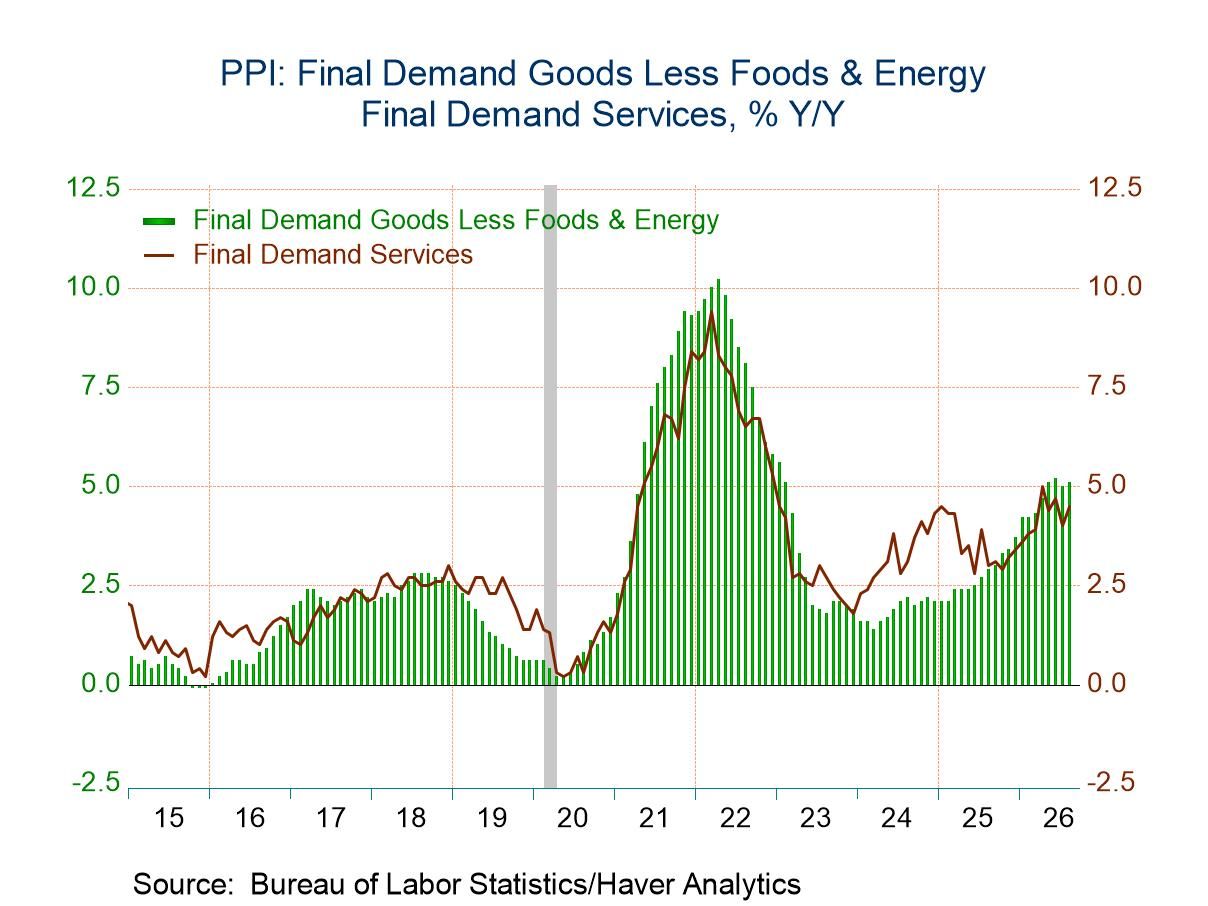
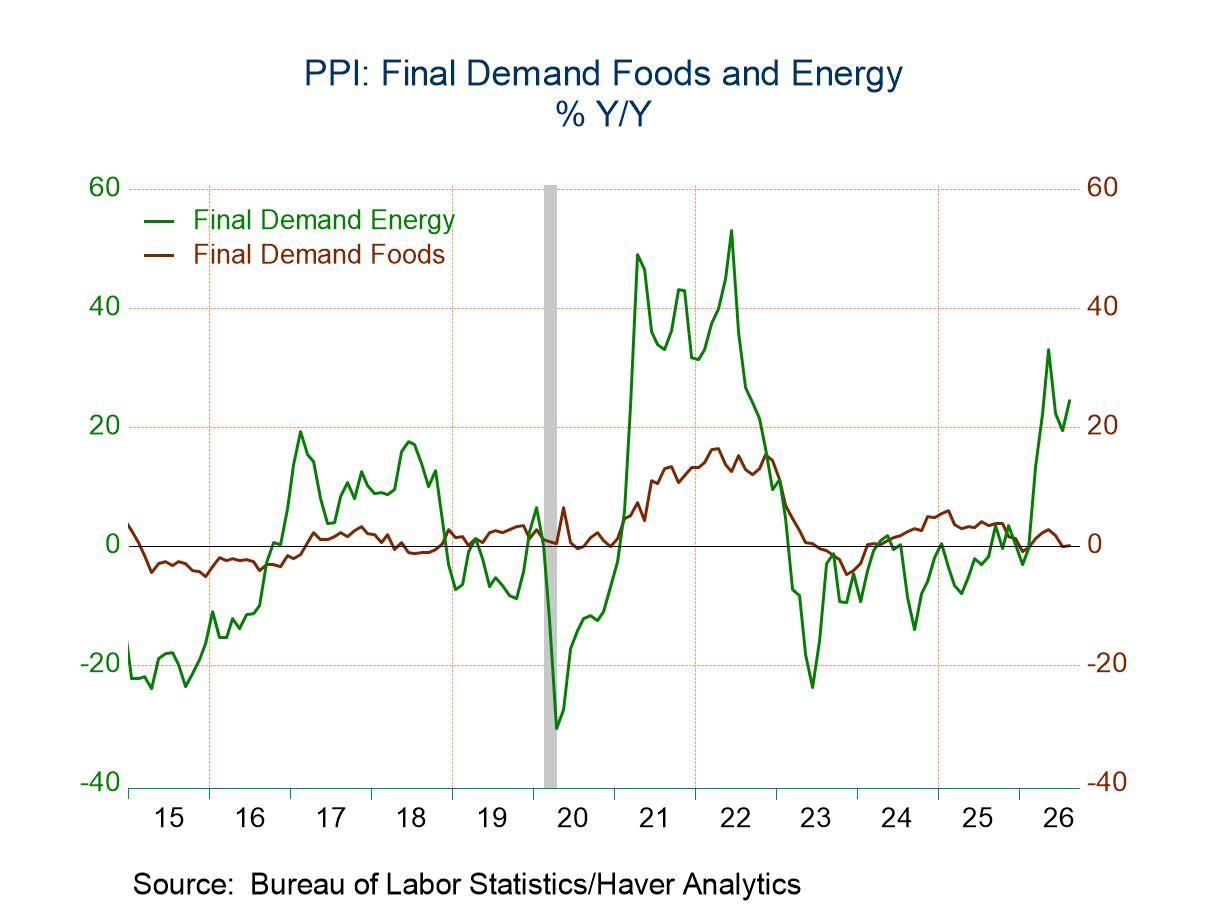
The index for final demand goods advanced 1.1% m/m (7.7% y/y) in August following two consecutive decreases. Over three-fourths of the broad-based monthly rise can be attributed to prices for final demand energy, which jumped 4.2% m/m after having declined in both June and July. The index for final demand goods less foods and energy increased 0.4% m/m (5.1% y/y) while the index for final demand foods increased 0.1% m/m (0.1% y/y), its first monthly gain in three months. Over a third of the August increase in the index for final demand goods can be traced to prices for diesel fuel, which jumped 24.1% m/m. Prices for gasoline, jet fuel and home heating oil also rose. In contrast, prices for residential electric power fell 0.5% m/m in August.
The index for final demand services edged up 0.1% m/m (45% y/y) in August, the third consecutive increase. The August advance can be attributed largely to a 2.3% m/m jump rise in prices for final demand transportation and warehousing services. In contrast, the index for final demand trade services fell 0.2% m/m (+4.5% y/y) in August, the third monthly decline in the past four months. Prices for final demand services less trade, transportation, and warehousing were unchanged in August from July (+3.5% y/y). Leading the August increase in the index for final demand services, prices for truck transportation of freight advanced 2.0% m/m, the first monthly increase in three months and a reflection of the surge in the price of diesel fuel in August. The indexes for airline passenger services, legal services, hospital inpatient care, and automobiles retailing also rose. In contrast, margins for fuels and lubricants retailing decreased 11.3% m/m.
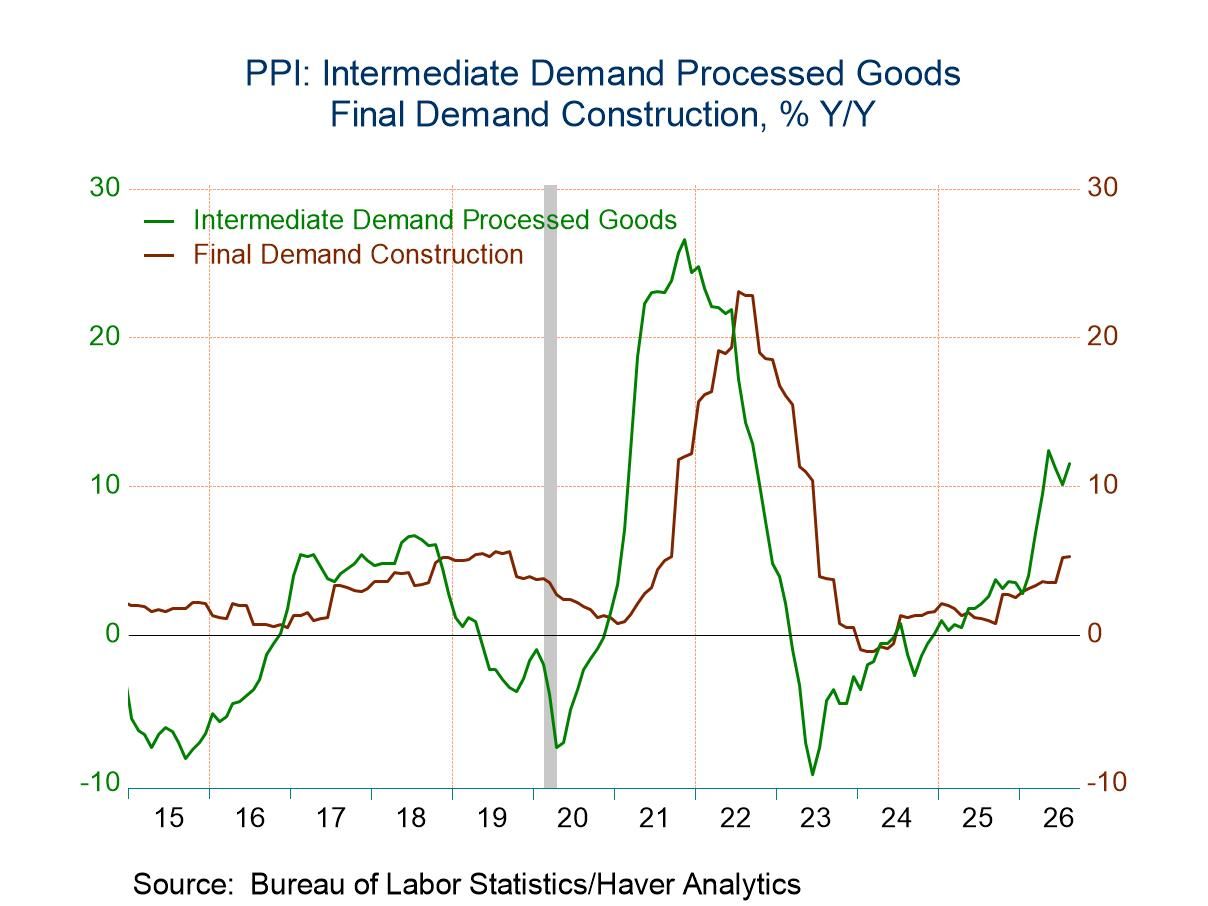
Construction costs were unchanged in August from July (+5.3% y/y) following a 2.2% monthly jump in July.
Prices for intermediate demand for processed goods jumped 1.8% m/m (11.5%) in August after declines in each of the previous two months. The August rebound again was due largely to a 7.3% monthly surge in energy prices. Processed foods prices fell 0.1% m/m while prices of processed goods less foods and energy rose 0.5% m/m.
The PPI data are published by the Bureau of Labor Statistics and can be found in Haver’s USECON database. Further detail is contained in PPI and PPIR. The expectations figures are available in the AS1REPNA database.

Sandy Batten
AuthorMore in Author Profile »Sandy Batten has more than 30 years of experience analyzing industrial economies and financial markets and a wide range of experience across the financial services sector, government, and academia. Before joining Haver Analytics, Sandy was a Vice President and Senior Economist at Citibank; Senior Credit Market Analyst at CDC Investment Management, Managing Director at Bear Stearns, and Executive Director at JPMorgan. In 2008, Sandy was named the most accurate US forecaster by the National Association for Business Economics. He is a member of the New York Forecasters Club, NABE, and the American Economic Association. Prior to his time in the financial services sector, Sandy was a Research Officer at the Federal Reserve Bank of St. Louis, Senior Staff Economist on the President’s Council of Economic Advisors, Deputy Assistant Secretary for Economic Policy at the US Treasury, and Economist at the International Monetary Fund. Sandy has taught economics at St. Louis University, Denison University, and Muskingun College. He has published numerous peer-reviewed articles in a wide range of academic publications. He has a B.A. in economics from the University of Richmond and a M.A. and Ph.D. in economics from The Ohio State University.
More Economy in Brief
 Asia
Asia