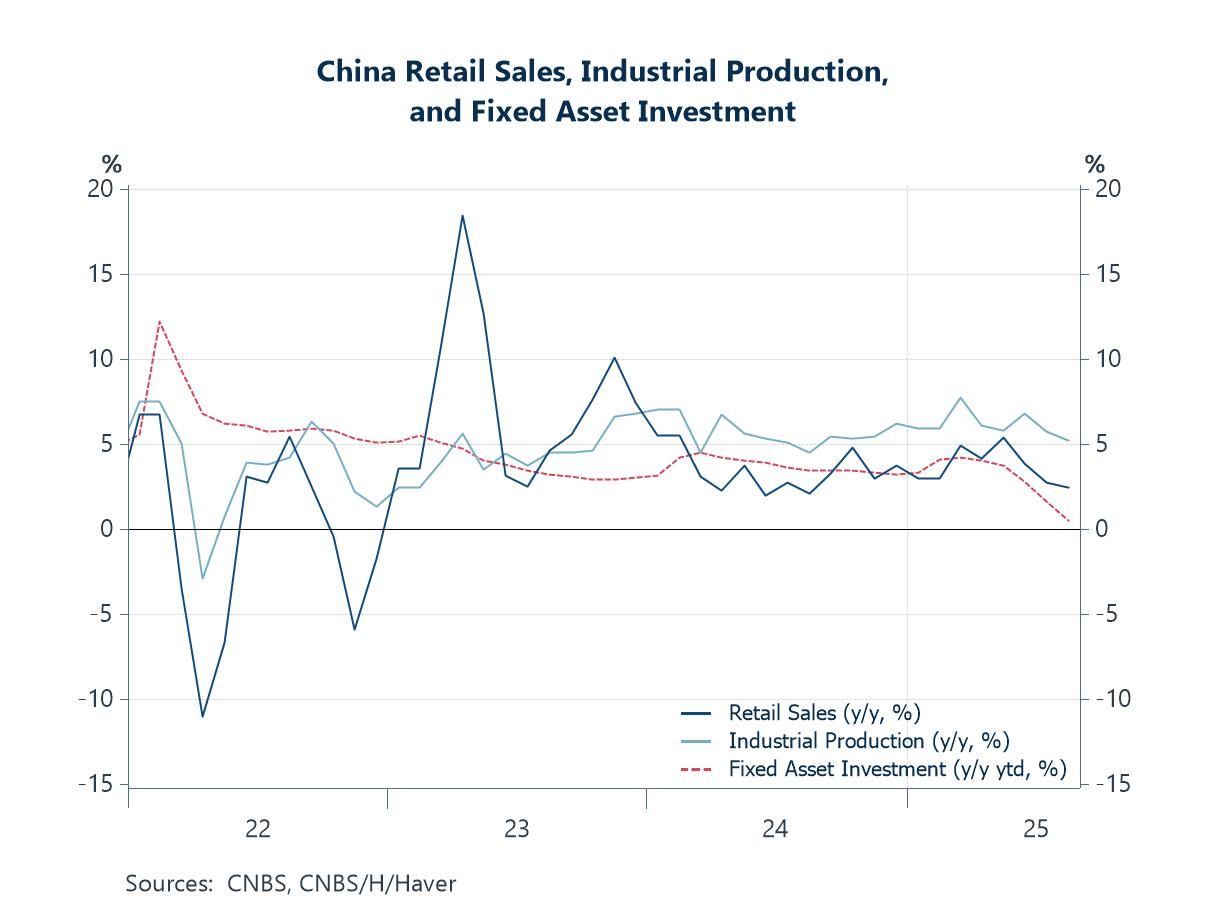
Haver Analytics
Haver Analytics

Economy in Brief: September 2025

  • This week, we examine a broad set of key developments, from China’s disappointing August data and structural economic challenges to a flurry of central bank decisions across Japan, Taiwan, and Indonesia. China’s latest data disappointed again, reinforcing concerns that US trade tariffs are starting to bite as the front-loading boost fades (chart 1). More broadly, China continues to struggle with its transition toward a more consumption-driven economy (chart 2). Recent figures show little sign of this pivot, with trade remaining resilient while consumption still lags.

    In Japan, the Bank of Japan (BoJ) will decide on interest rates during a central bank-heavy week, following key decisions from the Fed and the Bank of England (chart 3). The BoJ is widely expected to hold its policy rate steady for now as the country navigates a period of political uncertainty after Prime Minister Ishiba’s recent resignation. Still, there has been some good news: the Cabinet Office estimates that Japan’s output gap turned positive for the first time in two years, although figures differ across methods and sources (chart 4).

    Turning to Taiwan, uncertainty remains in the semiconductor sector as US tariffs loom. However, major Taiwanese producers’ substantial US investments may position them for exemptions (chart 5). Finally, in Indonesia, Bank Indonesia’s policy decision is also due this week on Wednesday. While the door to monetary easing remains open, the timing of any move is unclear. Meanwhile, Indonesian asset prices fell again after the removal of one of its long-serving Finance Ministers (chart 6), with her successor’s plans raising renewed concerns about fiscal discipline.

    China China’s latest monthly data releases disappointed again, showing a further slowdown in growth. This has strengthened investor concerns that US trade tariffs are finally starting to weigh on the economy as earlier front-loading effects fade. Year-on-year growth in retail sales and industrial production fell to their lowest levels in about a year, while fixed asset investment was nearly flat (chart 1). Property prices also extended their multi-year decline. In response to the weakening outlook, calls for additional policy support have grown, though several measures have already been announced. For instance, domestic consumption may get another boost as the government’s new personal consumer loan interest rate subsidy program takes effect this month. If realized, this would follow the one-off lift from the earlier durable goods subsidy program.

    • First negative reading logged in three months.
    • New orders & employment decline.
    • Prices paid & received weaken.
    • Six-month outlook ahead dims.
  • In the wake of U.S. tariff implementation, we, of course, look for evidence of the impact of that action on global trade performance. In the July trade report for the EMU, there is little direct evidence of a draconian impact on trade in the EMU that coincides with changes in U.S. trade policy. Of course, the EMU picture is of the external trade of that community with the world and not just the United States. But such dire predictions had been made of the impact of U.S. tariff policy that it is very worthwhile to note that such cataclysm has not appeared. Has there been some trade impact? Certainly! Has there been some increases in uncertainty? Yes. But nothing has brought global trade to a screeching halt. In fact, the Baltic Dry goods index shows a rise in trade volumes since early 2025. The current level is comparable to or higher than 2024 and last persistently stronger in 2022.

    The euro area trade surplus at 5.3bln euros is higher in July than in June but is much weaker than its 3-month, 6-month, and 12-month averages. In round numbers, the 3-month average is €8bln, the 6-month average is €15bln and the 12-month average is €13bln. So, July runs at less than half the pace of the 12-month average. That may be evidence of U.S. tariff impact.

    The overall balance sees disproportionately large-looking effect because it is smaller…smaller than what? Well, the manufacturing surplus is at 27bln euros in July, up by 3bln euros from June, about 3bln euros below the 3-month average of 30bln euros and about 8bln euros below the 12-month average. An eight billion drop on a level of 35bln seems smaller than and eight billion euro drop on 13 bln…but eight billion euros are eight billion euros- but that is only 2.2% of total exports. How we view relativity is important. Is that the draconian U.S. tariff impact?

    The nonmanufacturing deficit in the EMU is almost unchanged by month or on any average (at minus 22bln euros).

    Growth rates for manufacturing exports show contraction and a worsening trend from 12-months to 6-months to 3-months. This is not so for nonmanufacturing exports that log a strong double-digit rise over three months. EMU manufacturing imports show very steady slow growth with modest decay… not so for nonmanufacturing imports that log strong double-digit gains over three months.

    Country level trends By country, German exports show growth rate erosion, French exports show acceleration, Italy shows a slowdown but at a still-strong double-digit pace for three months. Finland, Portugal, and Belgium show exports in a state of decline or weakness- mostly decline. The United Kingdom, not an EU member, shows an erratic trend but with 3-month export growth in double digits. There is some export weakness here to be sure but nothing that looks very severe.

    On the import side, German imports melt down to a 3-month low annualized pace of +0.1%. French imports speed up to a 6.6% pace over 3 months. The U.K. looks at positive- if irregular- import growth.

    • Home prices & mortgage rates slip.
    • Median income edges higher.
    • Affordability increases across country.
  • Financial markets have spent the week recalibrating after last Friday’s much weaker-than-expected US payrolls data: government bond yields have declined sharply, while equity markets have remained perky off hopes of a gentler policy path and still-resilient earnings. Even so, the medium-term growth lens has dimmed—since January, consensus GDP forecasts for 2026 have been marked down across most major economies, reflecting a tougher trade regime and geopolitical frictions (chart 1). Turning to the data, the BLS’s preliminary payroll benchmark revision shaved 911k jobs from US employment from April 2024 to March 2025, confirming the idea of a broader cooling in hiring (chart 2). Within that softer backdrop, the composition of job creation has tilted further toward healthcare and social care - not just in the US - supporting headcount but possibly diluting aggregate productivity (chart 3). Elsewhere, China’s latest trade print highlighted a continued rotation of exports away from the US toward other Asian economies (chart 4). On vulnerabilities, France’s private-sector debt leverage—well above peers—underscores that crises more often spring from private balance sheets than sovereign ones (chart 5). And, finally, fears that new US tariffs would reignite supply-chain pressures continue to look overstated, at least for now (chart 6).

    • Energy & food prices strengthen.
    • Core inflation steadies.
    • Core goods gain increases but core services inflation eases.
    • Monthly deficit is well above expectations.
    • Revenues rise moderately while outlays surge.
    • Deficit increases in first eleven months of FY’25.
    • Initial claims jumped 27,000 in latest week containing the Labor Day Weekend.
    • Continuing claims were unchanged.
    • Insured unemployment rate holds steady.