 Global| Sep 11 2025
Charts of the Week: Labouring the Point
by:Andrew Cates
|in:Economy in Brief
Summary
Financial markets have spent the week recalibrating after last Friday’s much weaker-than-expected US payrolls data: government bond yields have declined sharply, while equity markets have remained perky off hopes of a gentler policy path and still-resilient earnings. Even so, the medium-term growth lens has dimmed—since January, consensus GDP forecasts for 2026 have been marked down across most major economies, reflecting a tougher trade regime and geopolitical frictions (chart 1). Turning to the data, the BLS’s preliminary payroll benchmark revision shaved 911k jobs from US employment from April 2024 to March 2025, confirming the idea of a broader cooling in hiring (chart 2). Within that softer backdrop, the composition of job creation has tilted further toward healthcare and social care - not just in the US - supporting headcount but possibly diluting aggregate productivity (chart 3). Elsewhere, China’s latest trade print highlighted a continued rotation of exports away from the US toward other Asian economies (chart 4). On vulnerabilities, France’s private-sector debt leverage—well above peers—underscores that crises more often spring from private balance sheets than sovereign ones (chart 5). And, finally, fears that new US tariffs would reignite supply-chain pressures continue to look overstated, at least for now (chart 6).
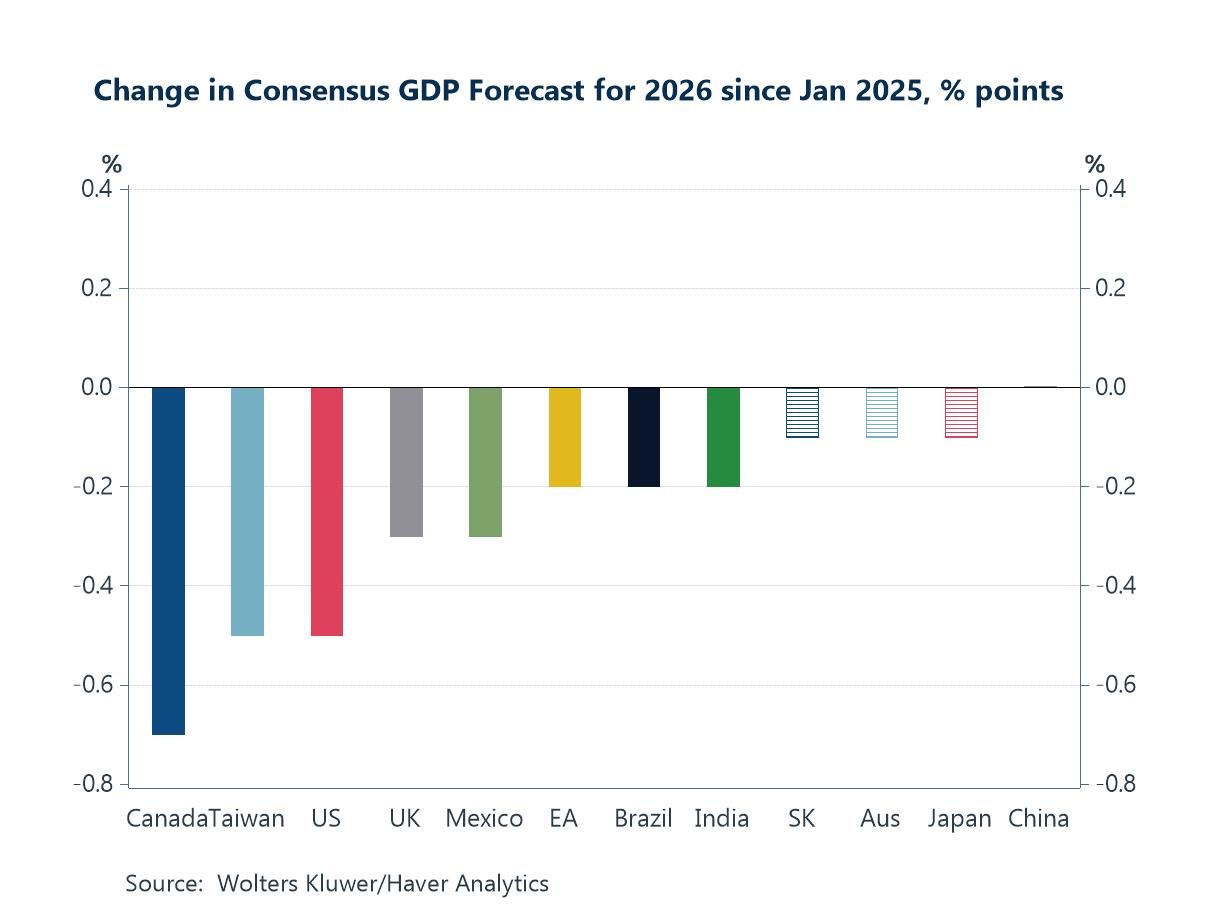
The Blue Chip Growth Consensus Consensus growth expectations for 2026 have been marked down across most major economies since January, and the chart shows how broad-based the rethink has become. The steepest downgrades have been made to Canada, Taiwan, and the US, while China is little changed. The common thread is a tougher trade environment shaped by the expanded US tariff regime. Those pressures are being compounded by wider global constraints—geopolitical instability, lingering investment-screening and export-control frictions, and a still-elevated cost of capital.
Chart 1: The Blue Chip Growth Consensus: Changes in GDP forecasts for 2026 since Jan 2025
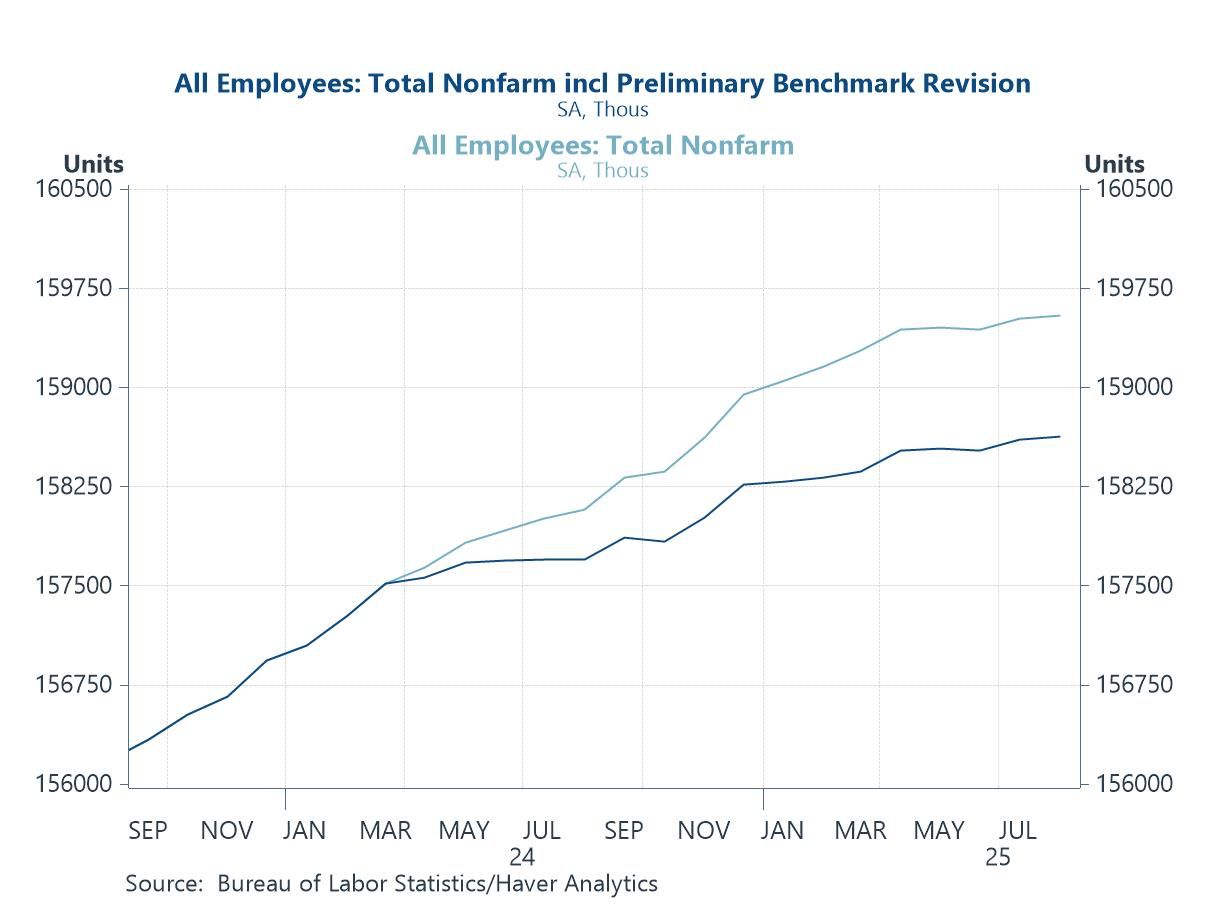
US payroll revisions Consistent with that thinner 2026 outlook, fresh BLS payroll benchmarks now indicate a materially cooler US jobs backdrop. BLS’s preliminary benchmark revision—which aligns the monthly payroll survey to unemployment-insurance tax records—marked US nonfarm employment down by 911,000 jobs (-0.6%) in the year to March 2025, pointing to a materially softer hiring backdrop than previously believed. This has been flagged as the largest preliminary downgrade on record, with the biggest cuts concentrated in trade (retail/wholesale), leisure & hospitality, professional & business services, and manufacturing, while government saw only a minor trim. As the chart below shows, the revised series (dark line) now tracks noticeably below the previously published path (light line) from late-2024 onward, implying slower momentum through mid-2025. The BLS stresses this is preliminary—based on QCEW administrative data—with final benchmarking due with the 2026 annual update, but the signal adds to the softer tone from recent payroll reports. Markets and forecasters are treating the revision as confirmation that job growth had cooled earlier and more broadly than the headline prints had suggested.
Chart 2: US non-farm employment levels – before and after benchmark revisions
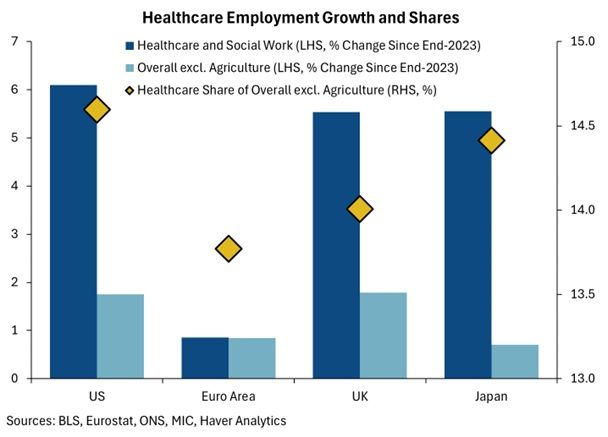
Healthcare employment Even with the payroll benchmark revision pointing to a softer hiring backdrop, one engine kept humming: healthcare. The question, then, isn’t just how many jobs were added—it’s where they came from. As the chart shows, employment growth across many advanced economies has been disproportionately concentrated in healthcare and social care. Since end-2023, the sector has surged by roughly 5%–6% in the US, UK, and Japan—three to four times the pace of overall employment—pushing healthcare’s share of total jobs toward 14%–15% (gold diamonds in chart). The euro area is the notable laggard, with more muted gains in both healthcare and aggregate payrolls. Demographics are arguably the main culprit: ageing populations, post-pandemic treatment backlogs, and rising long-term-care needs continue to ratchet up demand for staff. But composition matters: healthcare tends to have lower measured productivity and limited tradability, so its growing weight props up headline employment while diluting aggregate productivity growth and tightening fiscal space (given the sector’s heavy public funding and regulation). In short, the resilience of headline jobs is increasingly a healthcare story, even as cyclical, tradable sectors remain softer.
Chart 3: Employment growth in healthcare in major advanced economies
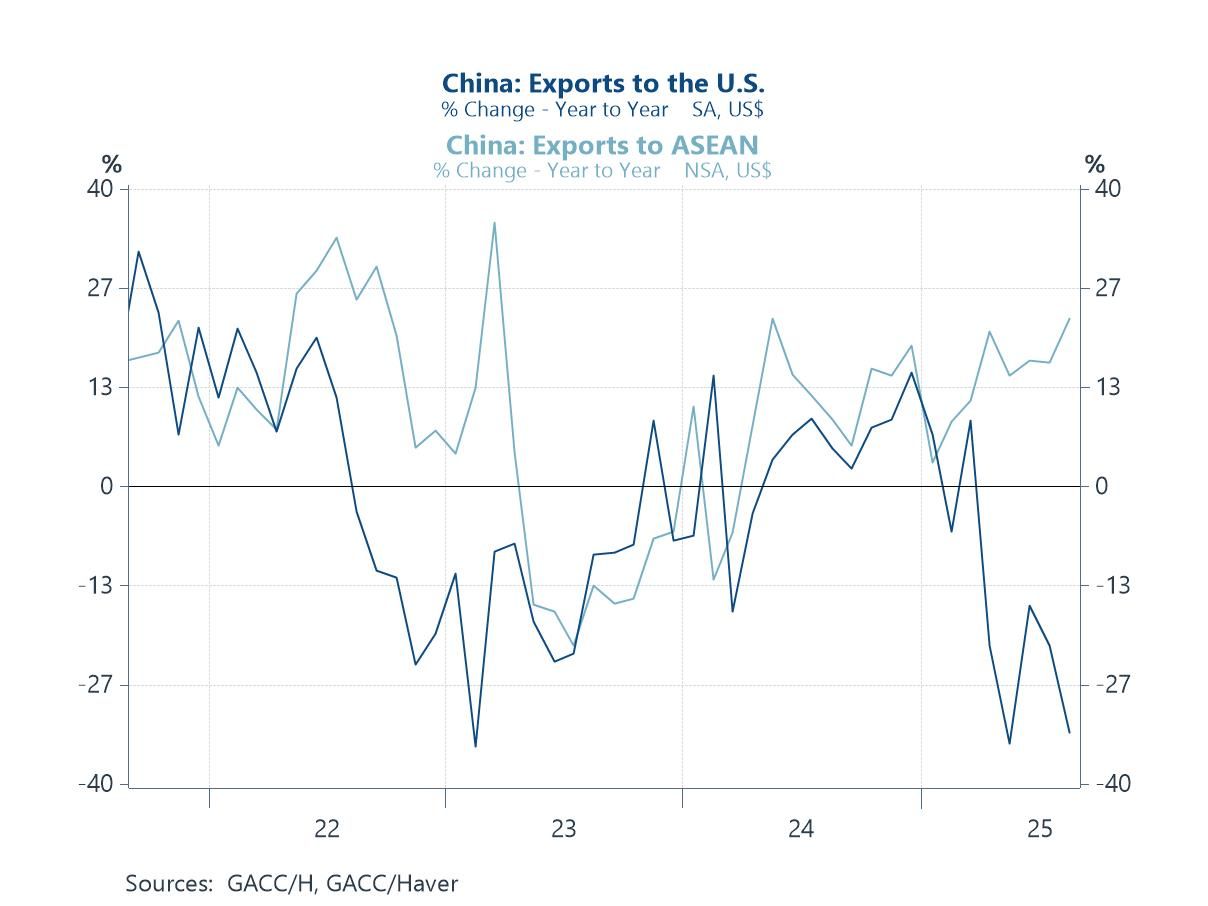
China’s trade China’s August trade print reinforced the divergence in its export map—weakness to the US, strength to ASEAN. Headline exports rose 4.4% y/y in dollar terms (slowest in six months) while imports edged up by 1.5%, leaving a hefty $102bn surplus. But beneath the top line, shipments to the US plunged 33% y/y, whereas exports to ASEAN jumped 22.5% y/y. Accompanying commentary tied the split to fading support from the brief US tariff “truce,” the drag from new and prospective duties, and Beijing’s push to deepen ASEAN ties—including an accelerated upgrade to the China-ASEAN FTA—as firms re-route supply chains and sales toward the region. The message for global demand: China’s export engine is still running, but is being rebalanced toward ASEAN and away from the US, with the composition shift muting the impulse to US manufacturing while supporting Southeast Asia’s role in Chinese supply networks.
Chart 4: China’s export growth to the US and the ASEAN economies
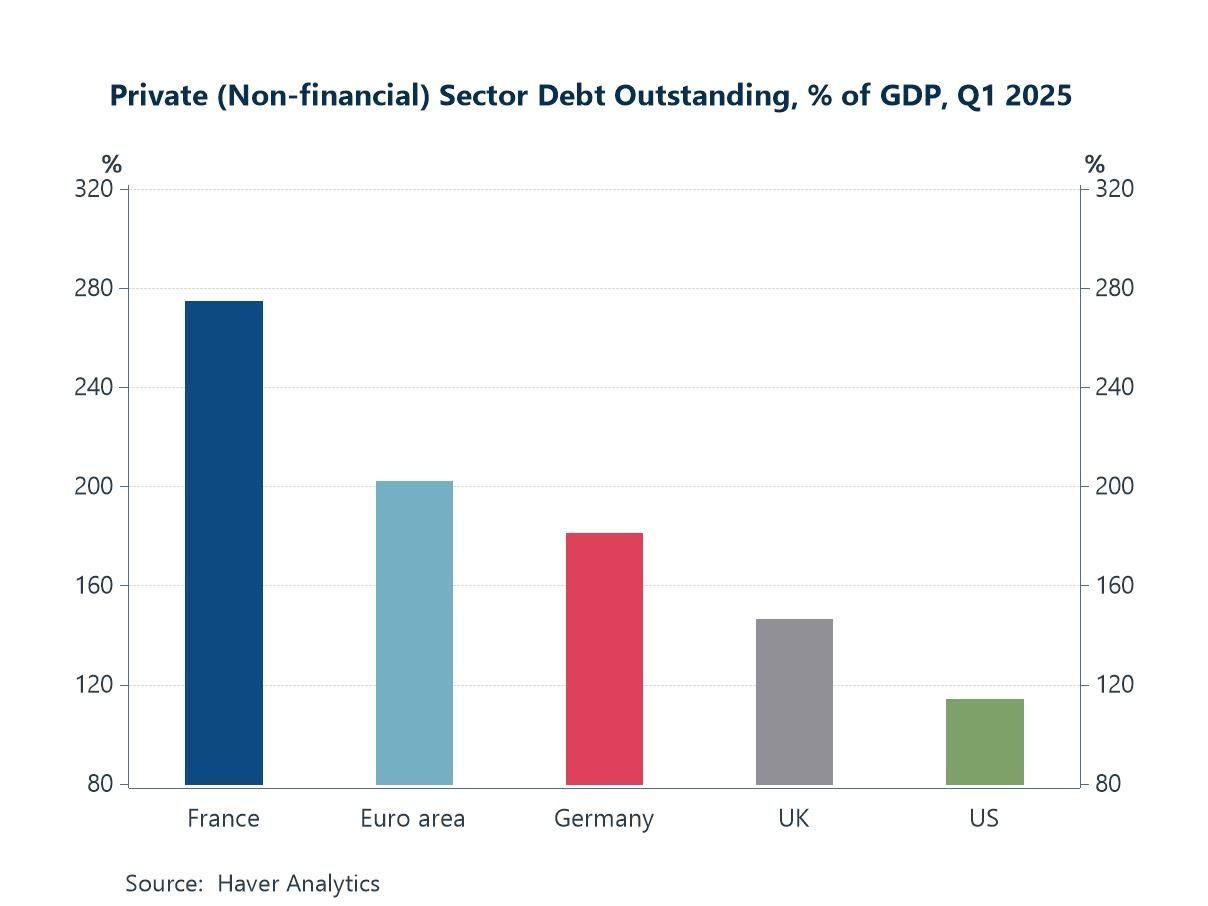
Private sector indebtedness While financial markets often tend to fixate on public debt when judging national solvency—via spreads, ratings chatter, and rising bond yields—the historical trigger for many financial crises is excessive private-sector leverage (households and non-financial corporates) colliding with tighter credit. The chart underscores why France merits heightened attention right now: its private non-financial debt stock sits well above peers—near 280% of GDP—far higher than the euro-area average (~200%), Germany (~180%), the UK (~150%) and the US (~115%). With France also navigating fresh political instability this week, the vulnerability channel to watch is less the sovereign’s flow deficit and more the balance-sheet sensitivity of firms and households to weaker growth and refinancing needs in a bank-centric system. By contrast, the UK and US enter with lower private leverage (and, in the US, deeper market-based intermediation), implying a smaller amplification risk even if gilts or Treasuries cheapen.
Chart 5: Private sector debt levels (relative to GDP) in major advanced economies
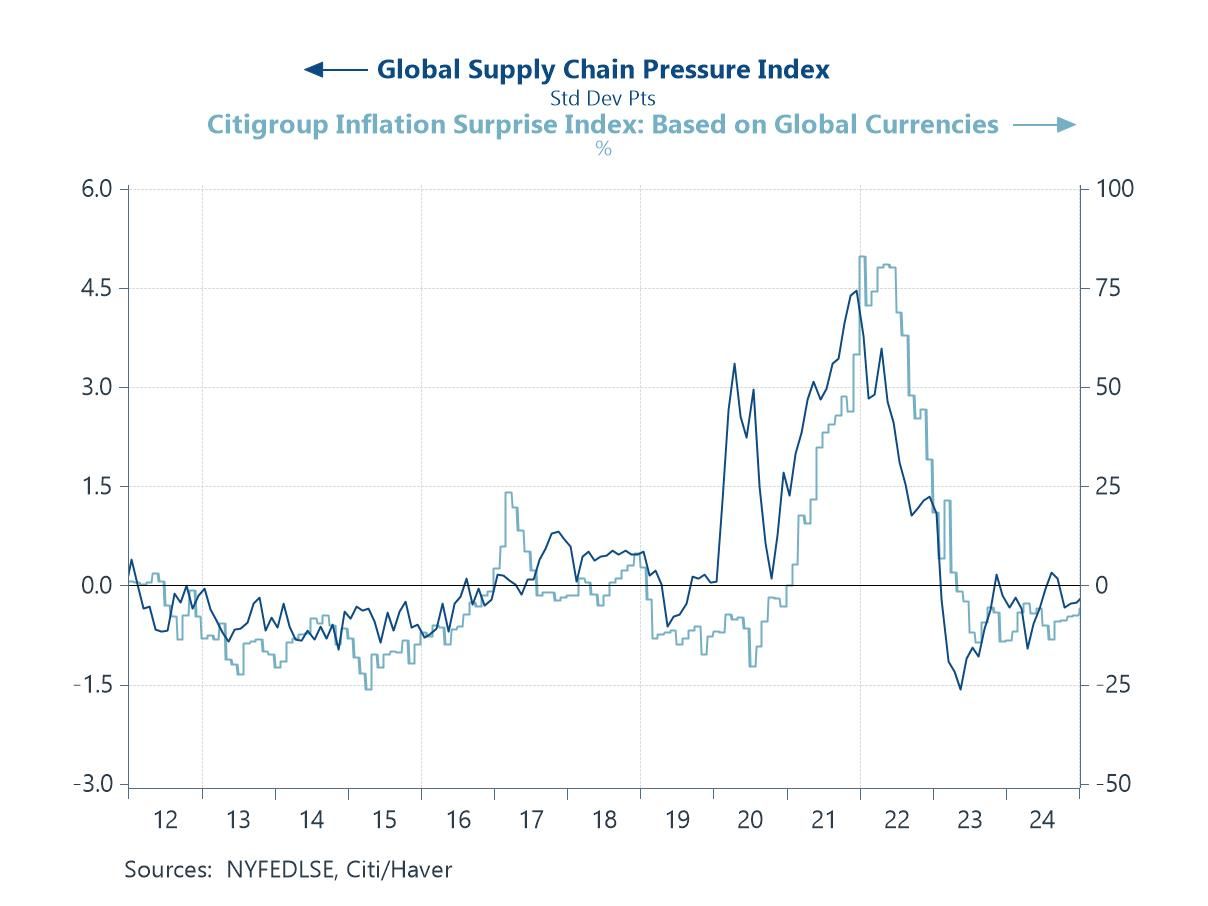
Global supply chain pressures Pivoting from balance-sheet risks to the flow side of inflation, the much-feared tariff-driven squeeze on supply chains hasn’t materialised. In the run-up to, and after, recent US tariff packages—covering Chinese EVs, batteries, solar inputs and broader manufacturing goods—commentators warned of renewed bottlenecks, costly re-routing via third countries, longer lead times, and a fresh wave of “landed-cost” inflation. The chart suggests otherwise. The NY Fed’s Global Supply Chain Pressure Index (dark line) remains close to zero, back at pre-pandemic norms despite those policy shocks, while Citi’s Global Inflation Surprise Index (light line) hovers around/below zero, indicating price data are no longer consistently overshooting forecasts. In short, tariff headlines haven’t yet translated into broad supply stress: logistics capacity appears ample and pass-through contained. Risks remain—energy spikes, shipping disruptions, or a wider tariff net—but for now the supply-side impulse to inflation looks neutral, not acute.
Chart 6: Global supply chain pressures versus global inflation surprises

Andrew Cates
AuthorMore in Author Profile »Andy Cates joined Haver Analytics as a Senior Economist in 2020. Andy has more than 25 years of experience forecasting the global economic outlook and in assessing the implications for policy settings and financial markets. He has held various senior positions in London in a number of Investment Banks including as Head of Developed Markets Economics at Nomura and as Chief Eurozone Economist at RBS. These followed a spell of 21 years as Senior International Economist at UBS, 5 of which were spent in Singapore. Prior to his time in financial services Andy was a UK economist at HM Treasury in London holding positions in the domestic forecasting and macroeconomic modelling units. He has a BA in Economics from the University of York and an MSc in Economics and Econometrics from the University of Southampton.
More Economy in Brief


