 Global| Oct 23 2025
Charts of the Week: Risks and Relief
by:Andrew Cates
|in:Economy in Brief
Summary
Financial markets have been caught between conflicting crosscurrents in recent days. On the one hand, risk sentiment has been weighed down by mounting concerns over US lenders and broader credit conditions, renewed tariff worries, the ongoing government shutdown, and growing unease about a potential AI-driven valuation bubble (chart 1). On the other, expectations have strengthened that major central banks will continue to ease policy in the face of softer growth and moderating inflation, fueling hopes of a soft landing (chart 2). Supporting that view, oil prices have declined off easing geopolitical tensions in the Middle East (chart 3), and China’s credit impulse—together with stronger-than-expected GDP—has provided a quiet but important lift to global growth momentum (chart 4), even if property market weakness persists. US wage growth also continues to cool according to some private sector surveys (chart 5), helping to ease inflation concerns, while in the UK, softer headline inflation has been welcomed, though sticky services CPI and rising producer prices have tempered the good news (chart 6). Taken together, the macro narrative is one of lingering risks offset by moderating inflation pressures and easing hopes—an uneasy equilibrium that has left financial markets more volatile but still resilient.
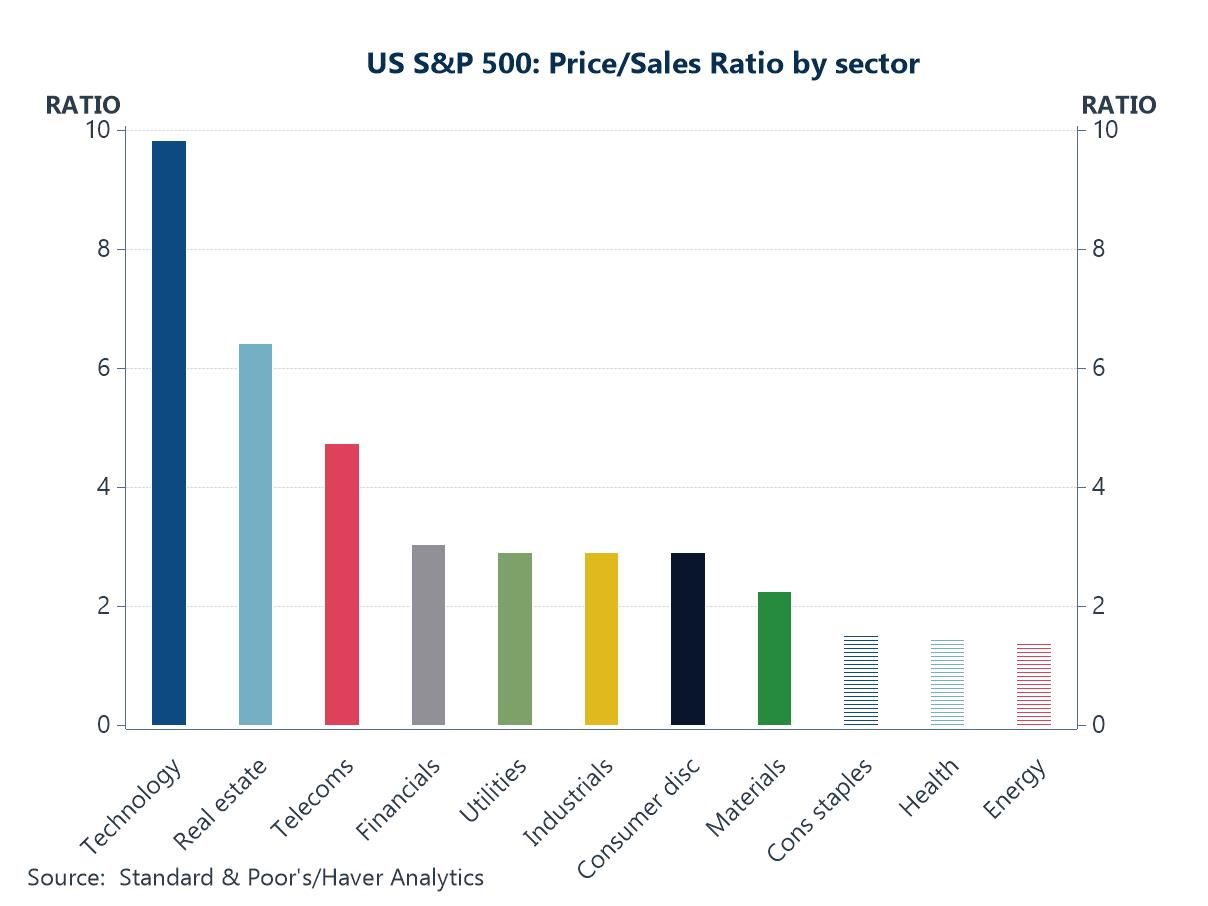
AI bubble concerns Valuation concerns around AI-related stocks have intensified in recent weeks, and this chart provides some clear context for why. The Technology sector is trading at a price-to-sales ratio of nearly 10 — far higher than any other sector in the S&P 500 — and well above its own historical averages. By contrast, sectors such as Energy, Health, and Consumer Staples are clustered around a far more modest ratio of 1–2. This extreme dispersion highlights how much investor optimism — or speculation — has concentrated in technology and AI-linked companies. For many in financial markets, this pattern echoes previous episodes of overvaluation, raising fears that the current AI enthusiasm may be starting to resemble bubble dynamics rather than simply reflecting future earnings potential.
Chart 1: The US S&P 500 index: Price/Sales Ratios By Sector in 2025 Q3
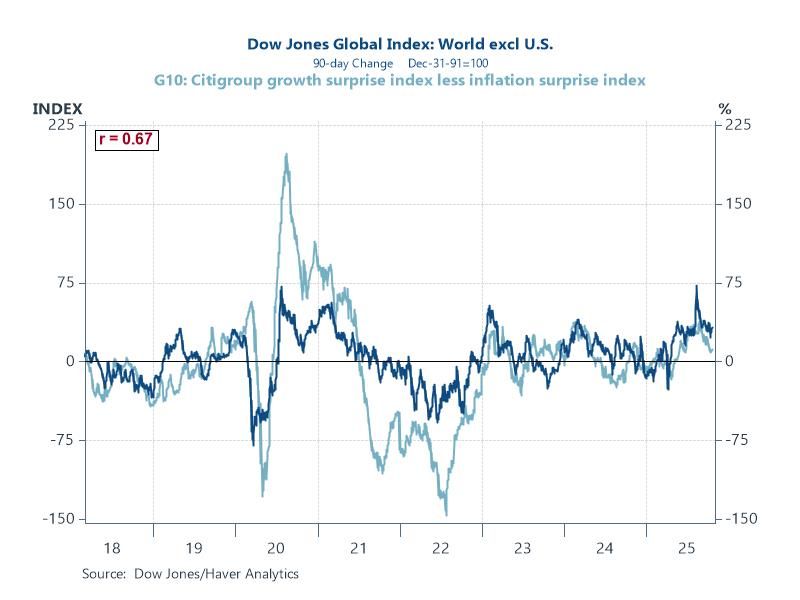
Non-US equity markets and macro data surprises By contrast, outside the US the picture looks more old-fashioned: equity swings have hugged the macro tape. The Dow Jones Global ex-US index’s 90-day moves track closely with the G10 “growth surprise minus inflation surprise” gauge. When growth data beat expectations, ex-US markets tend to rise; when inflation surprises on the upside, they falter. That pattern implies fundamentals—not narrative—have been doing the heavy lifting abroad, with macro impulses (real activity up, inflation pressure down) explaining far more of the equity gyrations than theme-driven factors.
Chart 2: The Dow Jones Global (ex US) index versus global growth and inflation surprises
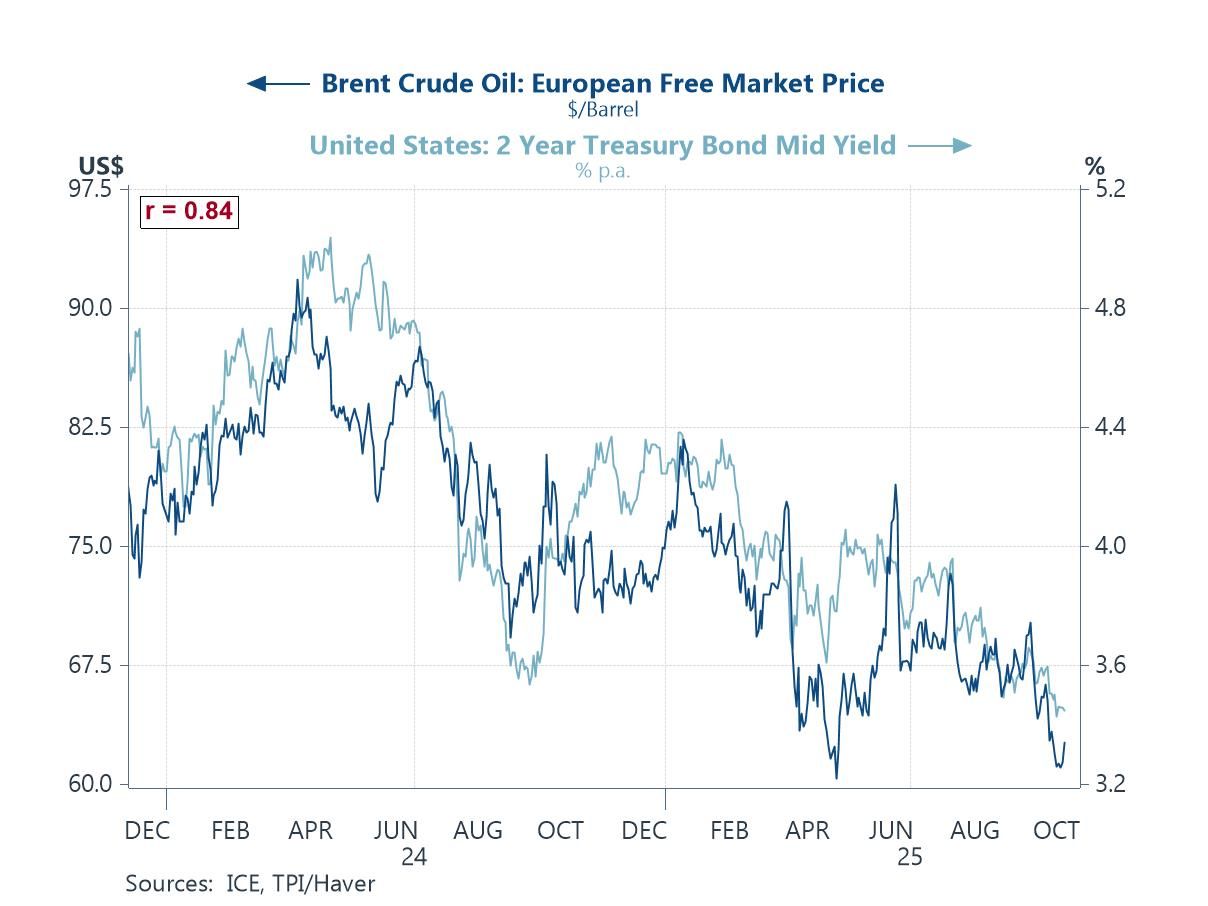
Oil prices and interest rates One often overlooked reason for why the global economy has out-performed expectations in recent months concerns oil prices. Brent crude has drifted lower for much of the past year, and the chart below shows it moving broadly in step with the decline in US 2-year yield. Cheaper crude acts like a tax cut for consumers and energy-intensive firms, easing headline inflation and cushioning real incomes just as tariff noise has picked up. The softer energy bill has also reduced second-round cost pressures, helping inflation cool without a collapse in demand. In short, calmer oil prices have quietly underwritten the “soft-landing” mix: steadier growth with disinflation, and a bit more room for central banks to ease.
Chart 3: Brent crude oil price versus US 2-year Treasury yields
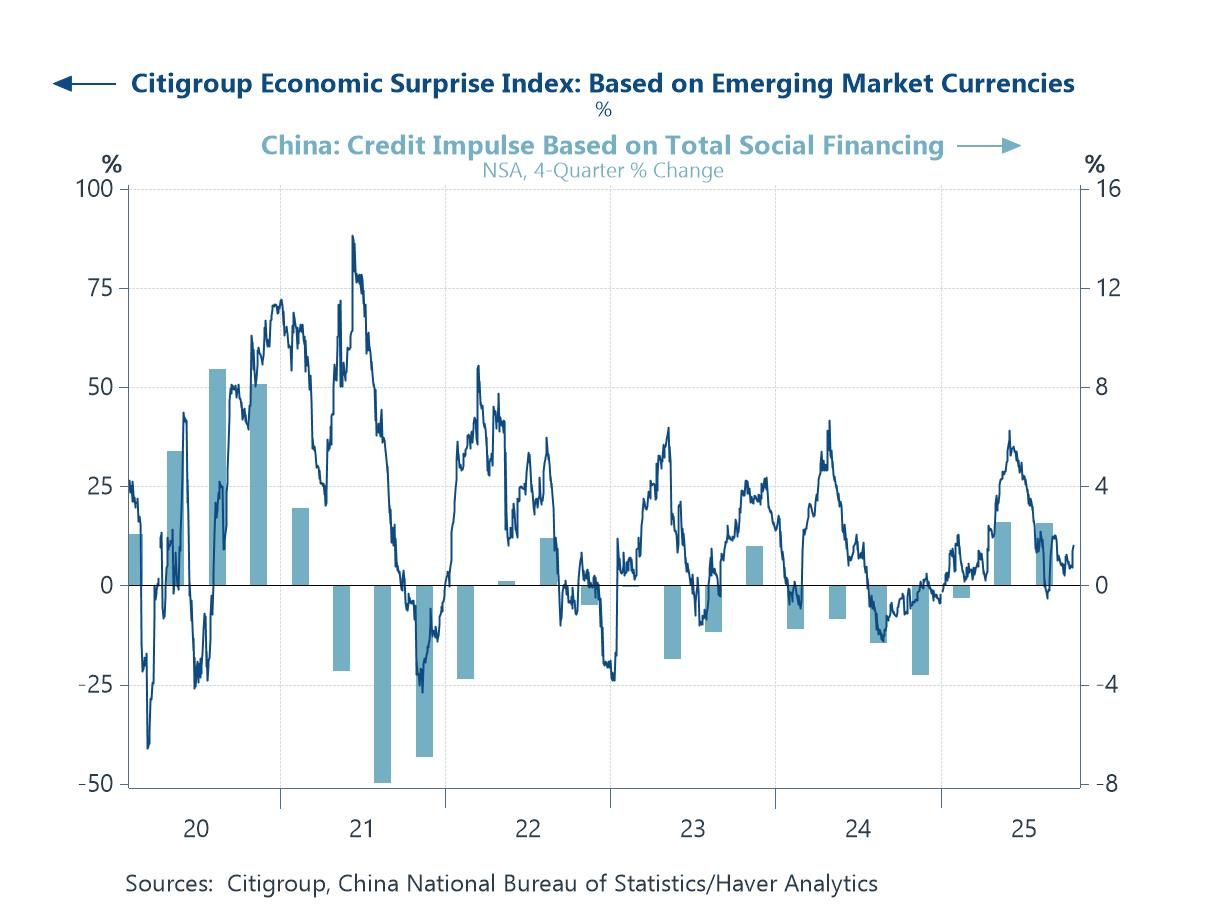
China’s credit growth Another overlooked prop for global growth has been China’s quiet turn in credit. The next chart shows a modest but clear positive credit impulse (the change in the flow of China’s social financing), which—alongside this week’s Q3 GDP upside surprise—has arguably given a lift to sentiment on global growth. As Beijing eased financing constraints and nudged bank lending and bond issuance higher, Citigroup’s EM-weighted economic surprise index has also moved back into positive territory. That said, the impact has been uneven. The credit surge has done little so far to revive China’s ailing property market, which remains a key drag on domestic demand and a key source of uncertainty for the global economic outlook.
Chart 4: China’s credit impulse versus emerging market growth surprises
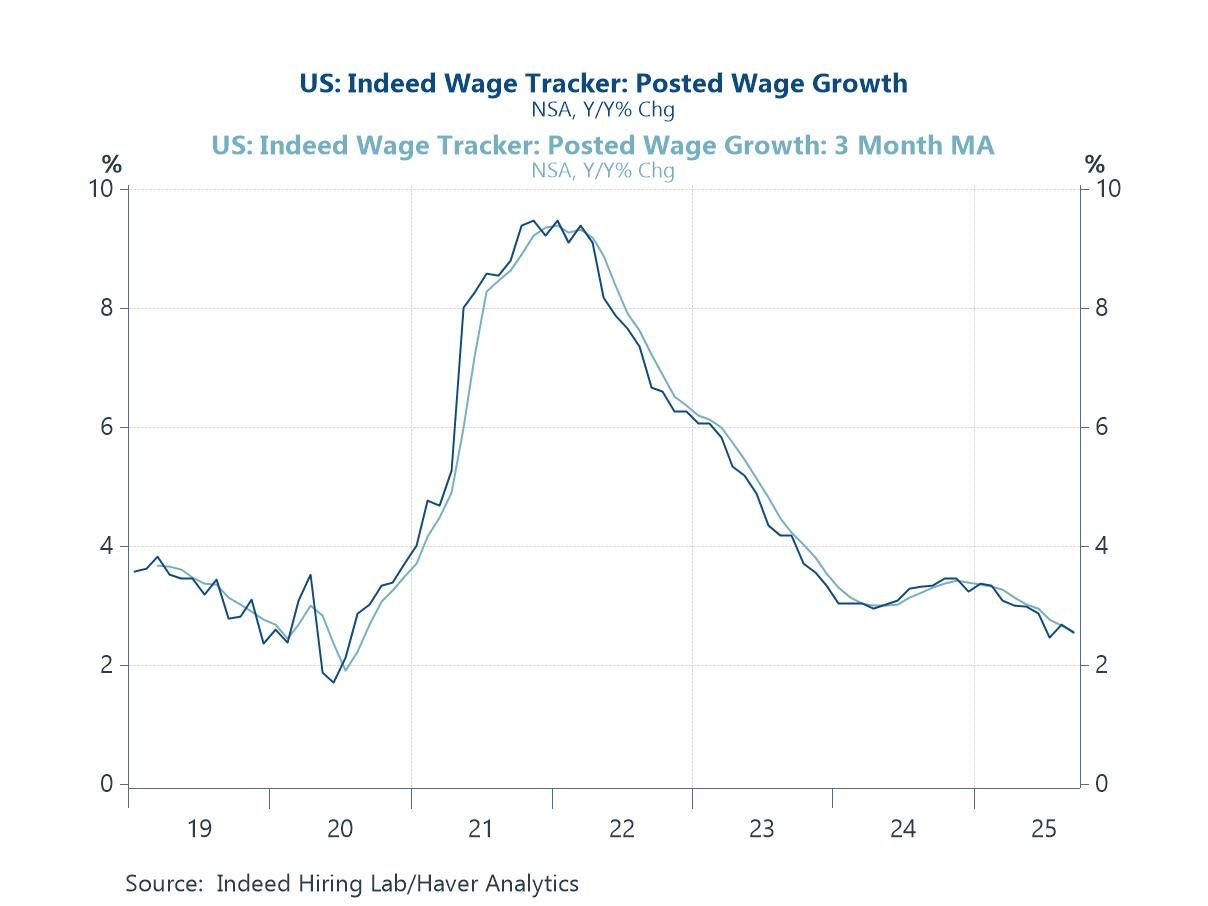
US wage inflation With official government data delayed by the shutdown, investors have been paying closer attention to private-sector sources to gauge inflation and labor market trends. These wage inflation figures in the chart below from the Indeed Hiring Lab are a case in point. Posted wage growth has continued to ease steadily, slipping from its post-pandemic highs above 8% to just over 2% y/y. This softening in wage pressures reinforces the message from the previous oil-price chart: inflation concerns are ebbing.
Chart 5: Indeed Wage Tracker: US wage growth
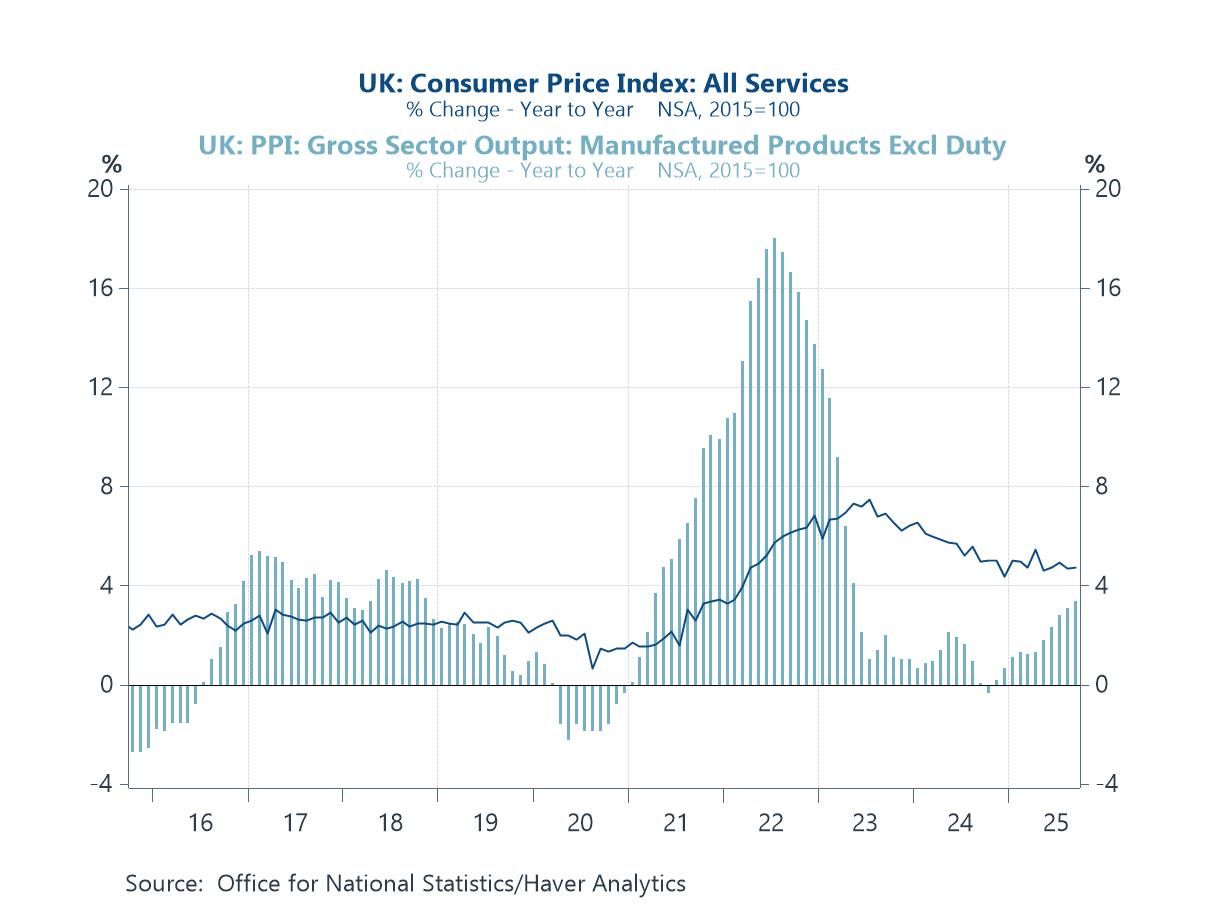
UK inflation Turning to the UK, this week’s CPI inflation data for September came in softer than expected, helped by weaker food and energy inflation. That’s welcome—but the mix was less comforting beneath the surface. As the chart below shows, services CPI inflation remains stubbornly elevated. At the same time, PPI output price inflation has turned higher again, hinting at a rebuild in upstream cost momentum. Together, sticky services inflation and a re-firming producer-price pulse temper the headline good news and argue for caution about how quickly UK inflation can glide back to the BoE’s 2% target.
Chart 6: UK inflation: Services CPI inflation versus producer output price inflation

Andrew Cates
AuthorMore in Author Profile »Andy Cates joined Haver Analytics as a Senior Economist in 2020. Andy has more than 25 years of experience forecasting the global economic outlook and in assessing the implications for policy settings and financial markets. He has held various senior positions in London in a number of Investment Banks including as Head of Developed Markets Economics at Nomura and as Chief Eurozone Economist at RBS. These followed a spell of 21 years as Senior International Economist at UBS, 5 of which were spent in Singapore. Prior to his time in financial services Andy was a UK economist at HM Treasury in London holding positions in the domestic forecasting and macroeconomic modelling units. He has a BA in Economics from the University of York and an MSc in Economics and Econometrics from the University of Southampton.
More Economy in Brief


