Empire State Manufacturing Index Unexpectedly Declines in September
by:Tom Moeller
|in:Economy in Brief
Summary
- First negative reading logged in three months.
- New orders & employment decline.
- Prices paid & received weaken.
- Six-month outlook ahead dims.
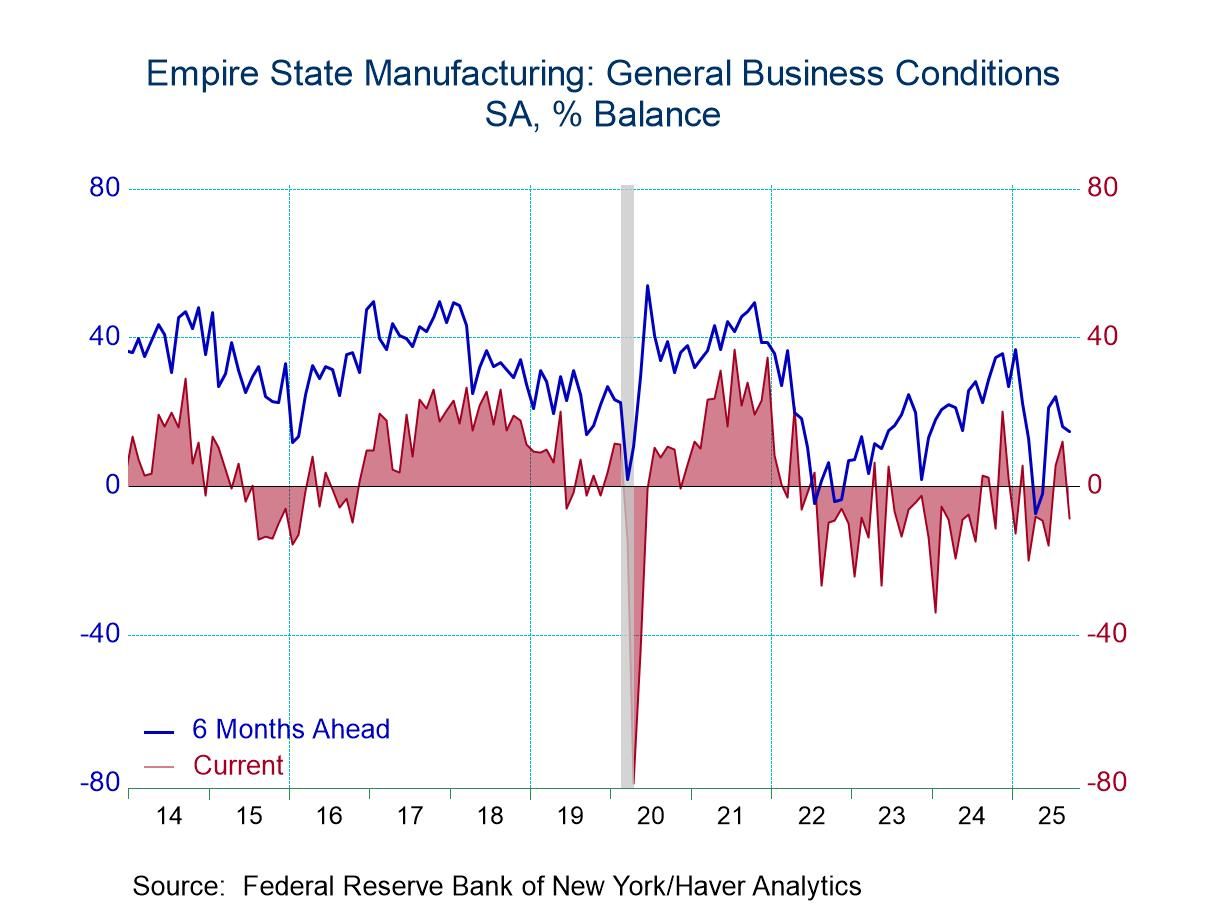
The Empire State Manufacturing Index of General Business Conditions index declined to -8.7 during September after improving to 11.9 in August from 5.5 in July, according to the Empire State Manufacturing Survey released by the Federal Reserve Bank of New York. The two previous positive reading had been the first above zero since this past winter. The latest reading indicates a decline in economic activity in New York State. A September reading of 5.0 had been expected in the Action Economics Forecast Survey. The percentage of respondents reporting an increase in general business conditions fell to 26.6% in September from 34.7% in August while the percentage reporting a decline rose to 35.4% from 22.8% in August. The latest survey was conducted between September 3 and September 10. The headline reflects the answer to a single question concerning the state of economic activity and is not calculated from the components.
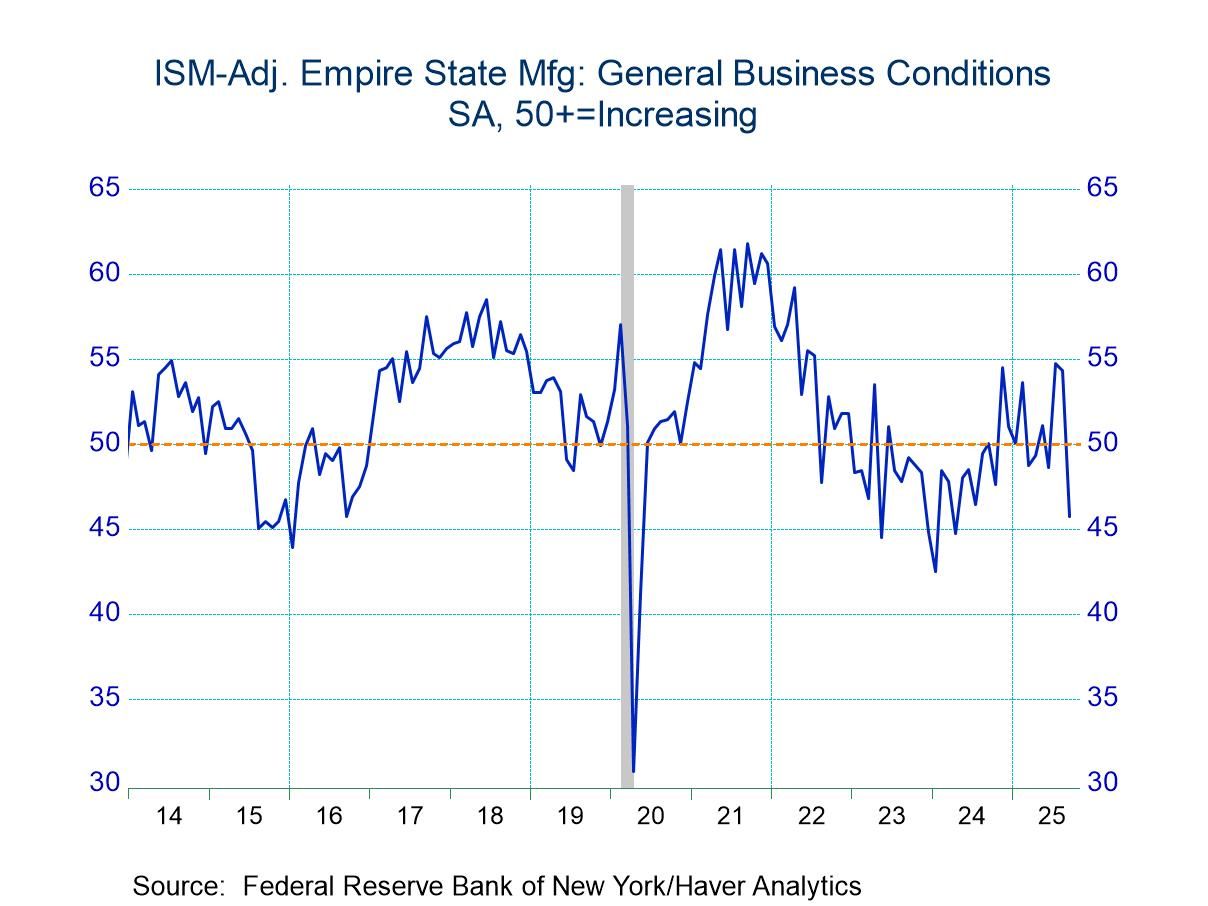
Haver Analytics calculates a composite index from the five major components, which is comparable to the ISM manufacturing index. This calculated index plunged to 45.7 in September from 54.3 in August. It was the first reading below 50 (separating expansion from contraction) in three months, and was the lowest reading since April 2024. The calculated index is the average of five diffusion indexes: new orders, shipments, employment, supplier deliveries and inventories, each with equal weights (20% each).
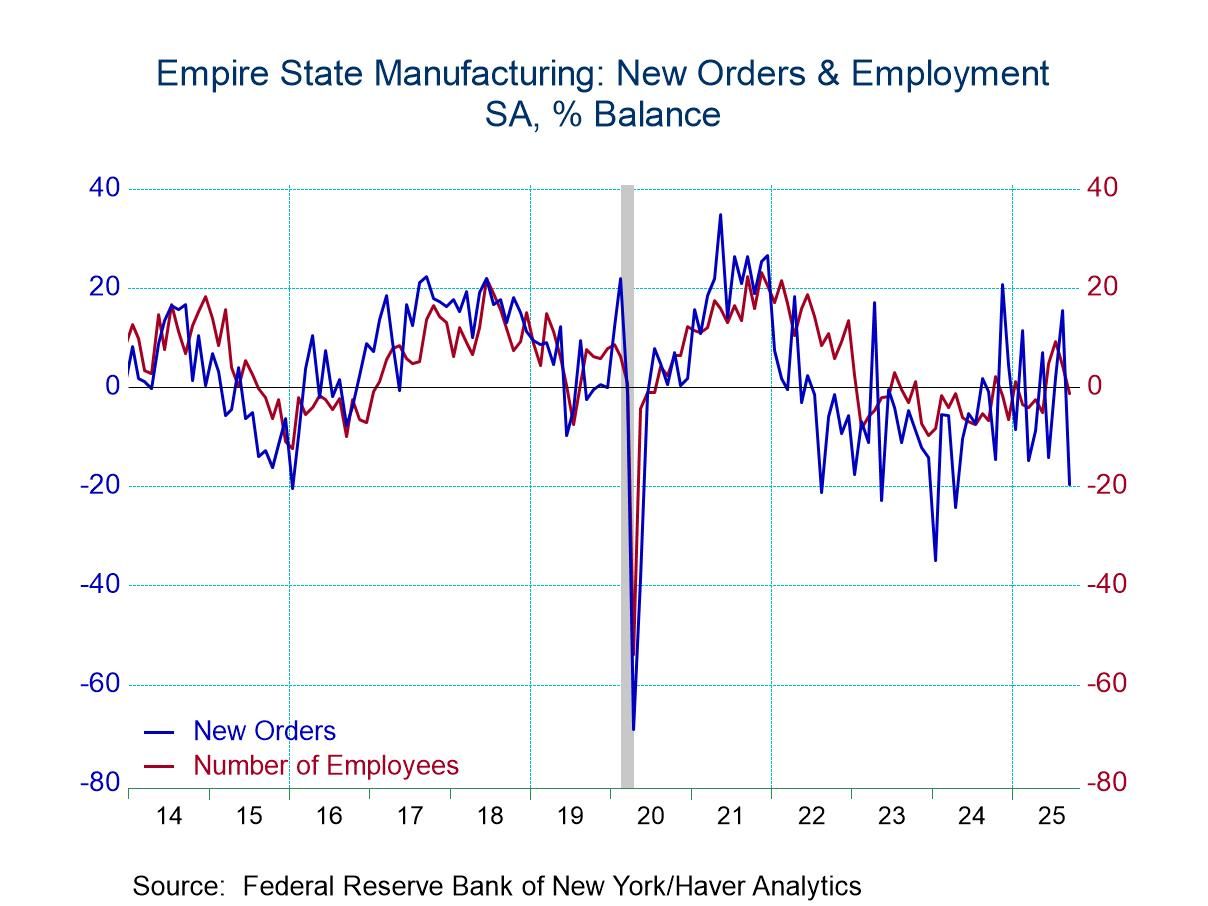
The decline this month was paced by a drop in the new orders index to -19.6 from 15.4. Twenty percent of respondents reported an increase in orders, down from 35.9% in August. The percentage reporting a decline in orders doubled to 39.5% last month. The shipments index fell to -17.3 from 12.2 in August. Inventories improved to -4.9 from -6.4, but these two were the first negative readings since last July/August of last year. The supply chain loosened up in September. The delivery times index more than reversed it increases during the last four months and fell to 0.0 after surging to 17.4 in August. It was the lowest reading since April. Ten percent of respondents reported an increase in delivery times, down from nearly 20.2% in July, while 9.8% reported a shortening versus 2.8% in July.
Employment also weakened to -1.2 from 4.4 in August. It was below a July high of 9.2. A lessened 9.1% of respondents reported an increase in hiring while 10.3% reported a decline. The average workweek reading fell to -5.1 this month from 0.2 in August. It was the lowest reading since April. A lessened 6.5% of respondents reported longer hours while a greater 11.7% reported a decline.
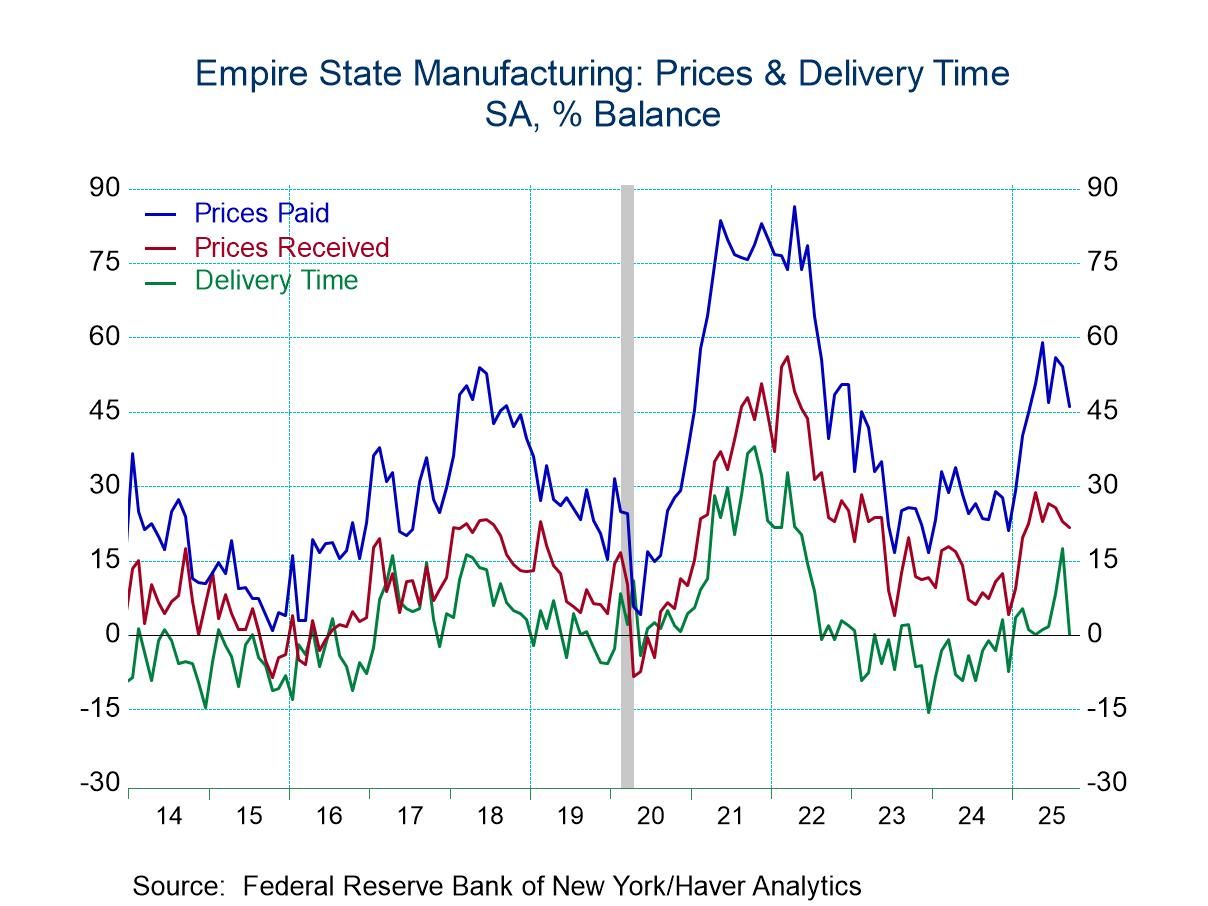
Inflation readings fell in September. The prices paid index fell to 46.1 from 54.1 in August and was the lowest reading in six months. A lessened 48.0% of respondents reported higher prices while a greater 2.0% reported a decline. The prices received index eased to 21.6 after sliding to 22.9 in August. It was the lowest reading since February, although both the prices paid & received indexes remain significantly higher than early last year.
Optimism amongst survey respondents about business during the next six months dimmed in September. The index for future general business conditions edged down to 14.8 from 16.0 in August, but still suggested an expectation of increased business activity. New and unfilled orders expectations improved, but the shipments and delivery times readings declined. The future employment reading declined sharply to the lowest level since 2016. The prices paid reading was close to its six-month low; prices received in six months rose. Of some concern, expected capital spending plans weakened, dropping to -3.9 in September to the lowest reading since April.
The indexes in this report are diffusion indexes and measure the percentage of respondents indicating an increase minus the percentage indicating a decrease with zero separating expansion from contraction.
The New York Fed survey data are contained in Haver’s SURVEYS database. The expectations series is in Haver’s AS1REPNA database.

Tom Moeller
AuthorMore in Author Profile »Prior to joining Haver Analytics in 2000, Mr. Moeller worked as the Economist at Chancellor Capital Management from 1985 to 1999. There, he developed comprehensive economic forecasts and interpreted economic data for equity and fixed income portfolio managers. Also at Chancellor, Mr. Moeller worked as an equity analyst and was responsible for researching and rating companies in the economically sensitive automobile and housing industries for investment in Chancellor’s equity portfolio. Prior to joining Chancellor, Mr. Moeller was an Economist at Citibank from 1979 to 1984. He also analyzed pricing behavior in the metals industry for the Council on Wage and Price Stability in Washington, D.C. In 1999, Mr. Moeller received the award for most accurate forecast from the Forecasters' Club of New York. From 1990 to 1992 he was President of the New York Association for Business Economists. Mr. Moeller earned an M.B.A. in Finance from Fordham University, where he graduated in 1987. He holds a Bachelor of Arts in Economics from George Washington University.
More Economy in Brief


 Global