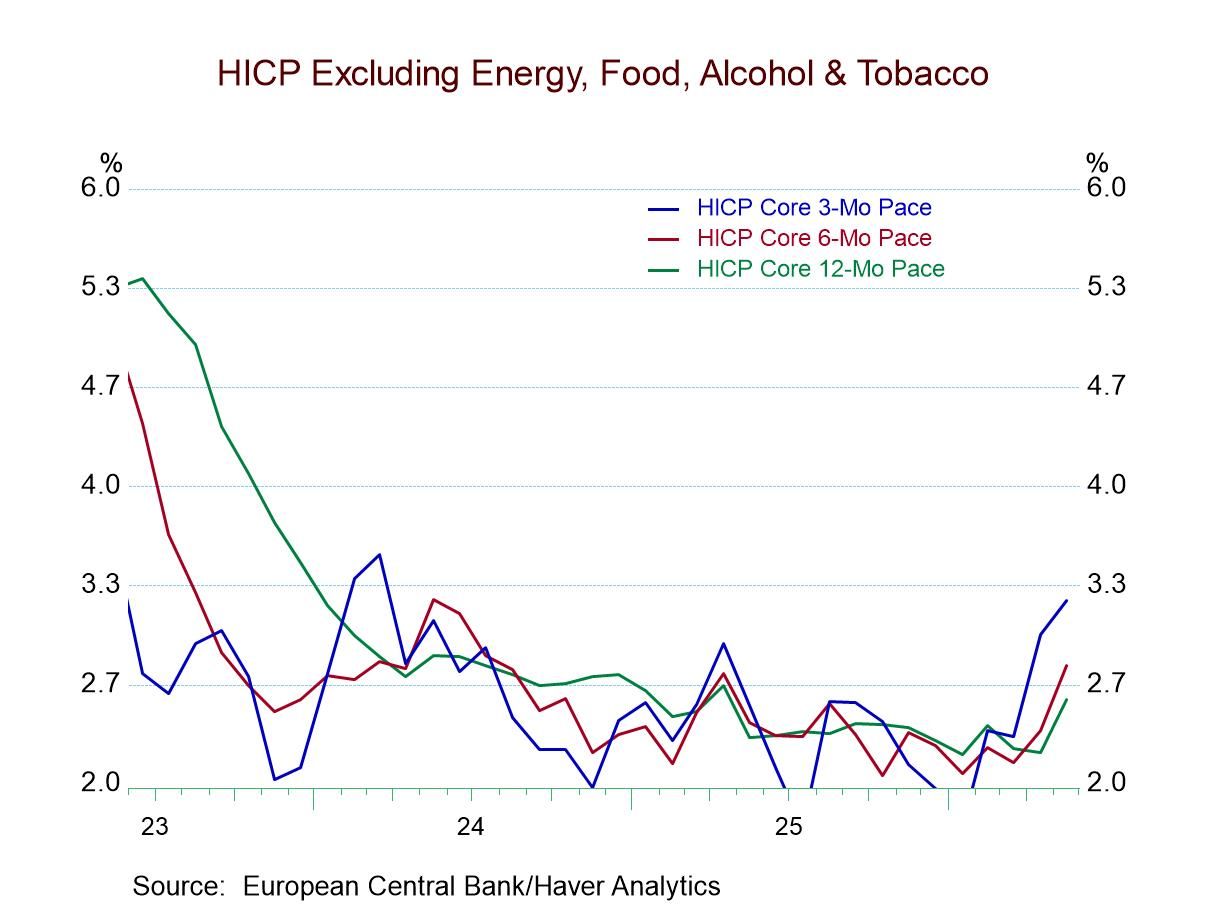
Haver Analytics
Haver Analytics

Economy in Brief

    • August sales +20.5% (+15.4% y/y) to 800,000; largest m/m gain in 3 yrs.; highest level since Jan. '22.
    • Sales up m/m in all four regions; sales down y/y only in the West (-5.7% y/y).
    • Median sales price at a 3-month-high $413,500; avg. sales price at a 3-year-high $534,100.
    • Months' supply of new homes for sale drops to 7.4 mths., lowest since July '23.
    • Purchase loan applications edge up 0.3% w/w, and refinancing loan applications rise 0.8% w/w jump.
    • Effective interest rate on 30-year fixed-rate loans falls to 6.15%, the lowest since September 2024.
    • Average loan size decline.
  • Germany
    | Sep 24 2025

    IFO Survey Setback in Germany

    The IFO climate survey deteriorated in September, falling to -15.6 from -15.1 in August. The wholesale reading showed a deterioration, as did manufacturing and then services. Construction and retailing improved slightly. The climate all-sector ranking is at its 20.7 percentile. Even weaker is the ranking for services at 7.9% and the ranking for manufacturing at 15.1%. Only the construction sector has a ranking above 50%, which places it above its median value. Wholesale and retailing both have rankings in the 21st percentile.

    Current conditions in September fell to a diffusion reading of -4.7 from -3.1 in August. The slippage was in manufacturing, wholesaling, and services once again with construction improving slightly and retailing improving to -17.8 from -19.7. The queue standing rankings have the all-sector current index in its 10.8 percentile. The individual sectors all have a higher ranking than that. The lower overall ranking reflects the confluence of weak rankings across sectors that is unusual. Manufacturing has a 13-percentile standing, services have a 12-percentile standing, with retailing at a 41.7 percentile standing and once again construction has a standing above its 50th percentile at the 60.4 percentile mark.

    The expectations’ all-sector index falls to -11.9 in September from -8.3 in August; that drop is troubling because this is a forward-looking metric not simply a current assessment. The rank standing for expectations is in its 19.7 percentile, about the same ranking as for climate and above the current all-sector ranking. Retailing logs a 13-percentile standing, services are at a 15-percentile standing, and wholesaling at a 19.9, nearly 20-percentile standing. Manufacturing is at a 26.9 percentile standing with construction at a 43-percentile standing. All the metrics are below their 50th percentile in expectations, marking all of them below their historic medians on data back to 1993.

    There is a far-right hand column that also presents ranking statistics. These are rankings since February 2022 since the invasion of Ukraine by Russia. For expectations, we see that after the invasion rankings are currently showing a lot of uplift although ominously the services sector, which is the job creating sector has only a 56.8 percentile standing; that compares to the all-sector expectation standing at its 84th percentile. Looking at climate the all-sector index is at 54.5%. That is much stronger than on the full data set back to 1993. The 54.5 percentile standing is supported by strong readings out of construction and wholesaling vs. weak greetings from retailing and services. But these weak rankings are still stronger than for the full sample. Readings for September current conditions on this shorter period remain about the same as for the full sample – except that retailing and services are much weaker.

    Overall, the September IFO is disappointing and weaker. The performance of expectations is disturbing. These are going to be developments to watch in the coming months especially to see if expectations make a recovery.

    • Goods deficit narrows to smallest since Q4 2023 as goods imports declined 18.4% q/q, reversing the surge in Q1.
    • Services surplus narrowed slightly from record high in Q1.
    • Balance on primary income remained in deficit, a rare occurrence. Secondary income deficit narrowed marginally.
    • Net financial-account transactions were -$406.9 billion in the second quarter, reflecting net U.S. borrowing from foreign residents.
  • The S&P PMIs for September show more backtracking than they show progress, although over three months even in terms of up-to-date monthly data, the trends show uptrends (among 21 calculations of 3-month changes only three show setbacks). Weakening is shown in the service sector in the United States, India, and Australia while in the United Kingdom, France, Germany, and in the European Monetary Union (EMU) services sectors were getting stronger. In September, manufacturing weakened in the EMU, Germany, France, the United Kingdom, Australia, and India with only the U.S. showing improvement. Japan, a country that usually contributes to the early PMI flash survey, is not included this month in the early S&P release.

    Sequential trends Over three months, we see broad strengthening across these reporting countries with Australia showing weakness across all three measures. India shows a composite weakening and a manufacturing weakening and France demonstrates manufacturing weakness. All the other 3-month metrics show strengthening. Using only the hard data and ignoring the up-to-date flash data that remained preliminary, there is still relatively broad strengthening over three months and six months. Over six months, the composite PMIs are strengthening everywhere except in Australia and in the United States with manufacturing improving broadly everywhere except in Australia, India, and in the U.K. Over 12 months, strengthening is also extremely broad with the United Kingdom an exception showing weakening on all three metrics- and with all the other metrics showing strengthening, except for services in Germany (17 out of 21 improve over 12 months).

    Standings The queue percentile standing data show a proliferation of readings above the 50-percentile mark placing them above their medians on data back to January 2021; the exceptions are the U.K. with sub-median weakening in all three sectors and in the United States with a sub-par services readings but one that is barely below its median (at 49.1%!). France checks in with sub-median services and composite readings.

    The outlook The chart at the top of this report makes a clear positive statement about the ongoing trend improvement. With the Federal Reserve in the U.S. having turned back to an easing cycle for interest rates even with inflation excessive, central banks may be ready to take a risk with stimulus. While inflation remains over target and may even be slightly accelerating, the pace of acceleration is very slight in the U.S. and largely the same conditions prevail globally. The current inflation overshoot faced by most central banks is modest; although in the case of the U.S., it has missed its inflation target for 4 1/2 years in a row-that should be worrisome but the Fed has pressed ahead with a rate cut and seems to favor even more.

    The average results for the PMI readings sequentially for 12-months, 6-months and 3-months show steady improvement. The sequential readings are based on only hard data available through August. The more recent monthly data (far right hand column on changes) show June to September improvement for the composite index and for services averages with manufacturing slightly weaker.

    The report on the month is slightly weaker, but the trending results are still encouraging. And if there is a new global easing cycle in train, growth will improve further even with the challenge of war remaining in place between Russia and Ukraine.

    • CFNAI -0.12 in August, highest since March; -0.28 in July.
    • Three of four CFNAI components up m/m, but three make negative contributions.
    • CFNAI-MA3 improves to -0.18, the fourth straight negative reading; still above -0.70 (recession signal).
    • CFNAI Diffusion Index increases to -0.24, highest since April.
  • This steady progression is underpinned by a six-month-ago reading of -10 and a 12-month-ago reading of -7. Belgium is an interesting mid-European economy. It is industrialized, it is middle-sized and it's in the middle of the monetary union itself.

    When the performance of confidence in Belgium is compared with the European Monetary Union total, we find that there is an average correlation in confidence of 0.56 across seven key economies including the monetary union measure itself. Belgium has a 0.79 correlation with confidence in the Netherlands, 0.69 relationship with France and the 0.76 correlation with the EMU overall, so it's a reasonably consistent bellwether for what's going on in the monetary union. And the correlation is close to 0.5 with Italy and Portugal. Belgium's weakest correlation in the monetary union among these countries is 0.18 with Greece. This suggests to me is that Belgium is a country that's relatively plugged into the activity trend of the monetary union itself.

    Belgium’s ranking for consumer confidence at 78.8% on data back to 1991; since January 2020, its consumer index is up by just 5 points, a very shallow gain for such a long period of time – but still a solid and firm ranking.

    For the economic situation over the next 12 months, the reading has a ranking at its 17th percentile, substantial steep down from a 40th percentile standing of the past 12 months. That’s not a good sign.

    Price trends are slightly elevated on a ranked basis but are falling month-to-month from July to August to September. However, sequentially since 12 months ago, they are on the rise- so the inflation picture is more complicated. Expected inflation (price trend) at a 69th percentile standing for the next 12 months, is down from what is now a 77.9 percentile standing over the previous 12 months.

    However, unemployment expectations are mild and falling both short term and sequentially with a low 9 percentile queue standing. That is very good news.

    The financial situation of households is little changed on both short- and long-term trends with modest near median ranking for the next- was well as the last-12-months.

    The appraisal of the current situation is down a notch in the month and sequentially has eased a bit as well but stands with an 83.2 percentile ranking, one of the highest standings in the table.

    Household standings have a high 94.4 percentile standing, the favorability to save at the 74.6 percentile mark.

    On balance The Belgian readings are solid and mostly upbeat. Inflation readings show concerns more than fear about what might be happening on the price front. On the whole, the response standings and trends are a positive signal for this country set in the belly of the European Union.

  • Following last week’s decision by the Fed to lower US interest rates, we examine Asia’s economic outlook, with particular focus on Japan, Indonesia, and Thailand. The Fed’s first rate cut of the year—while signalling more to come—has cleared the path for further easing from Asia’s central banks. Still, many regional central banks had already loosened policy despite wider yield differentials, responding to sluggish domestic demand, the growth drag from new US tariffs, and muted inflation pressures (chart 1). Across Asia, moreover, political turbulence risks distracting governments from tackling deeper structural challenges.

    In Japan, the BoJ kept its policy rate unchanged as expected last week but announced the gradual unwinding of its large ETF and J-REIT holdings, a move likely to tighten liquidity (chart 2). On the political front, investors are watching the LDP’s two-week leadership contest, which culminates in an October 4th vote, with elevated food costs and broader inflation still pressing concerns (chart 3). Indonesia remains in focus as well, with investor concerns over fiscal discipline heightened by the recent removal of its long-serving Finance Minister. Long-standing issues, such as persistently high youth unemployment, continue to weigh as well (chart 4).

    Thailand faces its own political uncertainty, with elections expected within four months after Prime Minister Anutin’s appointment. The interim push for near-term policy wins risks delaying structural reforms on household and public debt (chart 5). Meanwhile, the baht’s recent sharp appreciation—driven partly by surging gold prices (chart 6)—is straining exports and tourism, prompting the Bank of Thailand to explore measures to ease the currency’s gains, including taxing gold and encouraging US dollar-denominated trades.

    Post-Fed reactions, implications As expected, the Fed cut its policy rate by 25 bps at its September meeting, marking its first reduction of the year after months of anticipation. The updated “dot plot” suggests two additional cuts may be on the horizon, though these projections remain data-dependent. The Fed’s move follows several rounds of easing by Asian central banks (chart 1), which cut rates despite wider US differentials to shore up weak domestic demand or offset risks from US tariffs. Contained headline CPI, driven by softer demand and the absence of broad supply shocks, has given the Asian policymakers room to ease. Looking ahead, further rate cuts across Asia—except in economies such as Japan, which maintain a tightening bias—remain possible. This is especially likely as the growth effects of the latest US tariff hikes, effective August 7th, have yet to be fully felt. If the Fed delivers additional easing later this year, it could further strengthen the case for Asian central banks to loosen policy again.