U.S. Current Account Deficit Narrows Markedly in Q2 2025
by:Sandy Batten
|in:Economy in Brief
Summary
- Goods deficit narrows to smallest since Q4 2023 as goods imports declined 18.4% q/q, reversing the surge in Q1.
- Services surplus narrowed slightly from record high in Q1.
- Balance on primary income remained in deficit, a rare occurrence. Secondary income deficit narrowed marginally.
- Net financial-account transactions were -$406.9 billion in the second quarter, reflecting net U.S. borrowing from foreign residents.
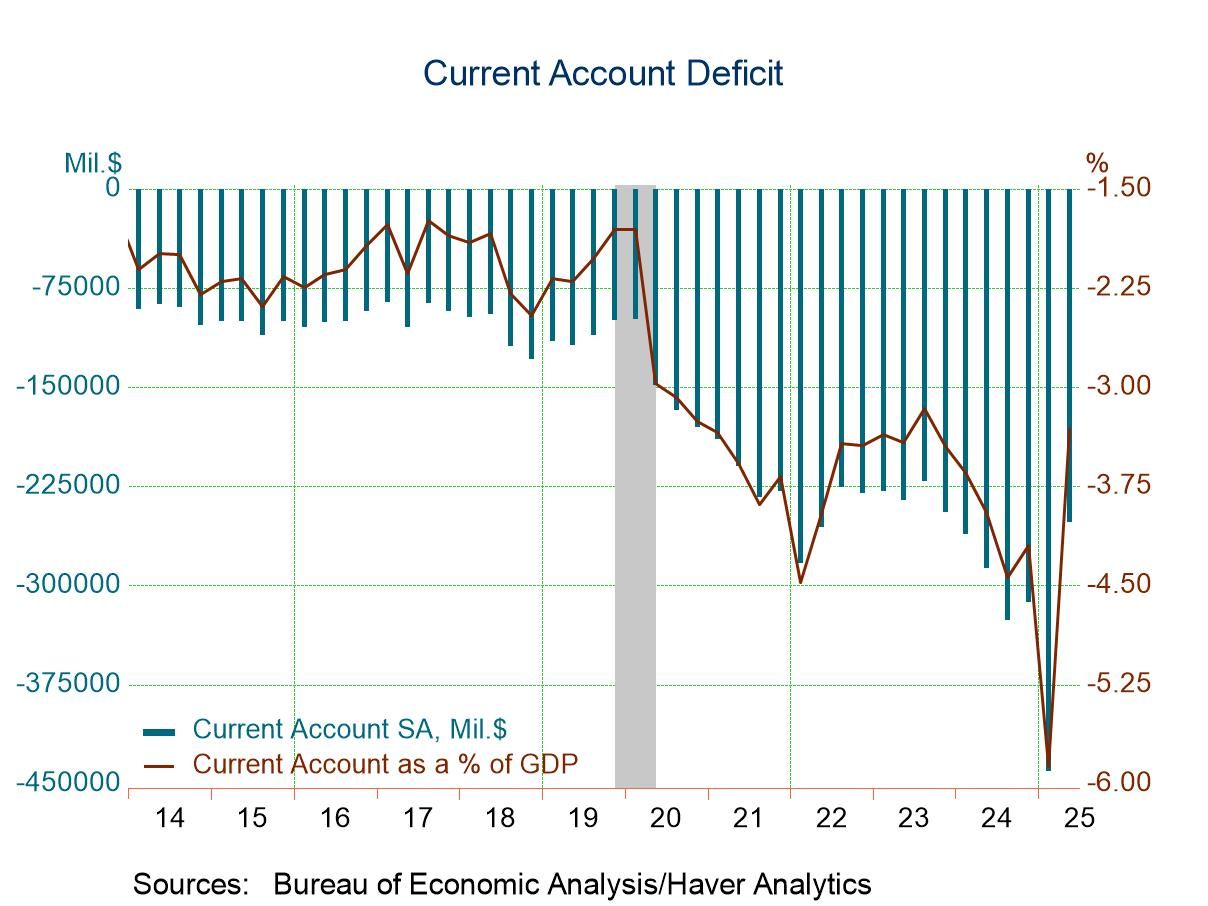
The U.S. current account deficit narrowed in Q2 2025 to $251.3 billion from a record $439.8 billion in Q1 (revised from $450.2 billion), according to statistics released by the Bureau of Economic Analysis. The series dates back to 1960. The Action Economics Forecast Survey expected the deficit to narrow to $256.3 billion in Q2. The Q2 deficit was 3.3% of GDP versus 5.9% in Q1.
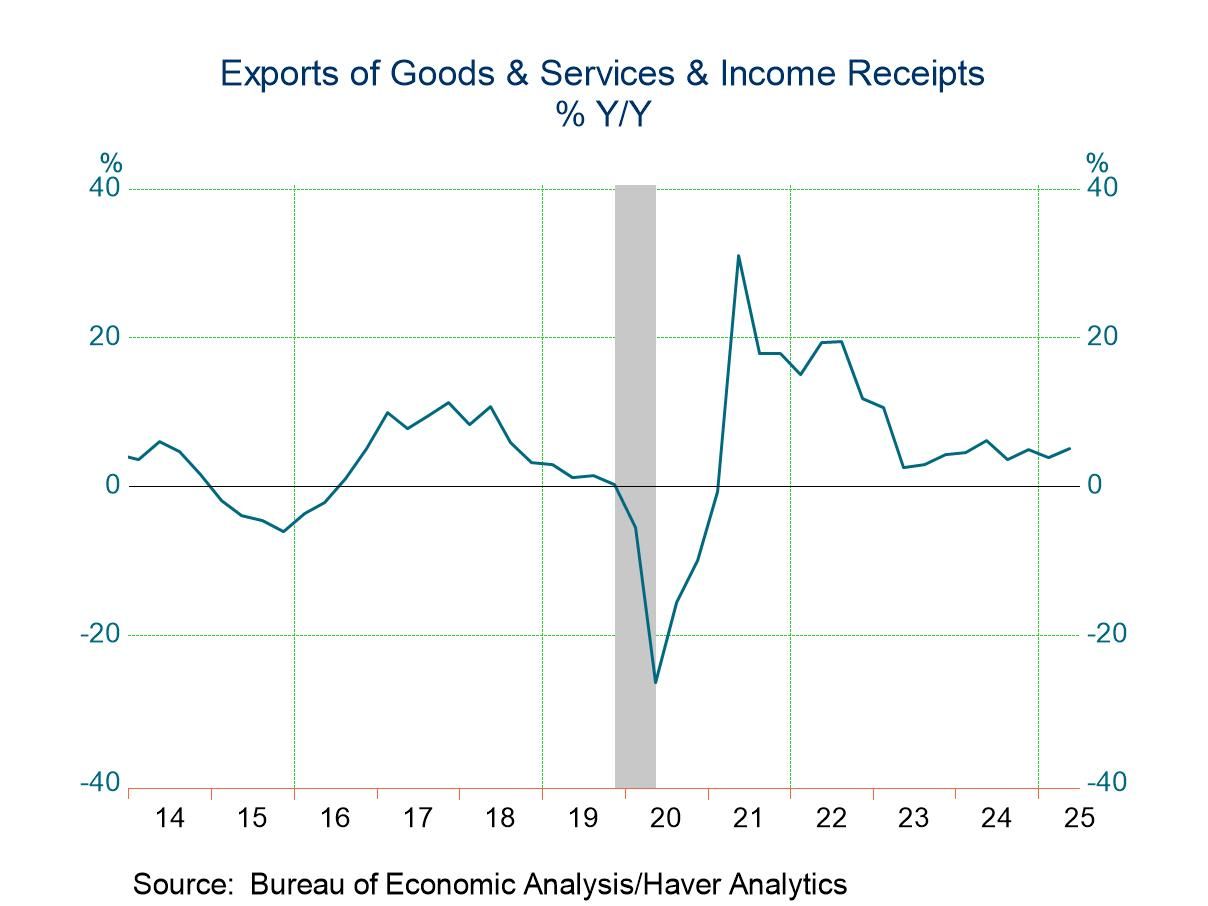
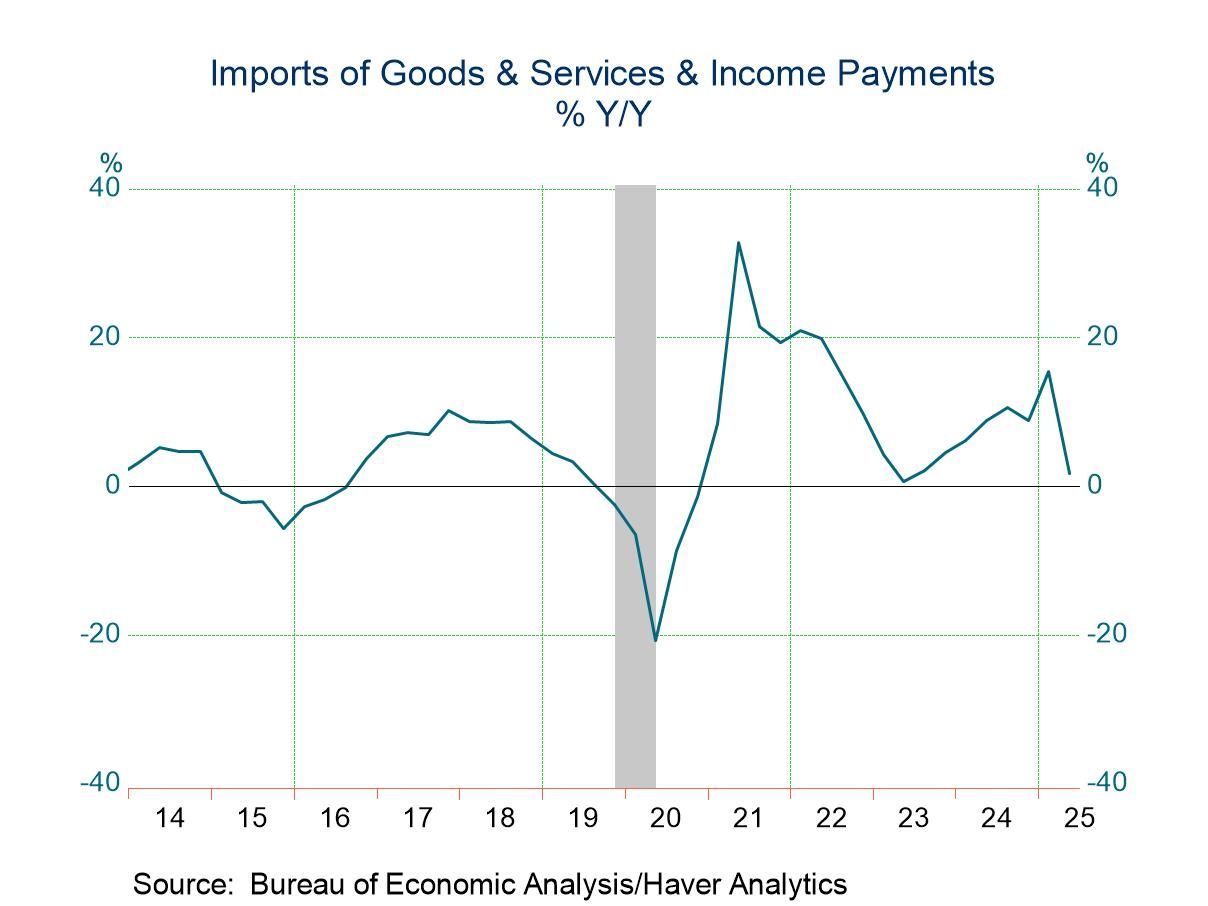
The narrowing in the overall deficit was due entirely to a narrowing in the goods deficit, to $270.0 billion in Q2 from $465.8 billion in Q1. The Q1 surge in the deficit reflected an 18.6% quarterly jump in imports as businesses attempted to front run expected tariff increases. In contrast, goods imports fell 18.4% q/q in Q2. Imports of nonfood consumer good excluding autos fell 26.2% in Q2 versus a 24.1% q/q jump in Q1. Industrial supplies imports slumped 14.2% q/q in Q2, more than reversing their 9.4% quarterly increase in Q1. Auto imports plunged 10.3% q/q in Q2, their largest quarterly decline since the pandemic shutdown in Q2 2020. Imports of nonmonetary gold plummeted 94% q/q in Q2 after quarterly increases of 169% in last year’s Q4 and 277% in Q1 in anticipation of tariff increases. Goods exports rose 2.1% q/q in Q2 following a 4.1% quarterly gain in Q1. Exports of nonmonetary gold soared 139% q/q in Q1 as the anticipated tariff increases did not materialize.
The services surplus narrowed slightly to $79.6 billion in Q2 from a series high of $80.3 billion in Q1. Service exports edged up 0.7% q/q versus a 0.6% quarterly gain in Q1. Services imports rose 1.3% q/q in Q2 after a 0.2% q/q decline in the previous quarter.
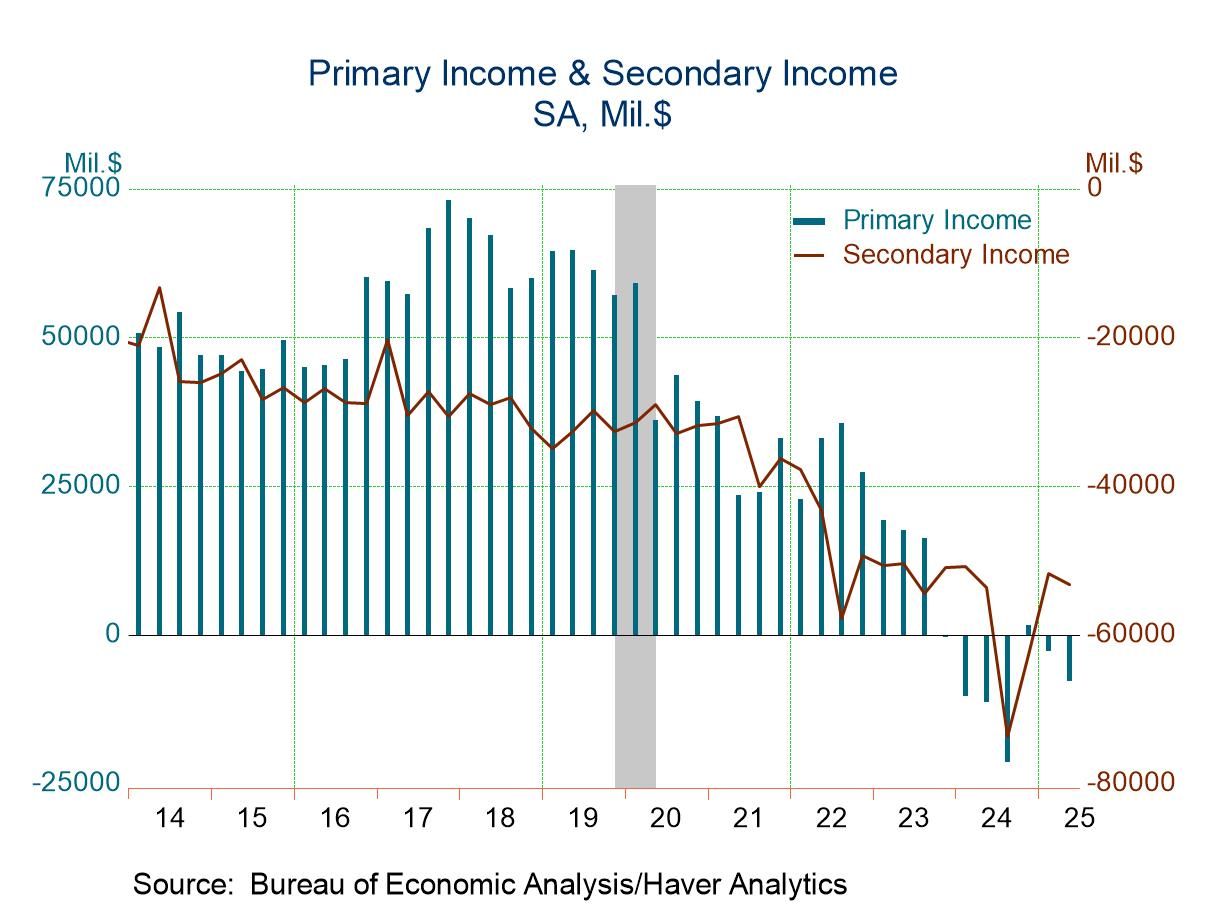
The primary income balance, dominated by income earned and paid on portfolio and direct investment, remained in deficit in Q2, posting a shortfall of $7.7 billion on top of a $2.6 billion deficit in Q1. This balance has been in deficit in only nine quarters since the series began in 1960. Receipts of primary income (earned income) increased $17.8 billion to $376.1 billion, and payments of primary income increased $22.8 billion to $383.8 billion.
The secondary income balance, reflecting transfers into and out of the US, remained in its usual deficit. The shortfall in Q2 widened to $53.2 billion from $51.7 billion in Q1. Receipts of secondary income (current transfers) decreased $2.6 billion to $45.9 billion, reflecting a decrease in private transfers. Payments of secondary income decreased $1.0 billion to $99.2 billion, reflecting a decrease in general government transfers.
Looking briefly at the financial accounts, net financial-account transactions were -$406.9 billion in the second quarter, reflecting net U.S. borrowing from foreign residents. For assets, second-quarter transactions increased U.S. residents’ foreign financial assets by $220.6 billion. Transactions increased “other investment assets” by $161.8 billion; portfolio investment assets by $45.2 billion; direct investment assets by $13.1 billion; and reserve assets by $0.6 billion. For liabilities, second-quarter transactions increased U.S. liabilities to foreign residents by $653.4 billion. Transactions increased portfolio investment liabilities by $452.5 billion; direct investment liabilities by $120.8 billion; and “other investment liabilities” by $80.1 billion. Net transactions in financial derivatives were $25.8 billion in the second quarter, reflecting net U.S. lending to foreign residents.
Balance of Payments data are in Haver’s USINT database, with summaries available in USECON. The expectations figure is in the AS1REPNA database.

Sandy Batten
AuthorMore in Author Profile »Sandy Batten has more than 30 years of experience analyzing industrial economies and financial markets and a wide range of experience across the financial services sector, government, and academia. Before joining Haver Analytics, Sandy was a Vice President and Senior Economist at Citibank; Senior Credit Market Analyst at CDC Investment Management, Managing Director at Bear Stearns, and Executive Director at JPMorgan. In 2008, Sandy was named the most accurate US forecaster by the National Association for Business Economics. He is a member of the New York Forecasters Club, NABE, and the American Economic Association. Prior to his time in the financial services sector, Sandy was a Research Officer at the Federal Reserve Bank of St. Louis, Senior Staff Economist on the President’s Council of Economic Advisors, Deputy Assistant Secretary for Economic Policy at the US Treasury, and Economist at the International Monetary Fund. Sandy has taught economics at St. Louis University, Denison University, and Muskingun College. He has published numerous peer-reviewed articles in a wide range of academic publications. He has a B.A. in economics from the University of Richmond and a M.A. and Ph.D. in economics from The Ohio State University.
More Economy in Brief

 Global

