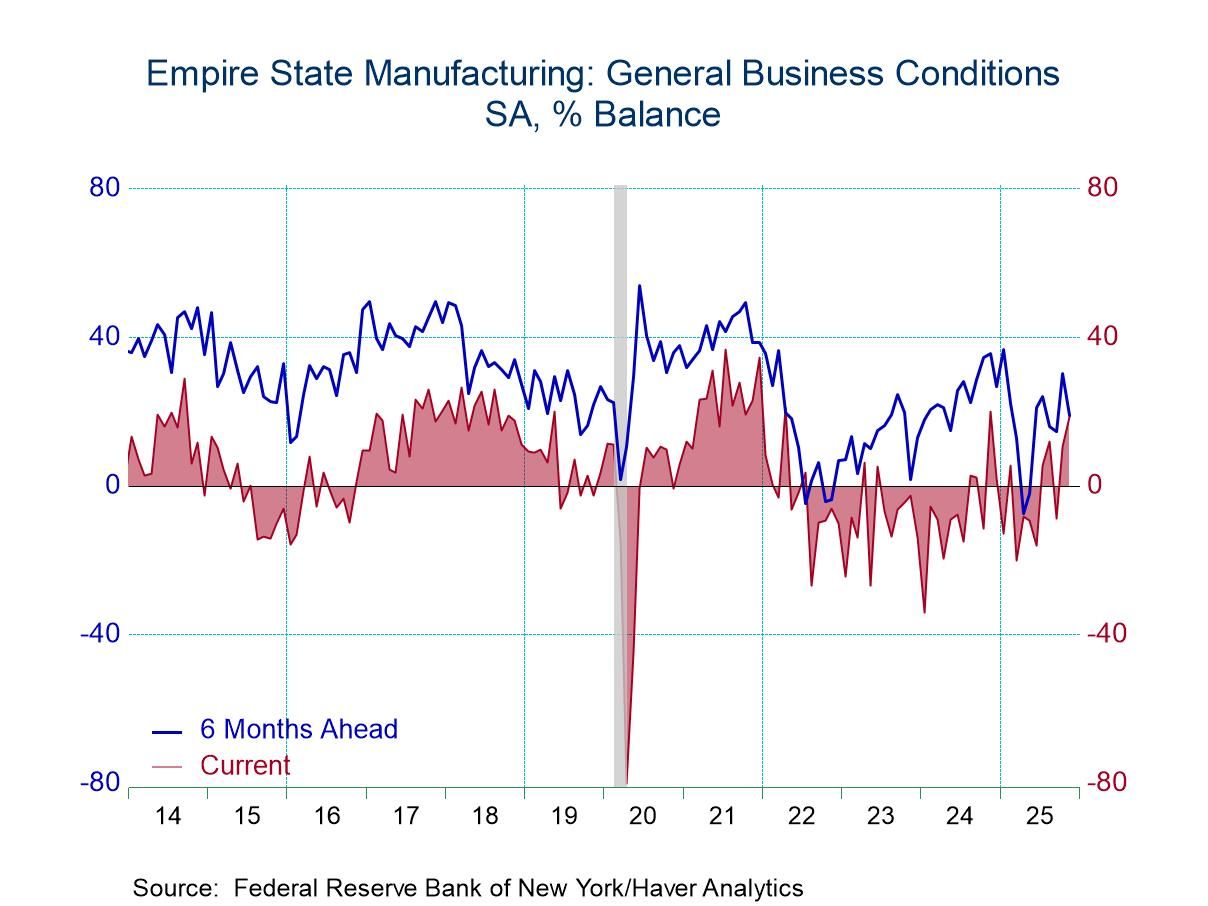
- New orders, shipments, employment & hours rise.
- Prices paid & received decline.
- Six-month outlook deteriorates.
by:Tom Moeller
|in:Economy in Brief
 USA| Nov 14 2025
FIBER: Industrial Commodity Prices Increase in Latest Four Weeks
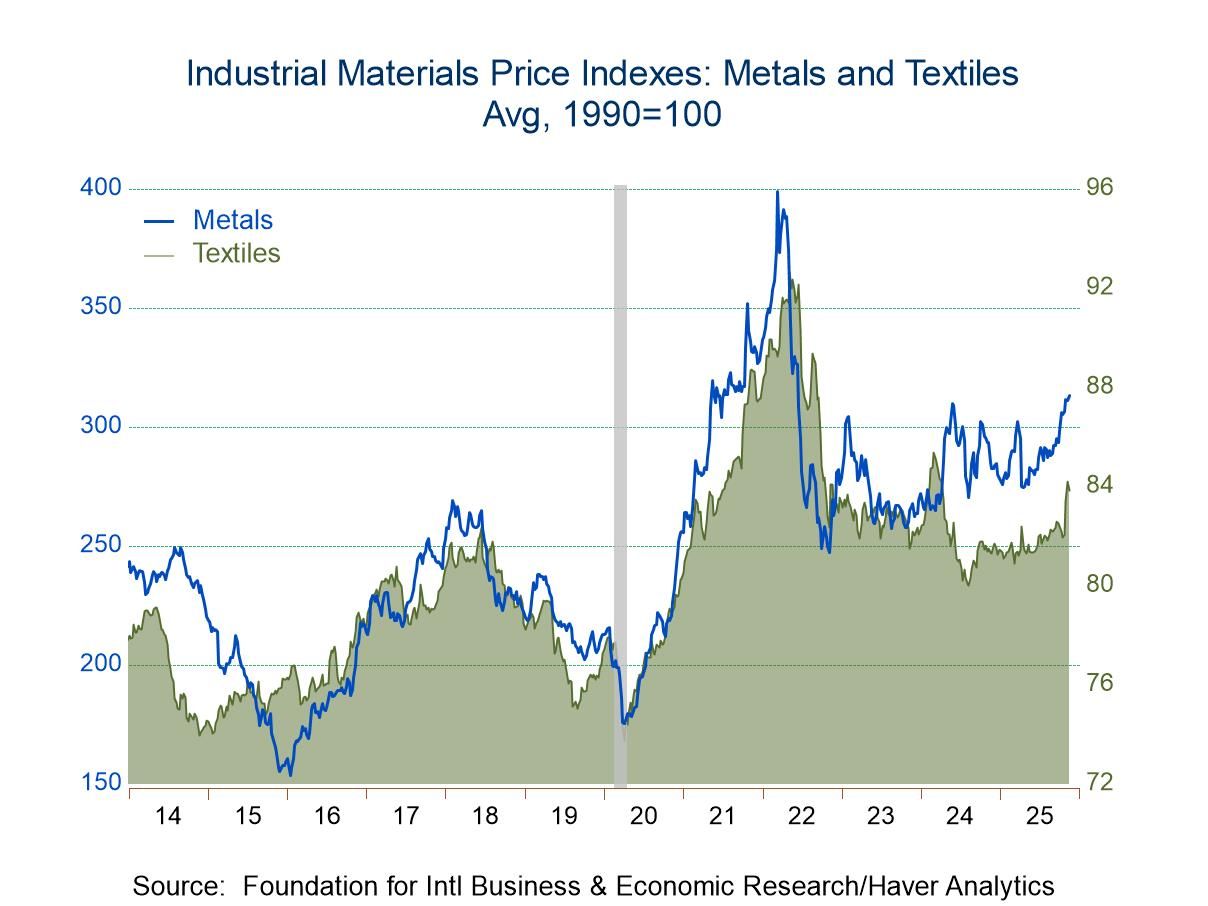
- Textile and metals prices continue to strengthen.
- Crude oil prices increase.
- Framing lumber costs decline again.
by:Tom Moeller
|in:Economy in Brief
 Europe| Nov 14 2025
EMU GDP Ticks High a Bit Faster
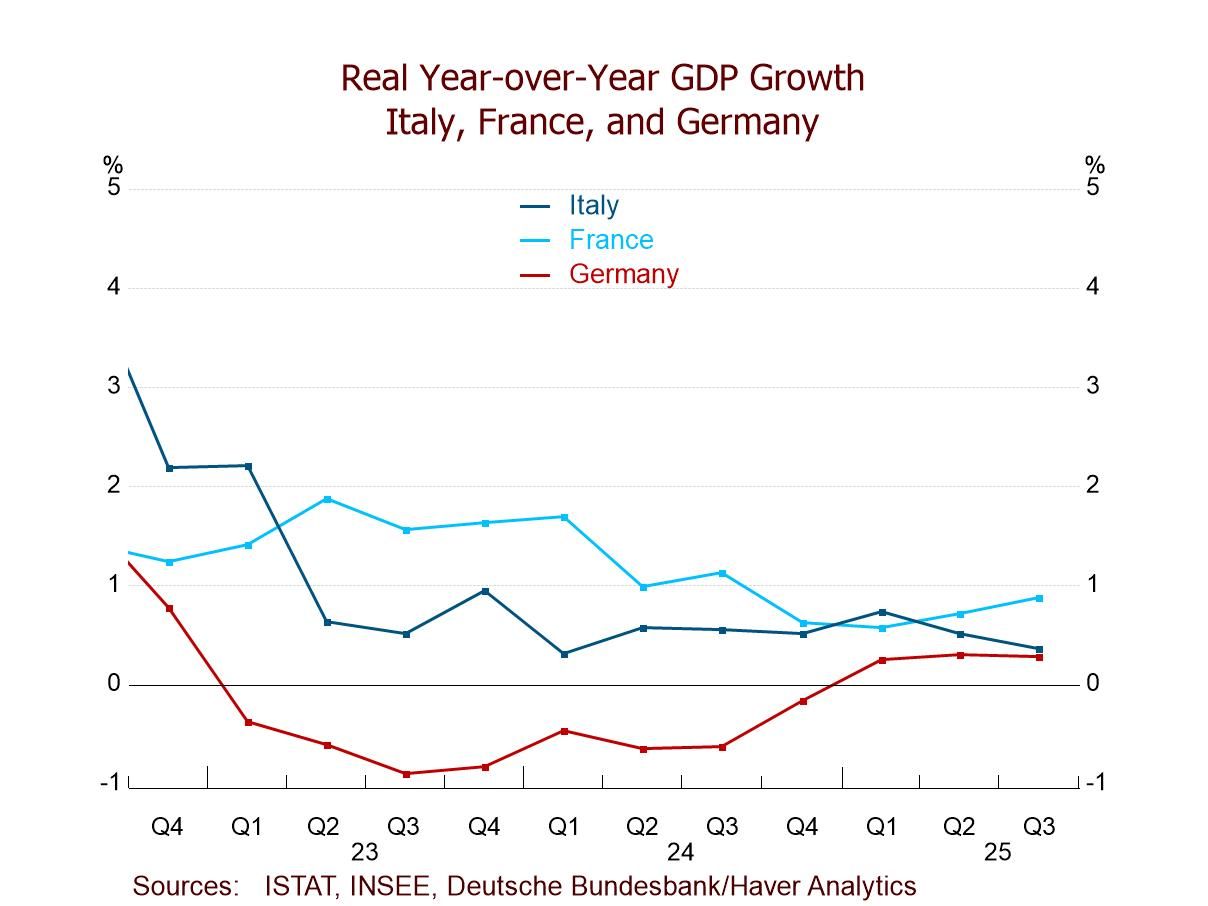
The European Monetary Union released an uneventful GDP report with GDP rising by 0.2% quarter-to-quarter in 2025 Q3 compared to an increase of 0.1% quarter-to-quarter in the second quarter of 2015.
At an annual rate, overall GDP rises at a 0.9% pace in the third quarter, up from 0.5% in the second quarter; that acceleration masks a deceleration in the year-over-year growth as Q3 growth is at 1.4% year-over-year compared to an increase of 1.5% year-over-year in the second quarter.
The table shows eight early-reporting monetary union members and among these eight only two of them show GDP slowing in the third quarter compared to the second quarter on quarter-to-quarter changes. Ireland slows to -0.4% after gaining by 0.9% in the second quarter. Spain’s annual rate in the third quarter falls to 2.6% compared to a 3% pace in the second quarter.
Looking at year-over-year growth rates, there are decelerations that are much more common. In fact, there are accelerations in only three of the countries: Belgium, France, and Portugal. Belgium’s GDP growth in the third quarter moves up to 1.1% from 1% in the second quarter, growth in France is at 0.9% in the third quarter compared to 0.7% in the second, while Portugal logs an increase of 2.4% compared to 1.8% year-over-year gain in the second quarter.
Looking at growth in terms of the four largest EMU economies versus the rest, large economy growth notched 0.9% in the third quarter in terms of quarter-to-quarter changes compared to 0.4% in the second quarter. Euro area growth for the large economies was unchanged 0.8% in the third quarter; in fact, it has grown by 0.8% year-over-year in the first quarter, second quarter, and third quarter of 2025. The rest of the monetary union shows growth accelerating in the third quarter to 1.1% from 0.7% in the second quarter. However, the year-over-year growth rate for the rest of the monetary union drops down to 2.8% in the third quarter from 3.4% in the second quarter and that compares to 3.8% in the first quarter.
The median growth rate, which is the growth rate among these eight countries and is unweighted, rises to 1.4% in the third quarter from 1% in the second quarter while the year-over-year growth rate has a median of 1.1% compared to 1.3% in the second quarter.
The quarter-to-quarter growth rates favor slightly the smaller countries in terms of the growth rate being logged although both large and small countries show a stepup in growth from the second quarter to the third quarter. Year-over-year growth rates also show much stronger growth in the rest of the monetary union compared to the four largest EMU economies on a consistent basis in fact for each of the four quarterly year-over-year growth rates in the table.
The rankings of growth give us some idea why we face these statistics, since three of the four largest monetary union economies log growth rates that are below their respective median growth rates since the late 1990s. Only three countries have growth rates above their medians on this timeline; those are Ireland, Portugal, and Spain. Germany, the largest monetary union economy, has a 30.4 percentile ranking for its year-on-year growth rate, France has a 28.3 percentile ranking, and Italy has a 35.9 percentile ranking.
The numbers posted today are in line with preliminary results and what markets had expected. Growth in the euro area continues to be positive and to move ahead. The signs in this report are that there's more progress than regress quarter-to-quarter although the progress remains slow, it's also relatively broad. This is a positive report but not a glowing report.
 Global| Nov 13 2025
Charts of the Week: The Year in Review
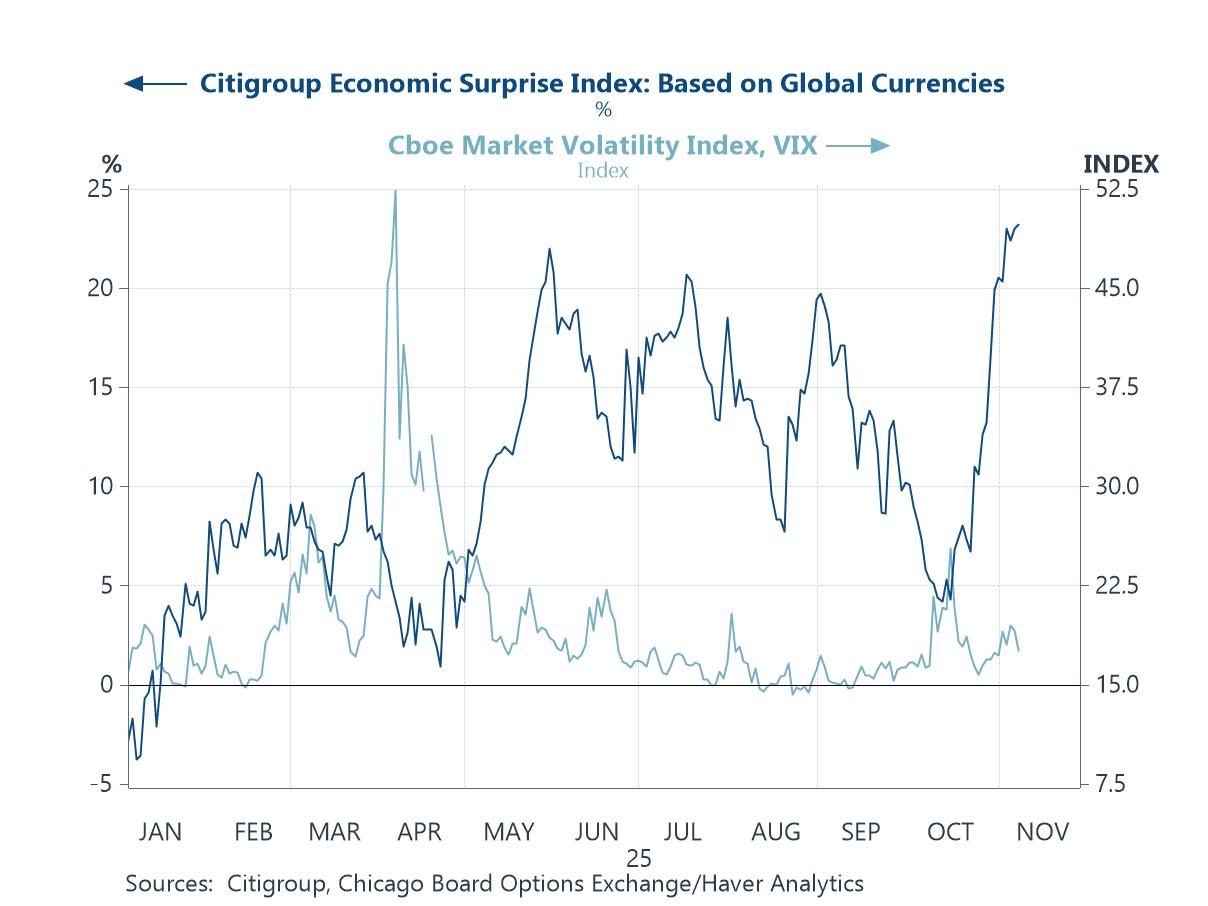
The global economic story of 2025 has been one of resilience amid disruption. Despite a succession of shocks — from a renewed U.S.–China trade confrontation and elevated geopolitical risks, to a sharp rise in fiscal activism and the energy-intensive AI investment boom — the world economy has held up better than many feared. Activity data have consistently surprised on the upside, supporting buoyant equity markets and keeping volatility contained. Meanwhile, inflation has continued to ease and central banks have cautiously shifted toward easier policy, even as large government deficits have kept longer-term real yields elevated. At the same time, US tariff policies have re-emerged as a defining force in global trade, with steep new duties on Chinese, Canadian, and Mexican goods disrupting supply chains and prompting renewed fragmentation in world commerce. These measures have cooled bilateral trade flows and added another layer of uncertainty to an already unsettled policy environment. Yet uncertainty itself remains the dominant feature of 2025 — geopolitical tension, technological exuberance, and diverging fiscal and monetary paths have left investors navigating a world where optimism and fragility coexist.
by:Andrew Cates
|in:Economy in Brief
 USA| Nov 13 2025
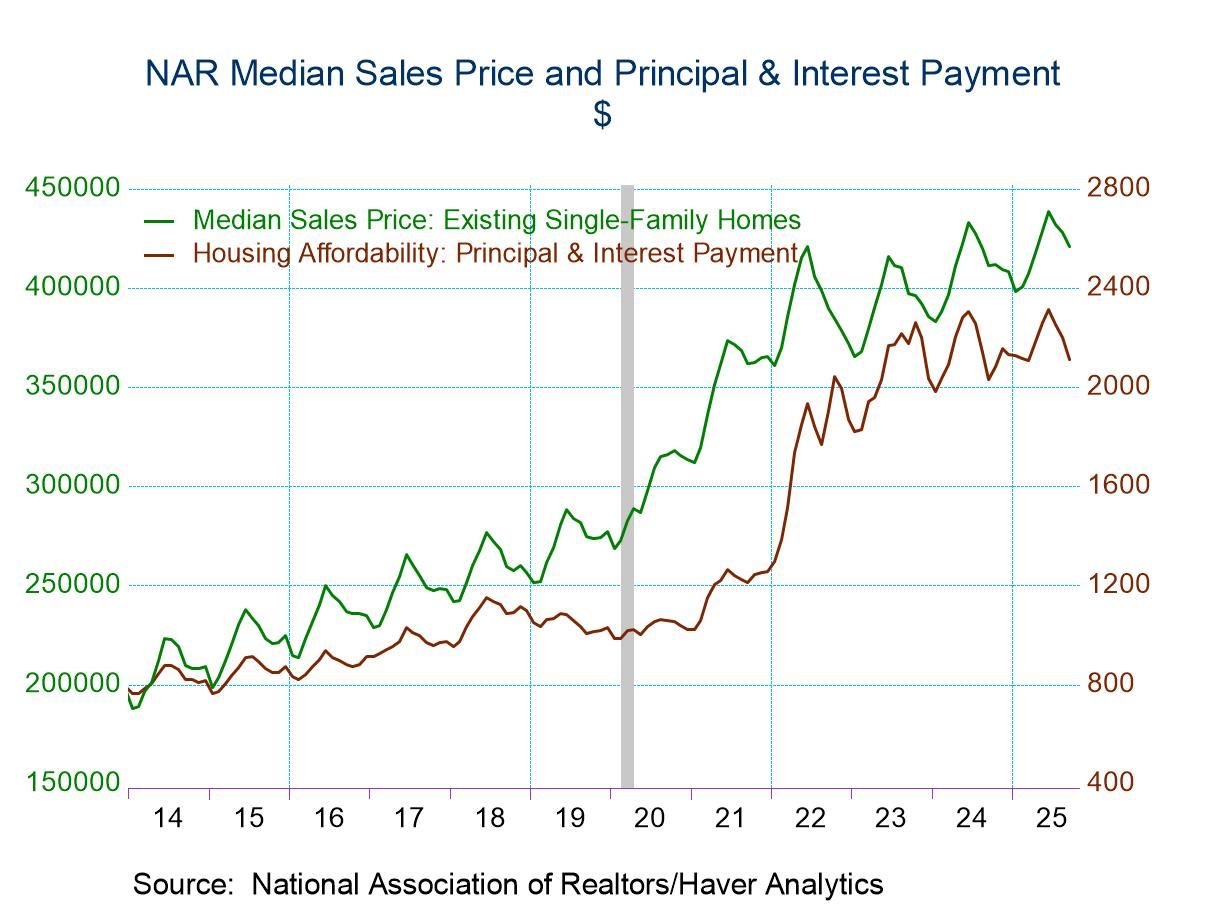
U.S. Housing Affordability Increases in September
- Home prices & mortgage rates continue to decline.
- Median income edges lower.
- Affordability increases across country.
by:Tom Moeller
|in:Economy in Brief
 Europe| Nov 13 2025
EMU Industrial Output Advances in September
Industrial output in the European Monetary Union in September advanced by 0.2% after falling by 1.1% in August and rising by 0.7% in July. Output of consumer goods fell in the month with overall consumer goods output falling by 2.5% and a 0.5% reduction in consumer durables output and a 2.6% reduction in the output of consumer nondurable goods. However, intermediate goods output grew by 0.3% and capital goods output rose by 0.3% in September. Output fell broadly across each of these sectors and subsectors in August but then it rose in all of them in July. Output metrics have been through a bit of turbulence over the last three months.
Sequential Growth Performance Sequential calculations showing annual rates of growth over 12 months, six months and three months reveal some weakening in output and then some diminishing of that trend. Overall output rises by 1.4% over 12 months. Then output falls at a 4.9% annual rate over six months and that reduction in its cut to -0.8% over three months. Manufacturing follows that same pattern. Consumer goods output also follows that pattern, but durables and nondurables output of consumer goods are on the same wavelength with the only difference that consumer durables output also falls over 12 months. Intermediate goods output rises by 0.3% over 12 months, falls at a 3.3% rate over six months, and then rises at a 2.3% annual rate over three months. Capital goods output is up by 1.5% over 12 months, falls at a 2.9% annual rate for six months, and then is flat over three months. The sector results show a good deal of chaos in terms of trying to pin down a trend.
Quarter-to-Date Quarter-to-date that now show results for the full third quarter on this preliminary note, reveal output eroding by 0.1% at an annual rate; manufacturing output falling at a 0.4% annual rate, with an increase in consumer goods at a 1% annual rate, created totally by an increase of 1.5% consumer nondurable goods output. Intermediate goods and capital goods both show output declines in the just-ended quarter.
Rankings/Standings The percentile standings show that consumer durable goods output is below its median at a 39.9 percentile standing. Intermediate and capital goods output also are both below their medians (below 50%) but a 45-percentile standing for intermediate goods and a 46.8 percentile standing for capital goods prevail. However, these are not tremendously weak values; they're just slightly below their median rates of increase since the median rate of increase occurs at a ranking of 50%.
Country Performance for Manufacturing We're revisiting the country data much of which has already been released. Out of 13 monetary union members in the table only 5 show output declines in September and none of the four largest economies log a decline in output in September. However, seven countries had logged declines in August, and six had logged declines in July.
Countries Sequentially Turning to sequential data annual growth rates over 12 months, six months, and three months, there are declines in six countries over three months, in seven countries over six months but in only four countries over 12 months. The country's logging output declines over 12 months include Germany, Finland, Luxembourg, and Malta.
Quarter-to-Date On a quarter-to-date to date basis, there are five countries that log output declines in the third quarter. They are Germany, Finland, Portugal, Luxembourg, and Malta.
Country Standings The queue percentile standings show five countries with output increasing at a pace below its median pace since 2007. The average of the median standings across countries is a reading of 63.8% and that's the same as the standing for output in the whole euro area. While the performance of output is still somewhat irregular, conditions appear to be solidifying and risks to the downside appear to be diminishing. Conditions remain somewhat touch and go. The European Central Bank is in a waiting mode; it has not turned off its easing cycle. In the United States, it's unclear whether the Fed is going to continue the easing cycle or not. The government shutdown in the U.S. makes U.S. policy options more complicated although the outlook for growth in the United States in 2026 with new fiscal provisions in force and a rebound out of the government shutdown appear to be quite good. However, globally inflation is still largely excessive and central banks are definitely running out of room to become more stimulative.
 USA| Nov 12 2025
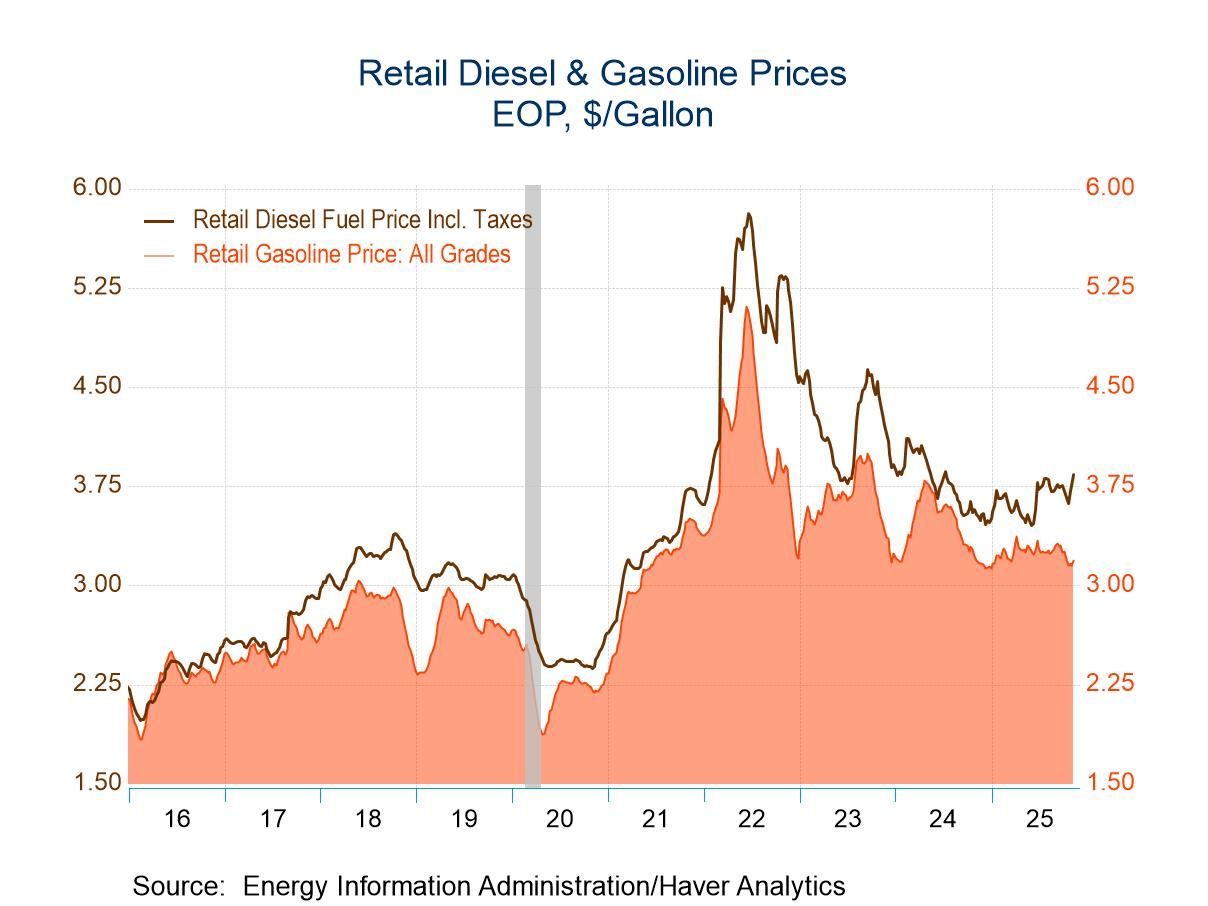
U.S. Energy Prices Remain Mixed in Latest Week
- Gasoline prices rise to four-week high.
- Crude oil prices decline.
- Natural gas prices move to highest level since April.
- Demand for gasoline & all petroleum products falls.
by:Tom Moeller
|in:Economy in Brief
 USA| Nov 12 2025
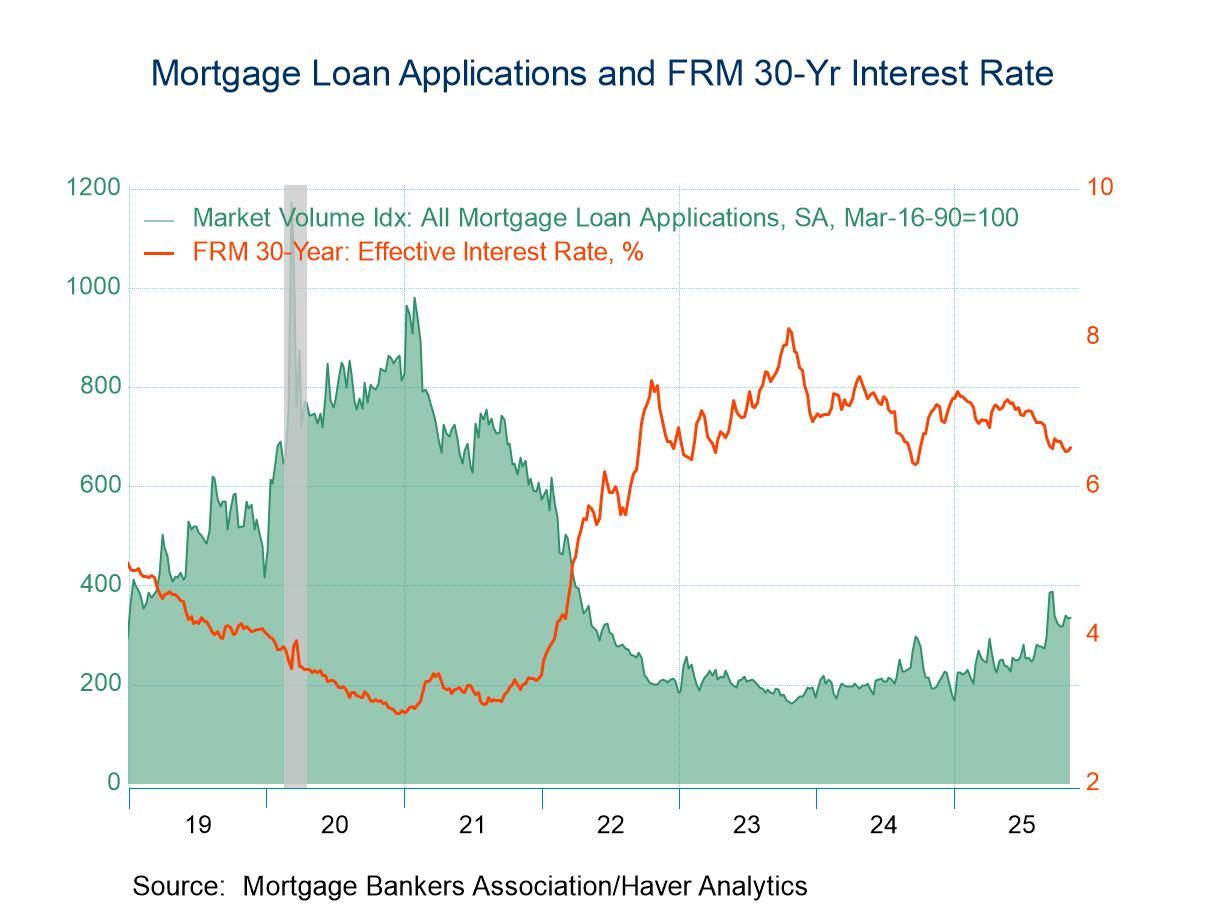
U.S. Weekly Mortgage Applications & Interest Rates Edge Higher
- Mortgage interest rates rise to three-week high.
- Purchase loans surge but refinancing declines.
by:Tom Moeller
|in:Economy in Brief
- of2725Go to 52 page