U.S. Producer Price & Core Price Indexes Hold Steady in June
by:Tom Moeller
|in:Economy in Brief
Summary
- Unchanged monthly levels extend weakness earlier this year.
- Core price gain slows y/y.
- Final demand price index is steady; services prices decline.
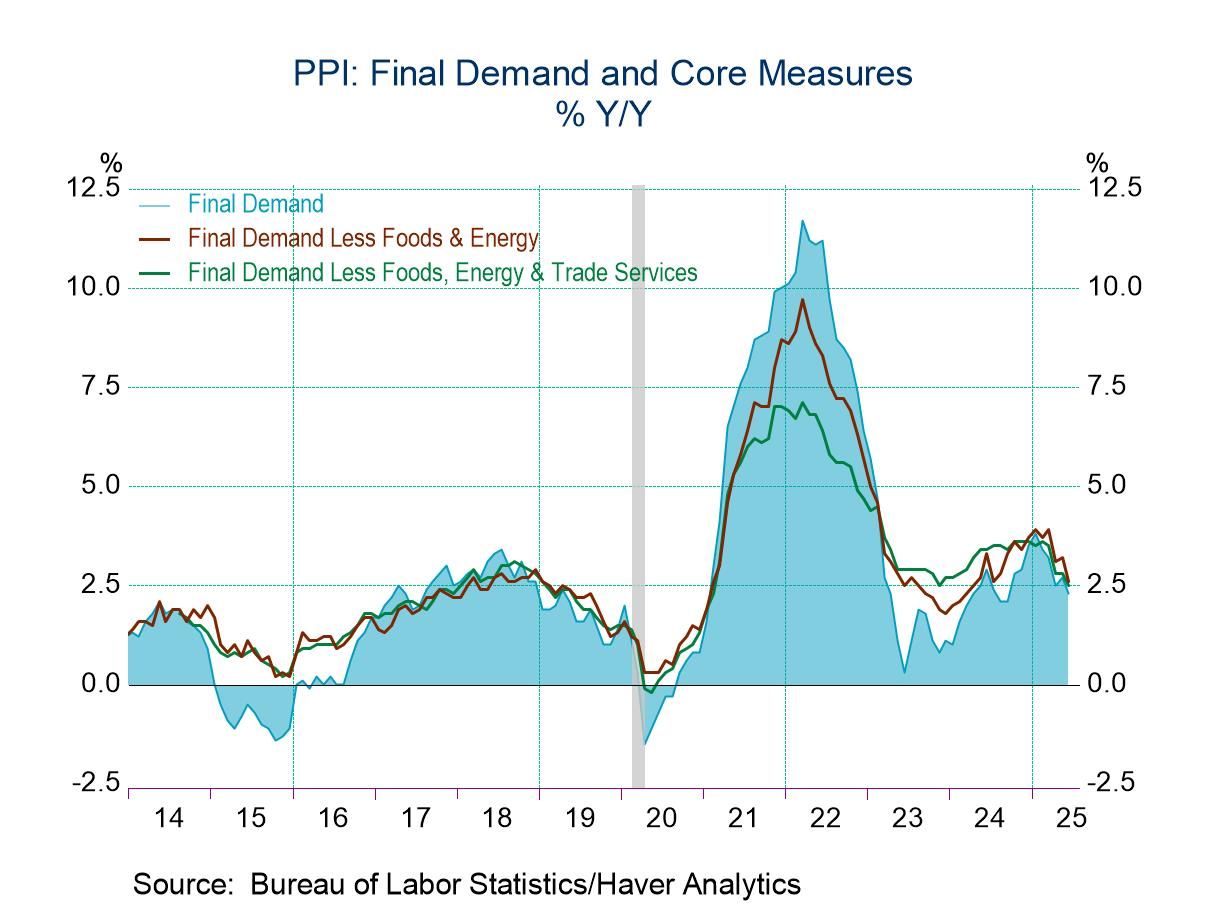
The Producer Price Index for final demand was unchanged (2.3% y/y) in June after rising 0.3% in May, revised from 0.1%, and easing 0.3% in April, revised from a 0.2% fall, according to the Bureau of Labor Statistics (BLS). The Action Economics Forecast Survey expected a 0.2% increase in June. Producer prices excluding food, energy & trade services also were unchanged (2.5% y/y) after a 0.1% May gain, and falling 0.2% in April, which was revised from -0.1%. A 0.2% increase had been expected.
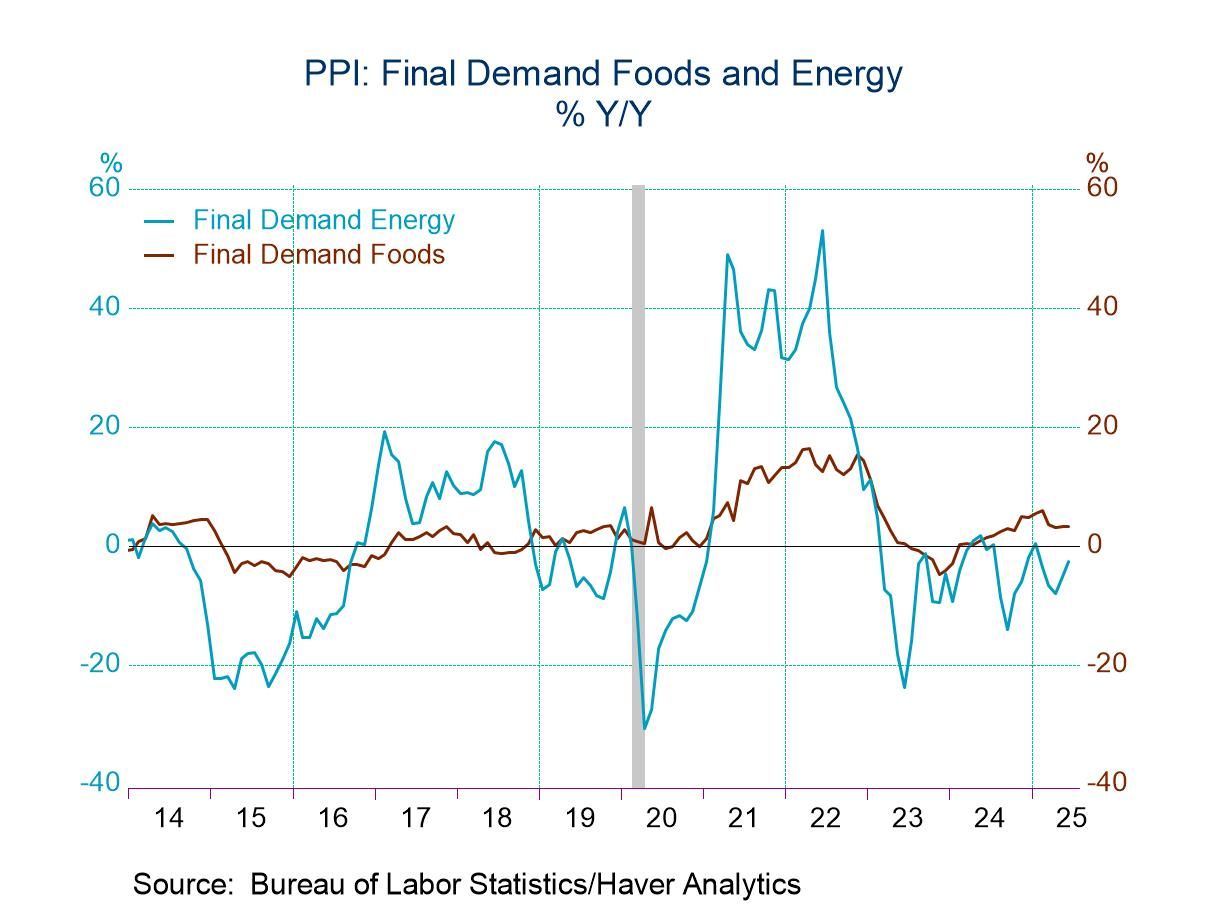
Food prices rose 0.2% (3.3% y/y) in June after holding steady in May. Finished consumer food prices rose 0.2% (3.7% y/y) after increasing in May. Energy prices for final demand rose 0.6% (-2.6% y/y) last month after falling 0.3% in May. Finished consumer energy prices rose 0.9% last month (-1.7% y/y) after a 0.6% increase.
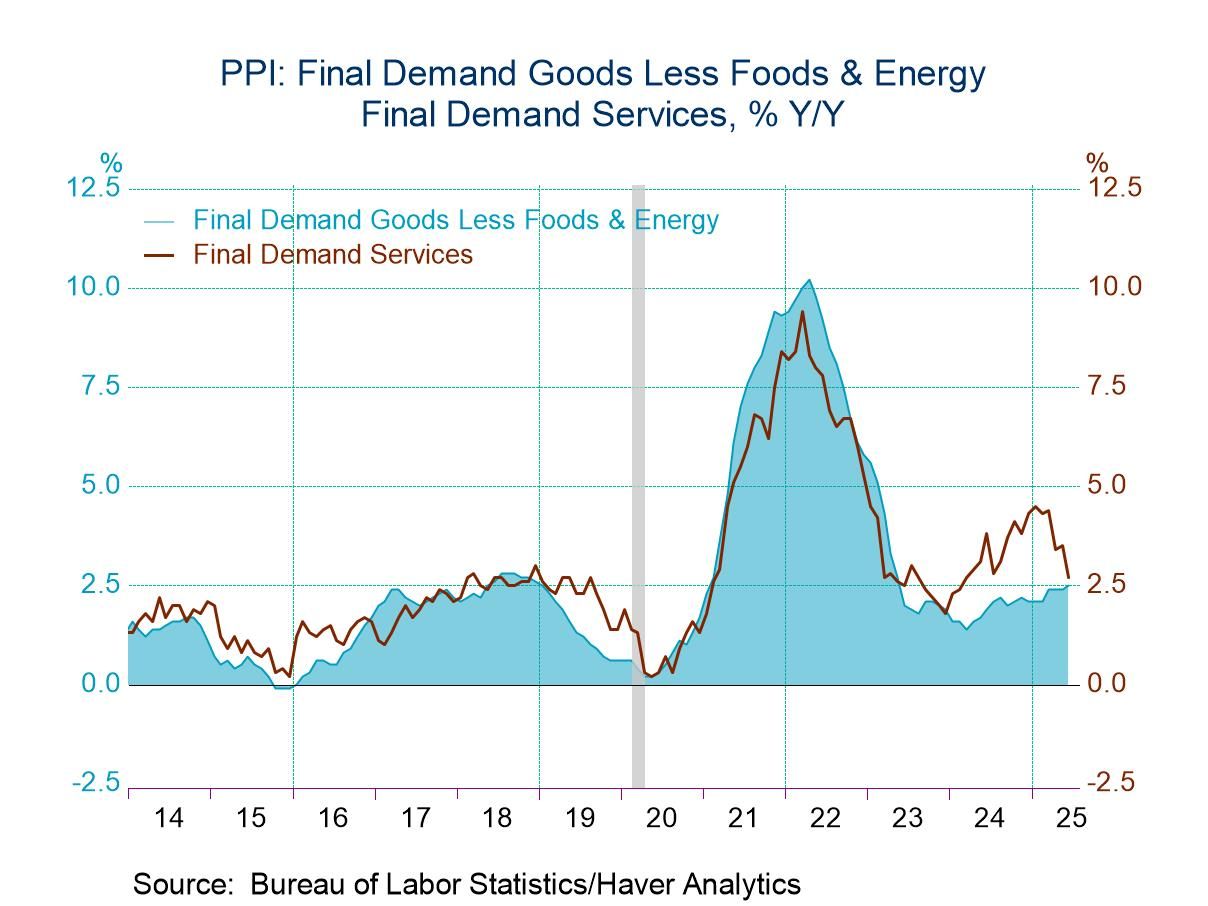
Final demand services prices continued to hold back overall pricing pressure last month with a 0.1% dip (+2.7% y/y), following a 0.4% increase. Final demand trade services prices held steady (+2.9% y/y) after surging 1.1%, while the trade of finished goods index remained unchanged (+2.8% y/y) following a 1.2% surge. Transportation & warehousing prices fell 0.2% (+2.5% y/y) after a 0.4% gain in May. Prices for final demand services less trade, transportation, and warehousing eased 0.1% last month (+2.6% y/y) after improving 0.1% in May.
The price index for final demand goods less foods & energy increased 0.3% (2.5% y/y) in June following a 0.2% increase. Nondurable consumer goods prices less food & energy rose 0.1% (2.3% y/y) after a 0.2% increase. Durable consumer goods prices rose 0.4% (2.4% y/y) following a 0.5% rise. The private capital equipment price index improved 0.3% (3.2% y/y) for the second straight month. Government prices less food & energy rose 0.4% (2.9% y/y) after increasing 0.2% in May.
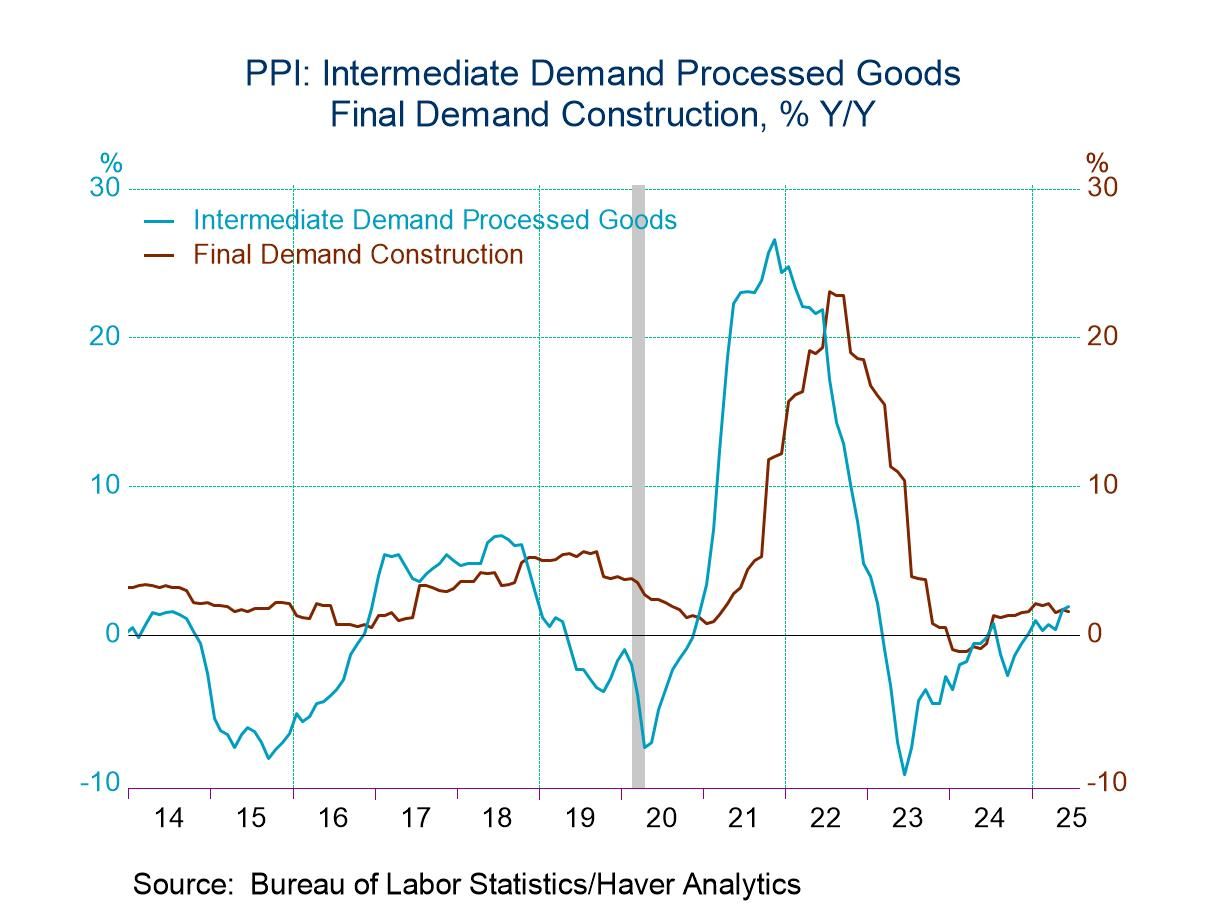
Construction costs rose 0.3% (1.6% y/y) in June after rising 0.2% in May.
Prices for intermediate demand of processed goods edged 0.1% higher (1.9% y/y) in June for the second consecutive month. Processed energy goods prices improved 0.6% following a 1.9% decline while processed foods and feeds prices fell 0.3% after rising 0.7% in May.
The PPI data are published by the Bureau of Labor Statistics and can be found in Haver’s USECON database. Further detail is contained in PPI and PPIR. The expectations figures are available in the AS1REPNA database.

Tom Moeller
AuthorMore in Author Profile »Prior to joining Haver Analytics in 2000, Mr. Moeller worked as the Economist at Chancellor Capital Management from 1985 to 1999. There, he developed comprehensive economic forecasts and interpreted economic data for equity and fixed income portfolio managers. Also at Chancellor, Mr. Moeller worked as an equity analyst and was responsible for researching and rating companies in the economically sensitive automobile and housing industries for investment in Chancellor’s equity portfolio. Prior to joining Chancellor, Mr. Moeller was an Economist at Citibank from 1979 to 1984. He also analyzed pricing behavior in the metals industry for the Council on Wage and Price Stability in Washington, D.C. In 1999, Mr. Moeller received the award for most accurate forecast from the Forecasters' Club of New York. From 1990 to 1992 he was President of the New York Association for Business Economists. Mr. Moeller earned an M.B.A. in Finance from Fordham University, where he graduated in 1987. He holds a Bachelor of Arts in Economics from George Washington University.
More Economy in Brief


 Global
