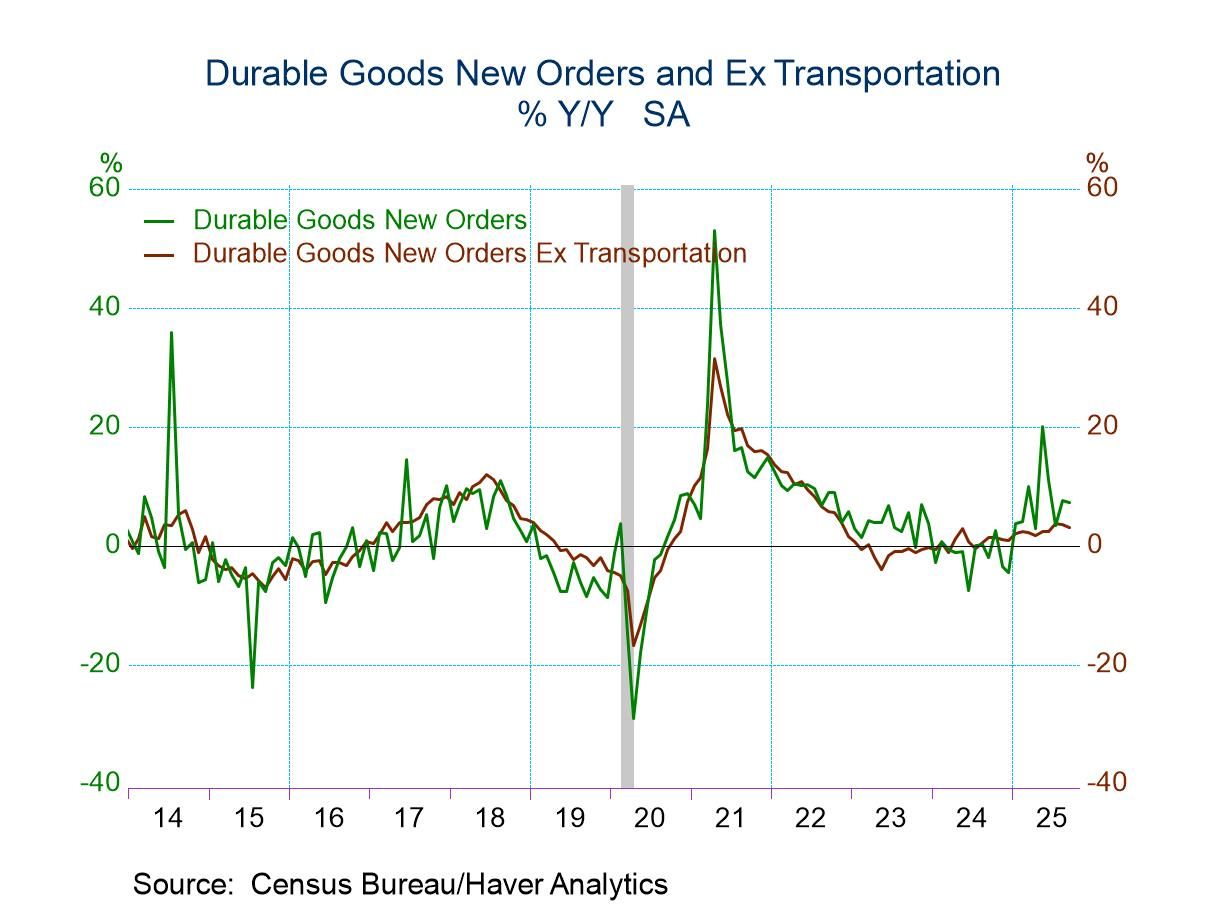
- Broad-based orders improvement follows August jump.
- Durable shipments gain reverses prior month’s dip.
- Order backlogs grow for second month; inventories ease.
by:Tom Moeller
|in:Economy in Brief
 USA| Nov 26 2025
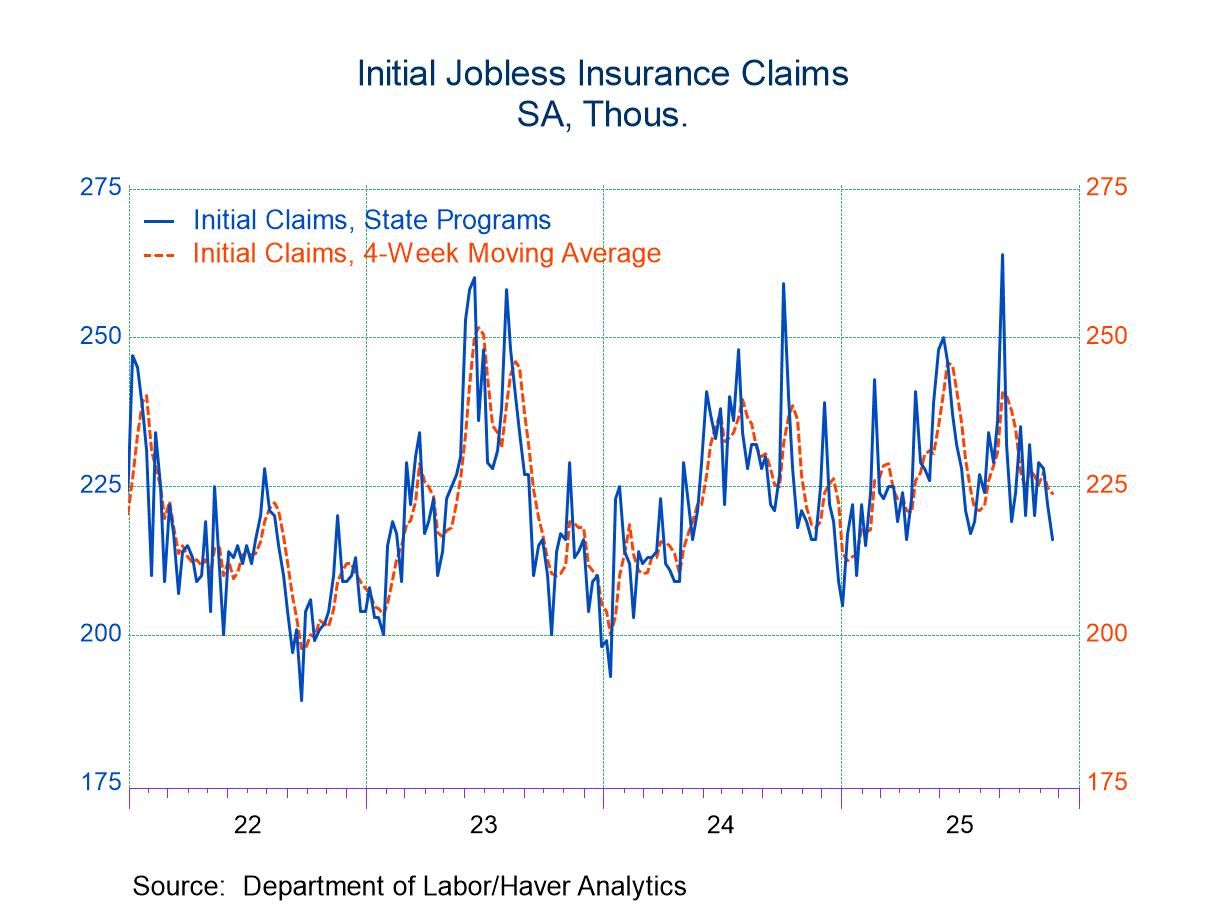
U.S. Initial Unemployment Insurance Claims Fell in Latest Week
- Initial unemployment claims fell to 216,000, the lowest weekly figure since April.
- Continued claims edged up to 1.96 million, indicating that the unemployed are still having increasing difficulty finding a job.
by:Sandy Batten
|in:Economy in Brief
 USA| Nov 26 2025
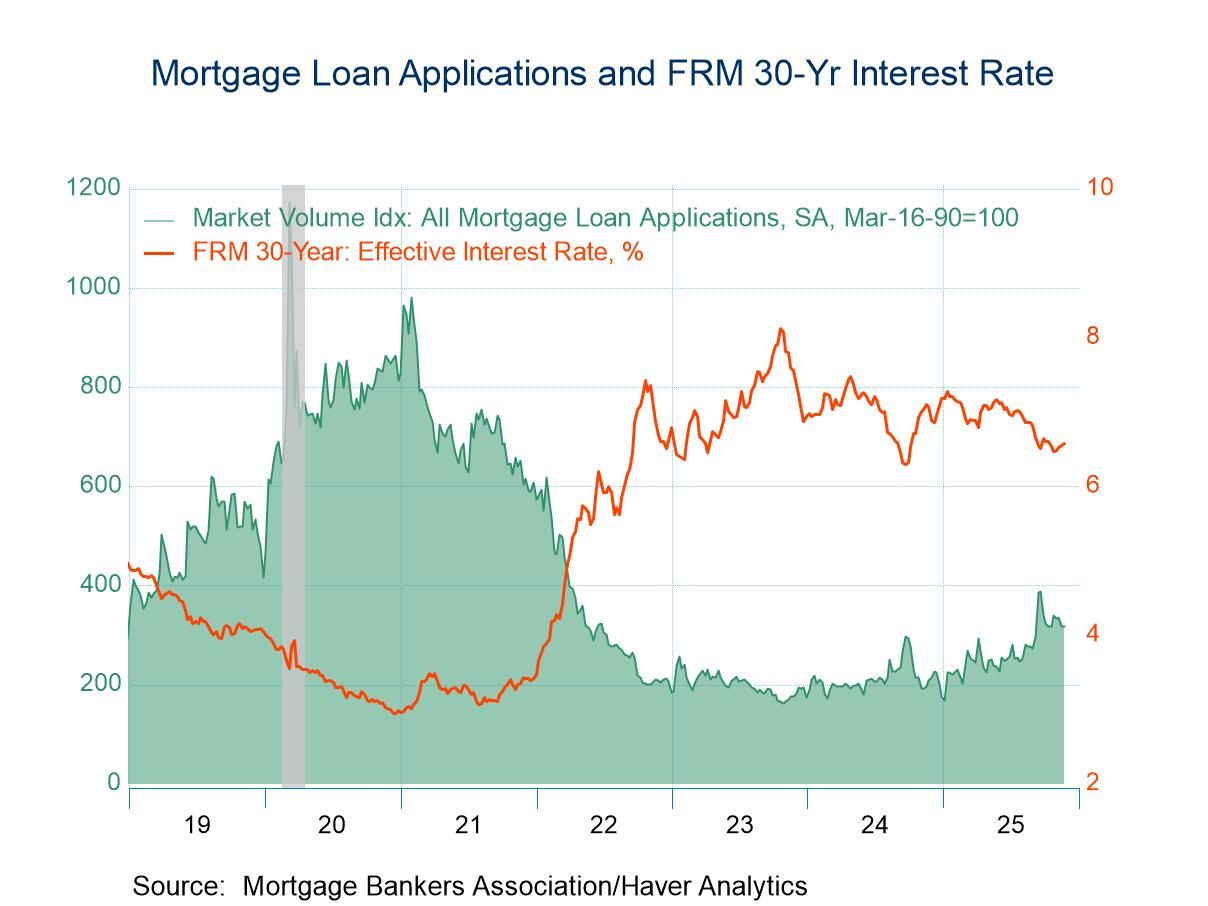
U.S. Weekly Mortgage Applications Inched Up in The Latest Week
- Applications for loans to purchase surged, while those for refinancing declined.
- Interest rates on 30-year fixed-rate mortgage inched up for the fourth consecutive week.
- Average loan size rose in the latest week.
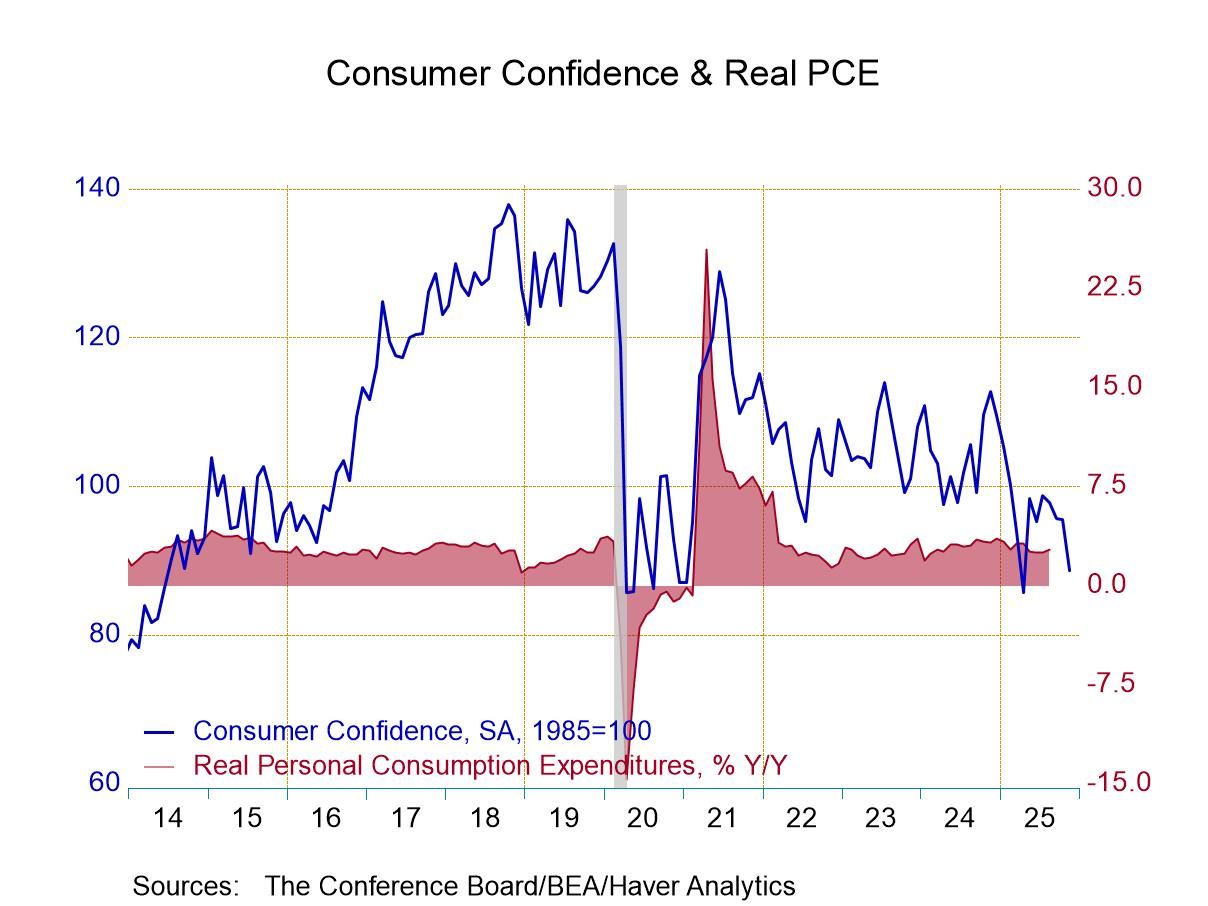
- Confidence level moves to lowest since April.
- Present situation index and expectations decline.
- Inflation expectations are contained.
by:Tom Moeller
|in:Economy in Brief
 USA| Nov 25 2025
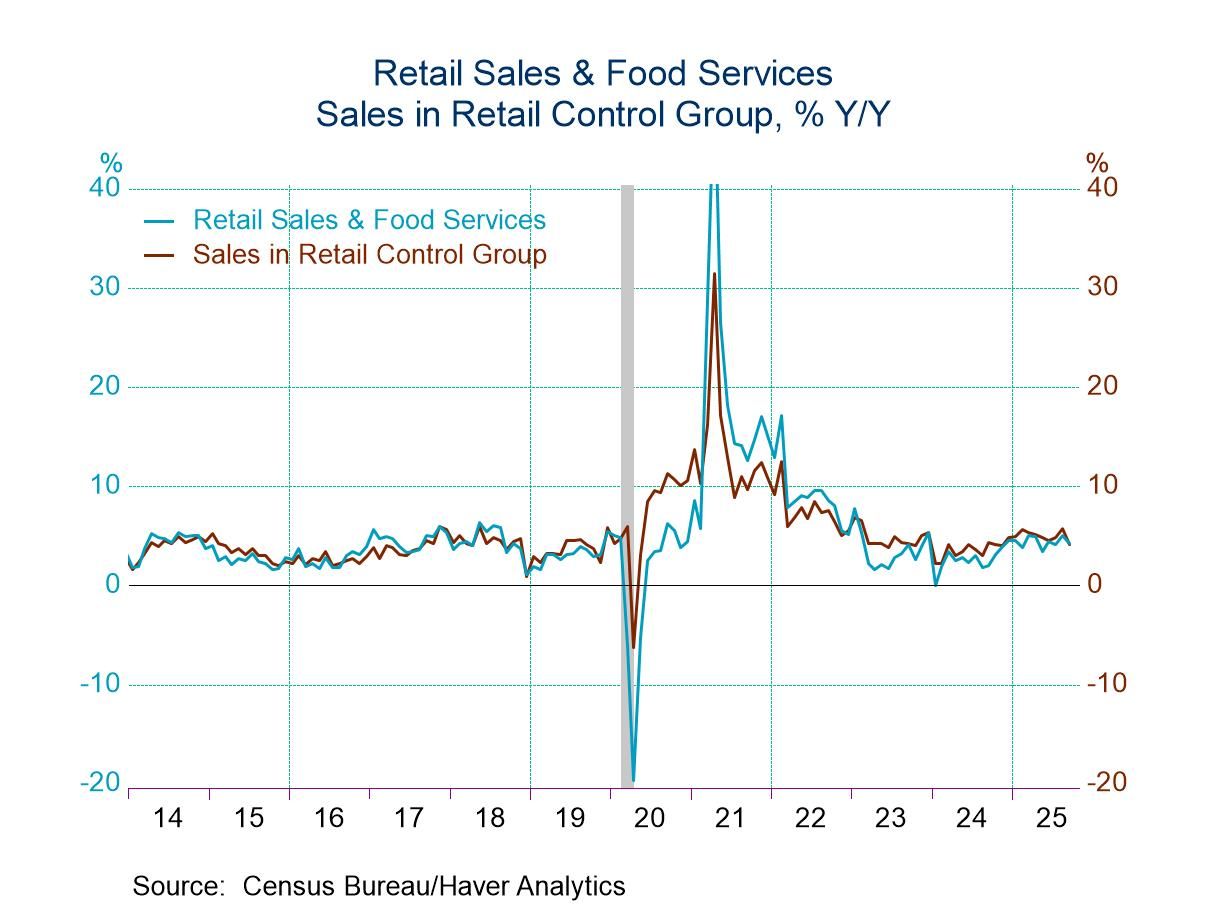
U.S. Retail Sales Post Limited Rise in September
- Auto sales decline; rise in nonauto sales is restrained.
- Sales ease in retail control group.
- Clothing & nonstore sales decline.
by:Tom Moeller
|in:Economy in Brief
 USA| Nov 25 2025
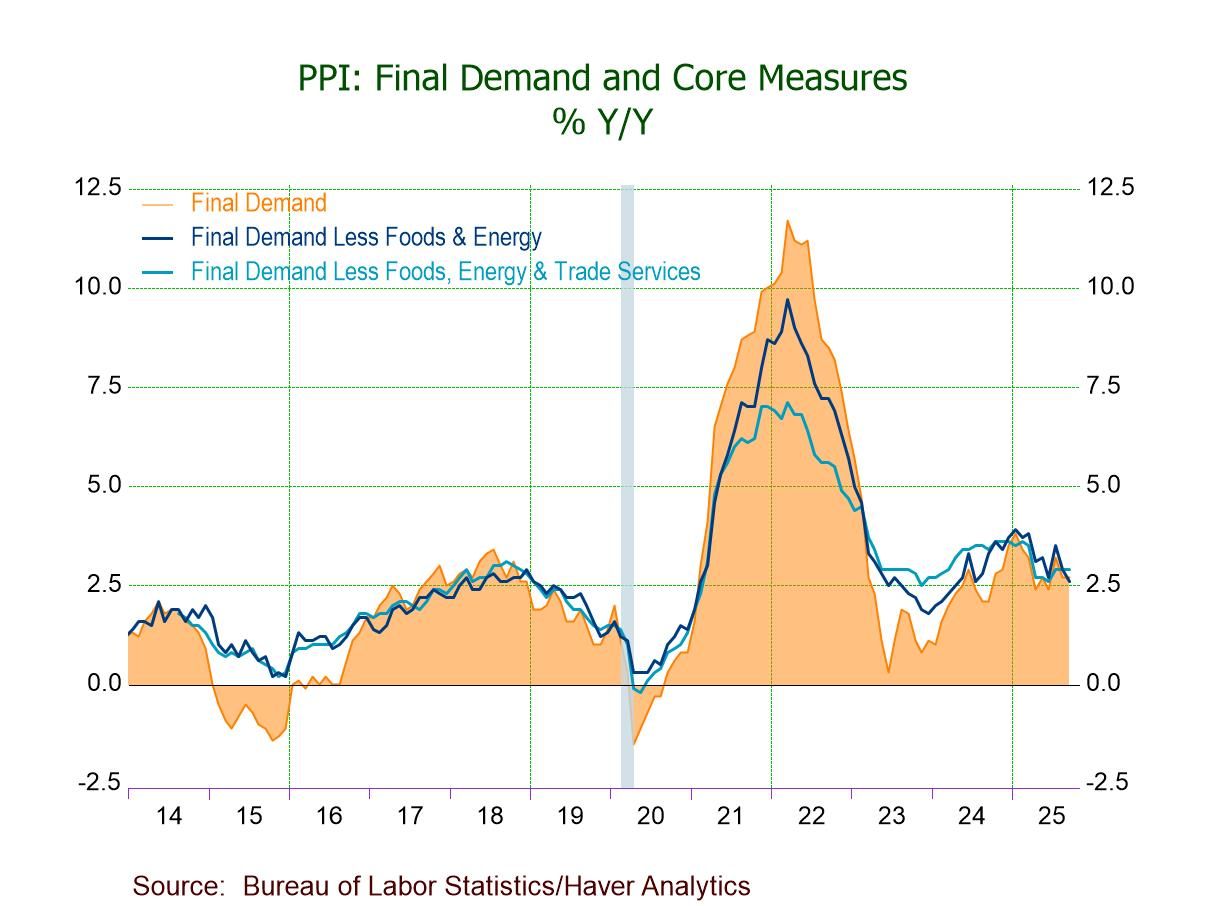
U.S. Producer Prices Rise in September Led by Energy
- Sept. PPI increases 0.3% m/m (+2.7% y/y), driven by price rises of 3.5% in energy and 1.1% in foods.
- PPI ex foods & energy edges up 0.1%; prices for both services and construction hold steady.
- Core goods prices increase 0.2% (+2.9% y/y) after a 0.3% August gain.
- Intermediate demand processed goods prices up for the fifth time in six months.
 France| Nov 25 2025
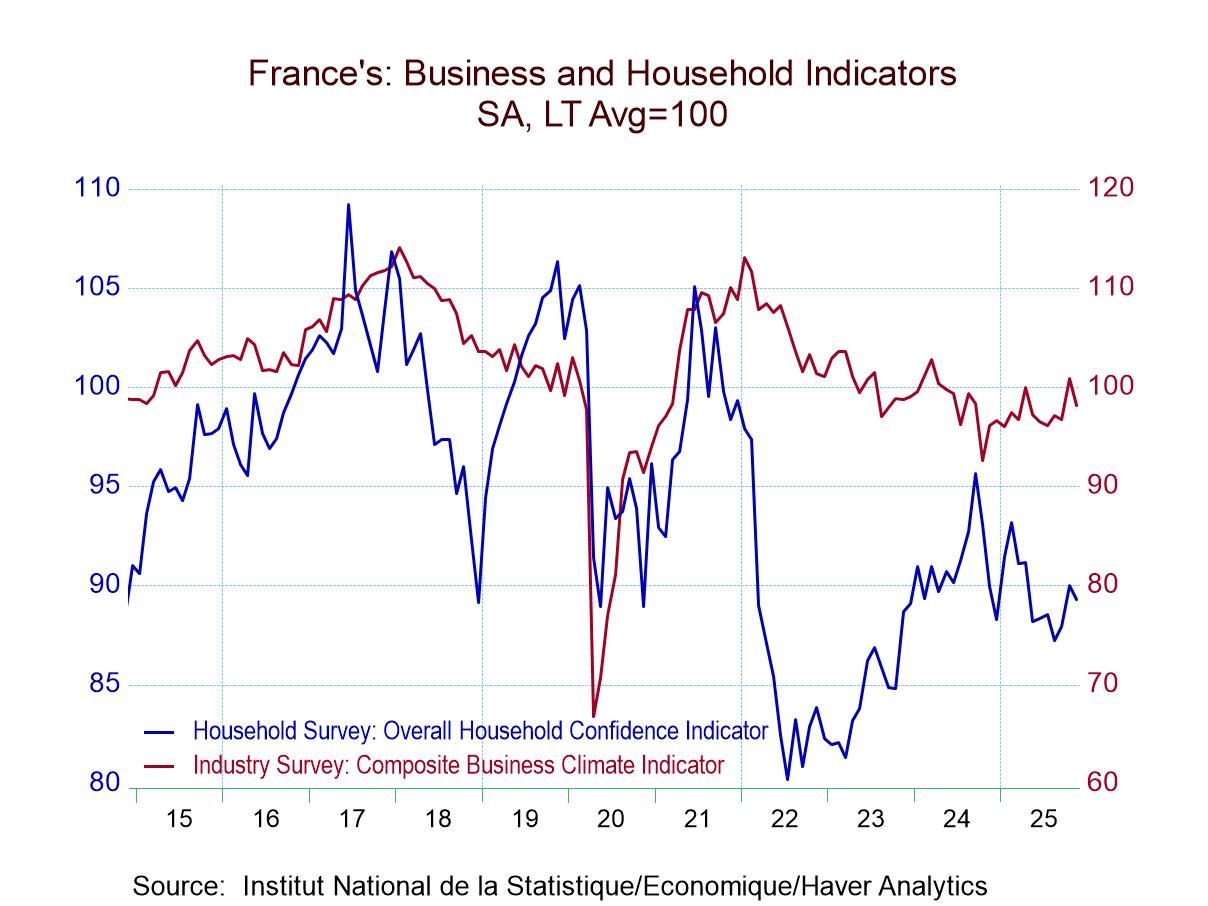
French Household Confidence Erodes Slightly in November
The INSEE survey of household confidence in France eased in November after having seen some rebound in October. The chart shows that household confidence has generally been giving back ground over the past year; that contrasts to the business climate indicator that has been stable during this period, with a very slight uptrend.
Household confidence has a 29.3 percentile (rank) standing on data back to 2001, marking the level of confidence as a lower one-third phenomenon for France in November.
Living standards over the past 12 months had been relatively stable, posting a value of -74 in November, much the same as what we see over the earlier five months and translating into a ranked standing in its lower 15-percentile, a relatively weak result. The outlook for living standards over the next 12 months is at a diffusion value of -55; however, it is still at a relatively weak 15-percentile standing. The prospects for unemployment had diminished slightly over the last five months, but currently the reading has a 62.6 percentile standing. That's a rank standing above the 50th percentile, marking it as a concern about unemployment that's slightly higher than the median for the period.
Price developments in November yield a diffusion rating of -9, very little change compared to the previous four months and with the rank standing at its 37th percentile, basically suggesting that there was not much concern about inflation over the past 12 months. The next 12-month reading is at -32 in November, unchanged from October and slightly weaker than the previous three months; however, the standing is at its 49th percentile, which is essentially at its median.
The favorability to save, at a reading of 45 in November, had stepped up slightly over the past five months, while the ability to save over the next 12 months had also crept up very slightly. Each of these metrics has a very high ranked percentile standing in the 99th percentile. Favorability to save responses are generally strongly correlated with unfavourability to spend and we see that here again with the favorability to make major purchases at a -30 reading in November and having generally slipped from the previous five months and having fallen to a percentile standing in its 16.3 percentile, quite a weak situation.
The financial situation over the past 12 months had largely been unchanged at the level of the November reading; it has a 64.3 percentile standing, above its historic median. However, for the next 12 months the financial situation, while also having improved compared to its recent history, has a percentile standing only in its 43.5 percentile.
The INSEE household confidence survey for November remains weak and continues to show soft spots. There is little evidence of firming across the components, and the trend behavior is that this index has been slipping at a slow pace over about the last year. None of that seems to be changed as of November 2025.
 USA| Nov 24 2025
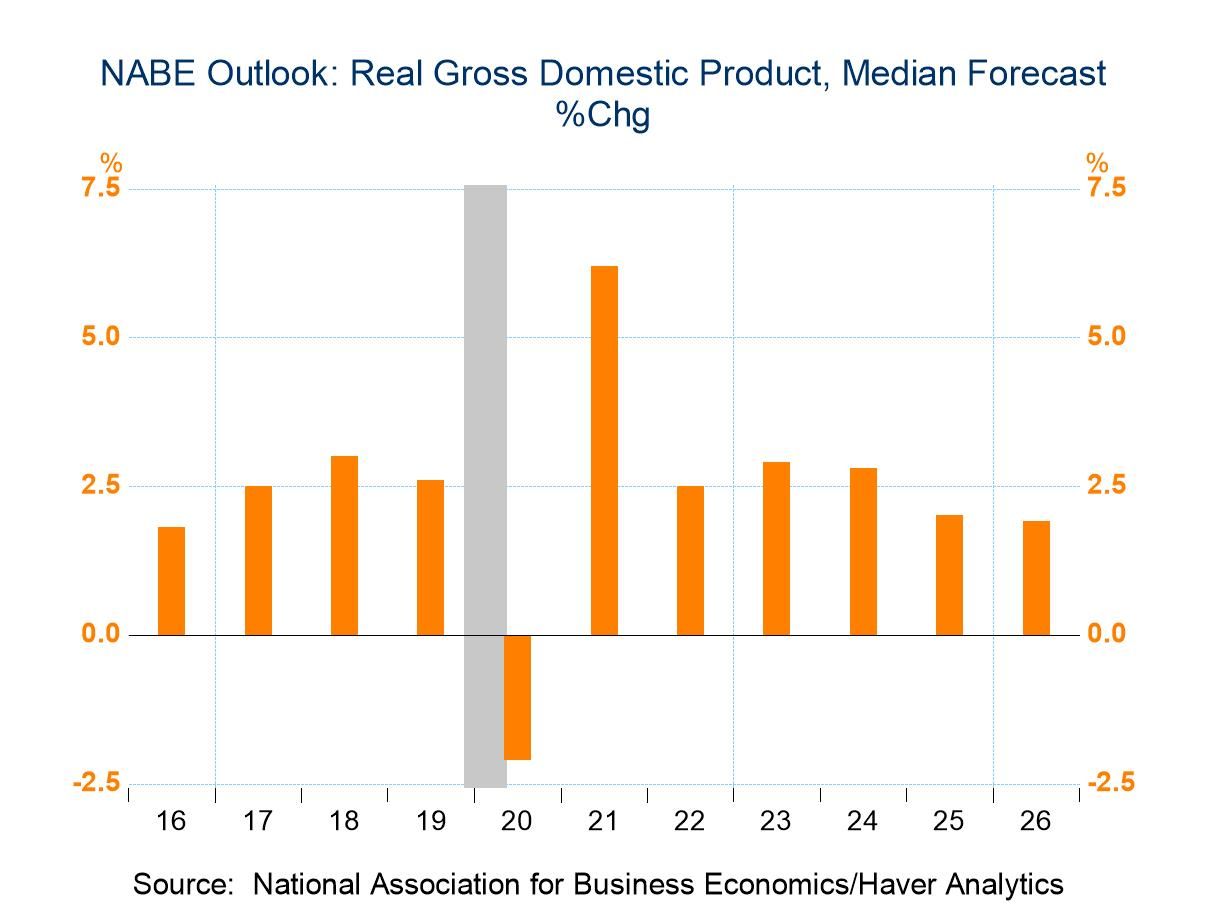
NABE GDP Growth Forecasts for 2025 & 2026 Edge Higher
- Consumer spending estimate is increased.
- Business & residential investment estimates are raised.
- Moderating inflation expectations are little-changed.
by:Tom Moeller
|in:Economy in Brief
- of2725Go to 49 page