- Energy prices rose sharply for the third consecutive month; core prices were unsettling as well.
- A jump in nominal income translated to a modest advance in real terms, allowing consumers to remain reasonably active.
 USA| Jun 25 2026
Personal Income, Consumption, and Prices in May

- May headline orders -4.5% m/m, first fall in three mths.; -3.5% y/y, first negative reading since Dec. ’24.
- Nondefense aircraft & parts -51.8% m/m vs. April’s +167.4%.
- Transportation orders -14.0%, first m/m drop since Feb.; orders ex transp. +1.3%, 13th straight m/m rise.
- Core capital goods shipments +0.3%, eighth gain in nine mths., pointing to a moderate contribution to Q2’26 GDP from business equipt. spending.
- Durable goods shipments +1.0%; unfilled orders +0.6%; inventories +0.2%.

- Q1 GDP growth was unexpectedly revised up to 2.1% q/q saar in the third estimate, up from 1.6% in the second estimate and inching past the 2.0% advance estimate.
- A meaningful downward revision to imports was the primary factor behind the upward revision, leading to a much smaller subtraction from net exports.
- Personal consumption expenditures growth was revised down to 0.5% q/q saar, the slowest pace since Q1 2022, due mostly to a downward revision to household spending on financial services and insurance.
- With the downward revision to import demand and PCE, domestic demand growth was revised down meaningfully to 1.7% q/q from 2.4%.
by:Sandy Batten
|in:Economy in Brief
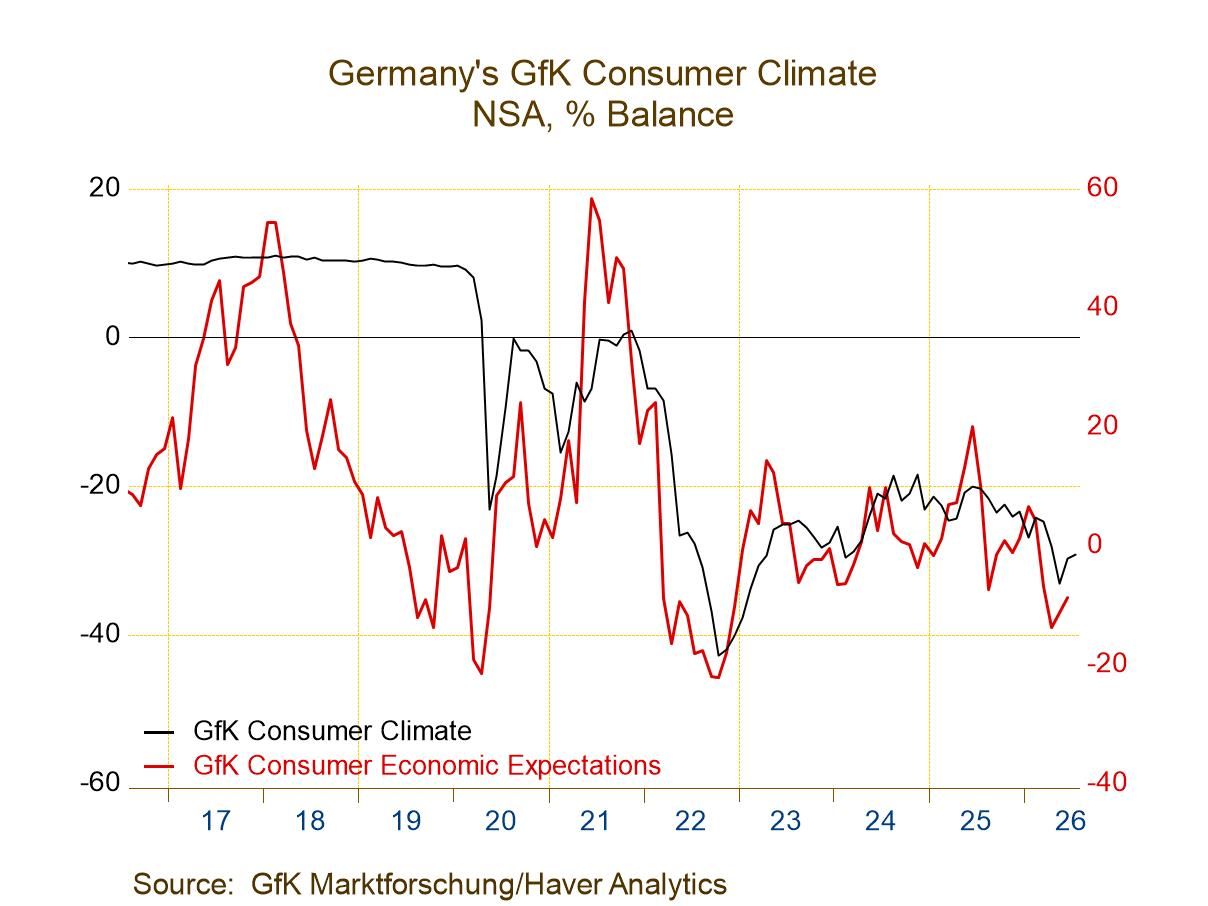 Germany| Jun 25 2026
German Confidence Edges Up but Remains in Deep Doldrums
German consumer climate, as measured by the GfK survey for the month ahead of July, posted a reading of -29.2, a slight improvement from -29.7 in June. This is the second consecutive monthly improvement, slight though it may be, in the reading for climate. The ranking of this reading on data back to 2002 finds that it has been weaker only about 4% of the time on this timeline. The reading for climate remains extremely weak in Germany, despite the slight up-creep over the past couple of months.
The components for the climate index are up to date only through June. On that basis, there was a small increase in economic expectations, a small increase in income expectations, and a smaller decline in the rating for the propensity to buy, a consumer spending metric. The reading for economic expectations in June has a 22.4 percentile standing, the reading for income has a 14.6 percentile standing, and the reading for the propensity to buy has a 23.8 percentile standing. All three of these metrics have readings that are in the lower quartile of their range of readings back to 2002. The headline reading is substantially weaker in its ranking than the three components; however, these are for different timelines—the headline is for July, while the components are for June. The weaker climate standing may simply reflect the confluence of the weak readings for these three components, marking that as a more unusual event than the stand-alone rankings of each one by itself. In any event, there is little in the German survey to give much confidence that conditions in Germany are significantly improving, let alone getting better.
The table also includes consumer confidence readings for other EU members, specifically Italy and France, as well as for the nonaligned United Kingdom. Italy's reading is up to date as of May, while the French and U.K. readings are up to date as of June. The recent Italian reading ticked up slightly, from 90.8 in April to 93.4 in May. The May reading for Italy has a 60.3 percentile standing, much better than the readings for the German headline, France, or the U.K. The French reading, at 84, is improved from 82.4 in June but still has only a 6.8 percentile standing, an extremely weak standing comparable to the headline standing for German climate. The U.K. reading is stuck at -23 for two months in a row, which produces a 26.9 percentile standing, another weak reading and a near 25-percentile low reading for the U.K.
These various readings span months ending in May, June, or July; the signals they emit are consistent that consumer confidence is quite weak in Europe—extremely weak in Germany and France, quite weak in the U.K., and only Italy produces a number where the ranking is above its 50th percentile, putting it above its historic mean of readings over data back to the year 2002. Italian consumer confidence readings have tended to be more resilient than those of other countries recently.
 USA| Jun 24 2026
U.S. New Home Sales Unexpectedly Hit a Four-Month Low in May
- Sales -7.3% m/m (-6.8% y/y) to 580,000 in May; down 23.4% from a November high.
- Sales m/m down in the West (-26.9%) and South (-4.1%); up in the Midwest (+16.2%) and Northeast (+3.0%).
- Sales y/y down in all regions except the Northeast (+17.2%).
- Median sales price +2.0% m/m to $424,900, a 5-month high; avg. price +7.8% m/m to $540,600, highest since July ’22.
- Months' supply up to 10.3 mths., highest since July ’22.
 USA| Jun 24 2026
Q1 Current Account: Modest Slippage in Early 2026
- Improvement in the trade balance offset by weaker net investment income.
- Annual revision showed wider deficit in 2025.

 Global| Jun 23 2026
S&P PMIs in June Firm
PMIs in June mark some progress The PMI report from S&P shows modest firming in conditions in June, even with the Middle East situation unresolved.
Monthly: The median reading for the 8 reporting countries or regions rose to 50.8 in June from 50.1 in May. Manufacturing improved to 52.7 from 52.4, while the services reading rose to 50.3 from 49.6, leaving a month of mild contraction behind.
Most show June improvement: Most countries or regions improved in June; the exceptions were Germany, the United Kingdom, and India, which were weaker. India was dragged down by a weaker service sector reading in June; the U.K. and Germany showed weakening conditions across the board for the composite index, the manufacturing sector, and services. On the other side of the coin, France, Japan, Australia, and the U.S. all showed improvement in each of three sectors: the composite, manufacturing, and services, in June compared to May.
Sequentially still mixed: The broader sequential readings show ongoing weakness, but these are derived from hard data and lag the monthly observations in the table that include preliminary flash estimates. All the composite readings weakened based on three-month averages except for India. However, seven of eight reporting areas showed improvement in manufacturing over three months compared to six months; the exception was Australia. Over six months, conditions are mixed, with four composite readings weaker compared to 12 months and with four stronger. However, over six months, all eight manufacturing sectors improved compared to 12 months. The 12-month readings are consistently stronger than their readings of 12 months ago. The only composite that's weaker is the U.S., while the services sectors in the monetary union, Germany, France, and the U.S. are weaker than they were 12 months ago.
Standings are weak: The queue percentile standings evaluate the current diffusion index in June compared to where it has been since January 2022, a period of about 4½ years. The queue standings show weakness up and down the line, with the exception of the manufacturing sector; that has the standing above its historic median in the monetary union, Germany, France, the U.K., the U.S., and Japan. Only Australia and India show manufacturing sectors whose current monthly standings are below their medians of the last 4½ years. In addition, Japan has a strong composite reading at its 81st percentile. Overall, the services sectors are weak and below their 50% standing every place, and below that mark by a large margin, except for Japan, where the services sector has a 47th percentile standing, only a few ticks below its median.
 Denmark| Jun 22 2026
Danish Confidence Improves As Inflation Expectations Pull Back Sharply
Danish consumer confidence rose to -14 in June from -19.8 in May, a small pickup for a still-negative net reading. In June, the reading has a standing at its 7.9 percentile on data back to 1995. So, this confidence headline still has a lower 8% reading overall.
On the month, all seven component readings improved compared to May, although the environmental assessments were little changed across four components. As for the environment, the most changed reading is the improved favorability of the time to save, a metric that is not always a positive category.
As for the seven categories, the readings on the financial situation, general economy and the unemployment rate all improved month-to-month, while the inflation metrics both backed down sharply.
These changes show the financial situation and general economy gauges all at rankings in the lower 20th percentiles, with the outlook for the next 12 months having a standing in their lower 10th percentiles and lower for both the financial situation and the general economy.
Consumer prices, despite a strong monthly step-back, have a 90.2 percentile standing for prices over the past 12 months and a 94.3 percentile standing for the CPI over the next 12 months. Despite some let-up in concerns about unemployment, the unemployment gauge has an 85.1 percentile standing, still substantially elevated.
The environmental readings are less negative, starting with the ‘favorability of the time to purchase,’ a bit weaker month-to-month but improved on balance over two months. The June reading is slightly better than its 12-month average but still has a ranking only in its 21st percentile. The favorability of the time to purchase over the next 12 months is a tick weaker month-to-month and about a point worse than its 12-month average. Its June ranking is in its lower 10th percentile of its historic queue. The favorability of the time to save has a stronger ranking, but this is a more equivocal category. It is improved month-to-month and only slightly stronger over two months The June reading is stronger than its 12-month average, with a ranking in its 47.6 percentile—improved compared to previous categories but still worse than its historic median since 1995 (the median occurs at a ranking of 50%). The ‘general financial situation of households now’ ticked lower in June from May but is stronger on balance over two months. The June reading is above its 12-month average and has a 59.2 percentile standing—above its median.
On balance, Denmark shows improving confidence, progressing slowly but on the right path. There is a sharp downward adjustment in inflation, especially over the next 12 months, despite global conditions. Still, the ranking of the confidence metrics are uniformly weak.
- of7Go to 2 page