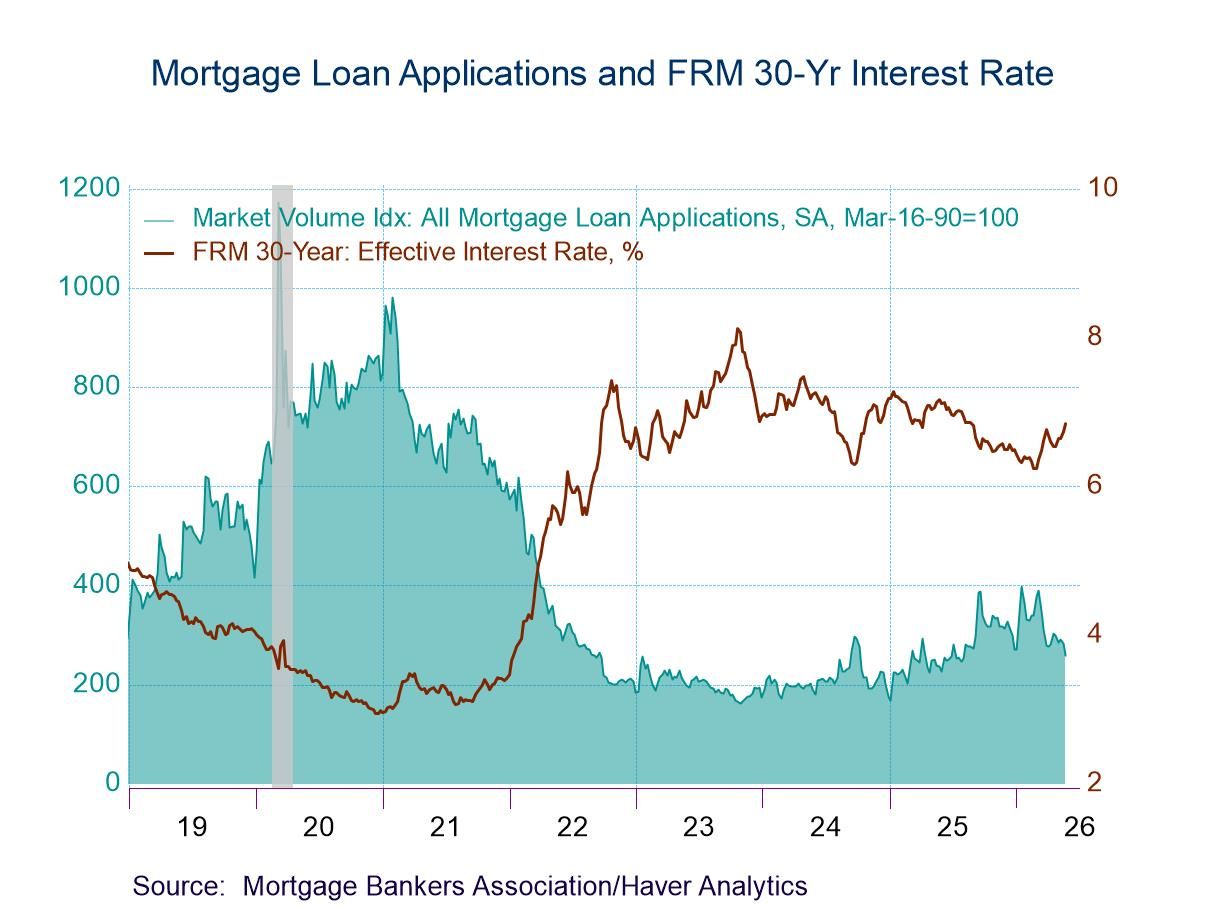
- Both applications for loans to purchase and applications for loan refinancing declined in the latest week.
- Interest rate on 30-year fixed-rate loans rose 11bps to 6.73%, after rising 9bps in the prior week.
- Average loan size rose.
 USA| May 27 2026
U.S. Mortgage Applications dropped in the May 22 Week
 France| May 27 2026
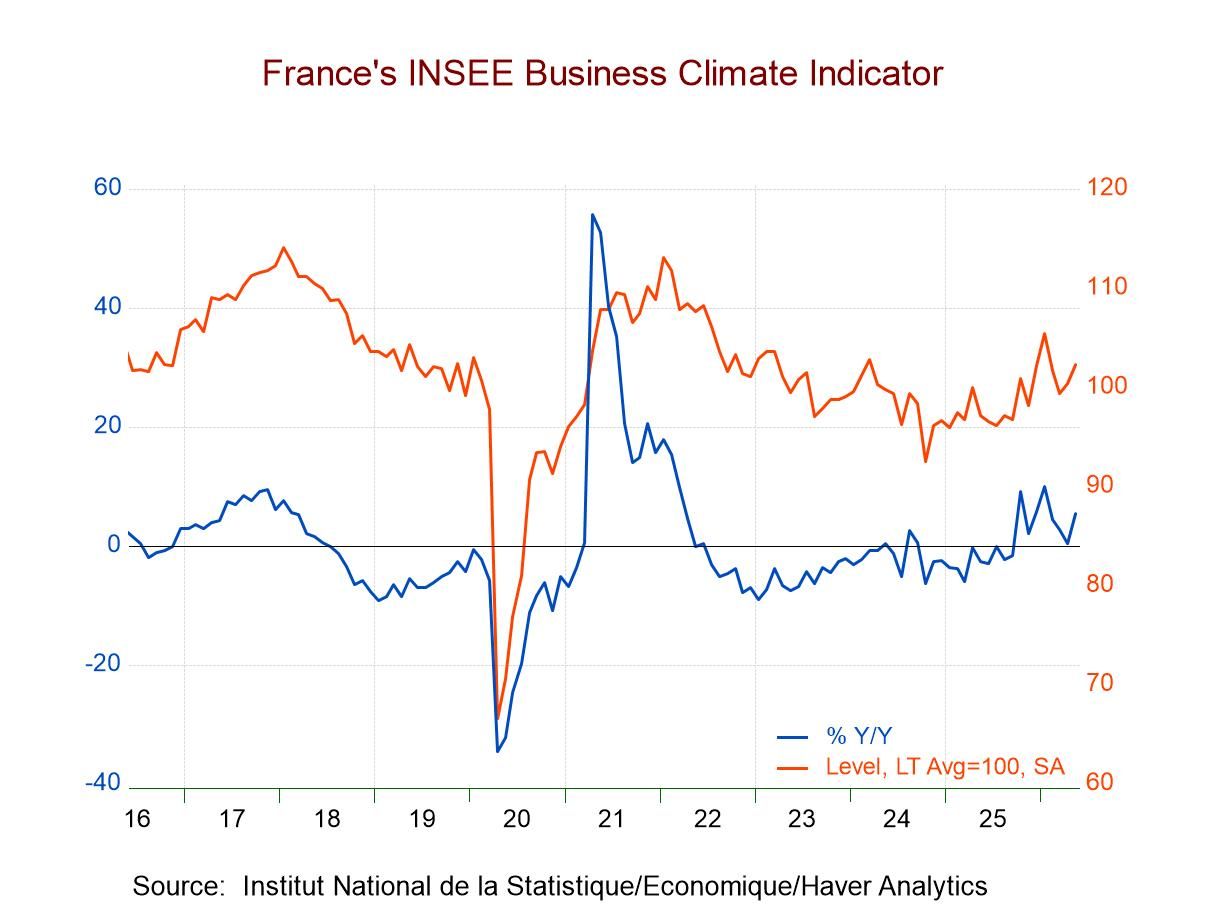
INSEE: French Manufacturing Rebounds Amid Weakness
The French manufacturing climate index improved in May, rising to 102.3 after climbing to 100.4 in April from 99.4 in March.
Despite the improvement, the standing of the climate index is only at its 50.4 percentile, leaving it just slightly above its historic median on data back to 2001. Industry climate now is still slightly lower than it was in January 2020, just before COVID hit.
The survey components tell a mixed story about prospects for industry in France. Manufacturing production expectations improved slightly in May, moving to -17.0 from -17.4 in April; however, both readings were sharply weaker than the value in March. The standing of production expectations in May is at its 25.4 percentile, marking it as just a hair above its lower quartile when ranked on data back to 2001. This is a weak and uninspiring showing.
The recent trend of production is much more upbeat, rising to 14.3 in May from 3.6 in April. It also shows a sharp improvement compared to a year ago, when the value was 3.7. Its standing is significantly above its historic mean, and the ranking for this May observation is at its 82nd percentile—a solid showing. It is the strongest response in the survey among demand and activity variables. But can that trend hold?
The personal likely trend, in which survey respondents respond to prospects for their own firms and industries, shows much less ebullience, with the May reading of 4.4 and a steadily diminishing trend from March to April to May. The personal likely trend is still stronger than a year ago, when it was -3.1, although it is significantly below its historic mean, with a ranking at its 28th percentile. It is a reading that is nearly completely decoupled from the recent trend responses in this same survey.
Orders and demand in May improved to -14.1 from -15 in April; in April, the index had improved from -18.2 in March. There is a similar trend and improvement for foreign orders and demand as well. Both overall and foreign demand are improved compared to a year ago; both are stronger than their historic means, and each of the series has a ranking in its 61st percentile—above their respective historic medians with some margin, enough to say the responses look firm. Yet, there is not enough to say they look strong. Both readings are still below their levels in January 2020, before COVID struck.
The INSEE survey also includes two observations on prices: the own-likely price trend and the manufacturing price trend. Both have been moving up sharply from March to April to May; both are significantly above their year-ago levels and relatively strong compared to their historic means. Both series also have high percentile rankings, with the own-likely price trend at a 90.2 percentile ranking and the manufacturing price level at an 88.5 percentile ranking. Both are also substantially above their levels of January in 2020, before COVID struck.
 USA| May 26 2026
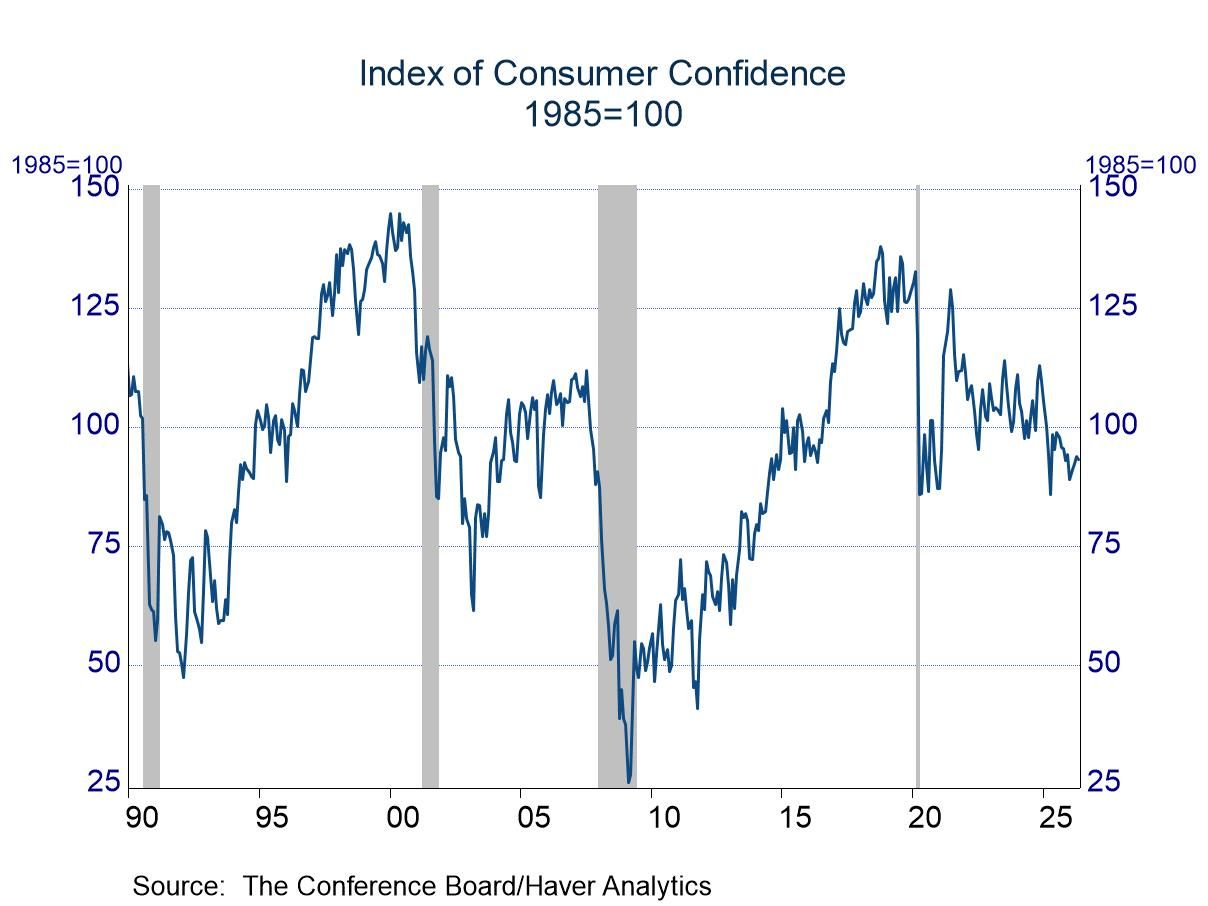
Consumer Confidence: Slightly Lower in May
- Assessments of the present situation slipped, but views were still above long-run norms.
- Expectations improved slightly in April, but they are still below the long-run average.
 USA| May 26 2026
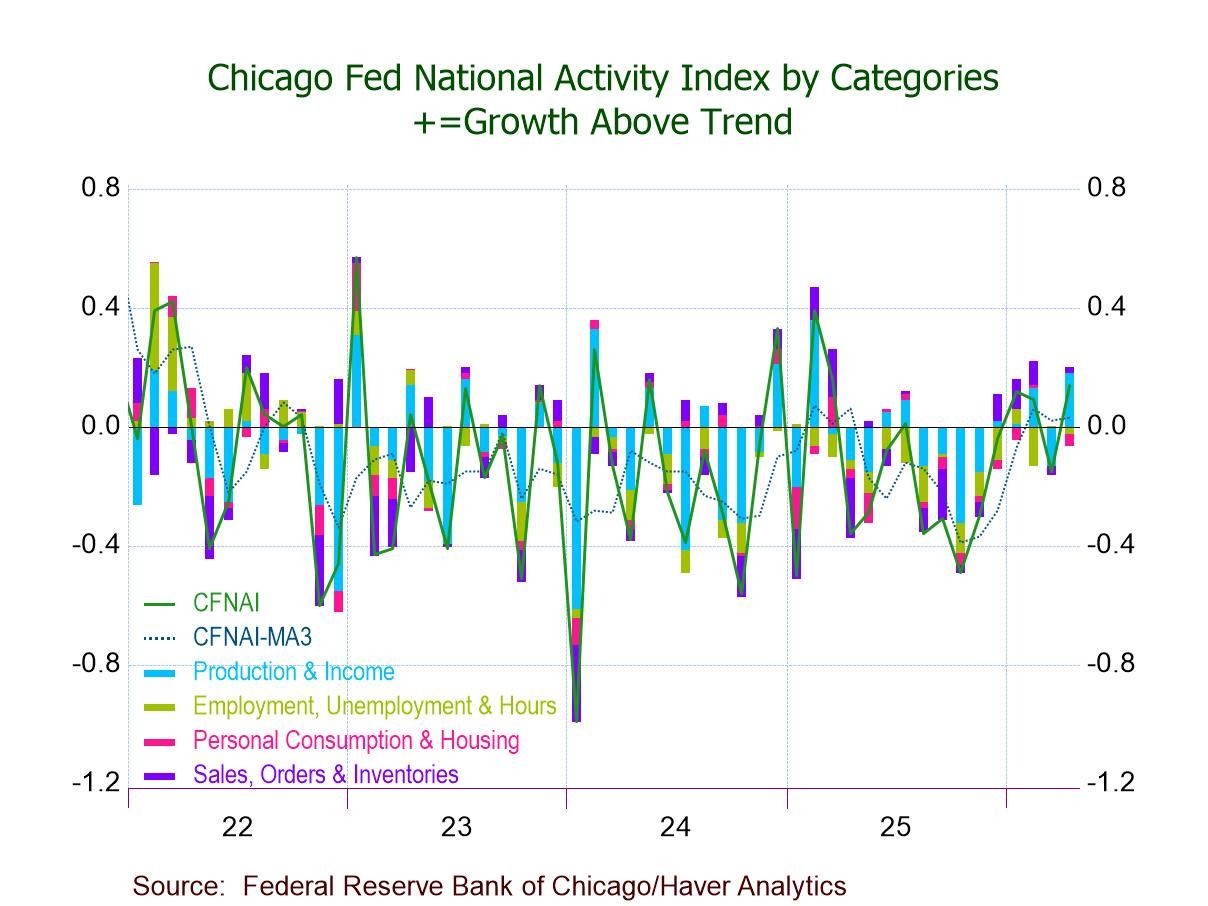
Chicago Fed National Activity Index Turns Positive in April
- CFNAI +0.14 in April, highest since March ’25; -0.15 in March.
- Two of four CFNAI components up m/m; two make positive contributions.
- CFNAI-MA3 edges up to +0.03, third straight positive reading; above -0.70 (recession signal).
- CFNAI Diffusion Index rises to +0.06, highest since Oct. ’22.
 United Kingdom| May 26 2026
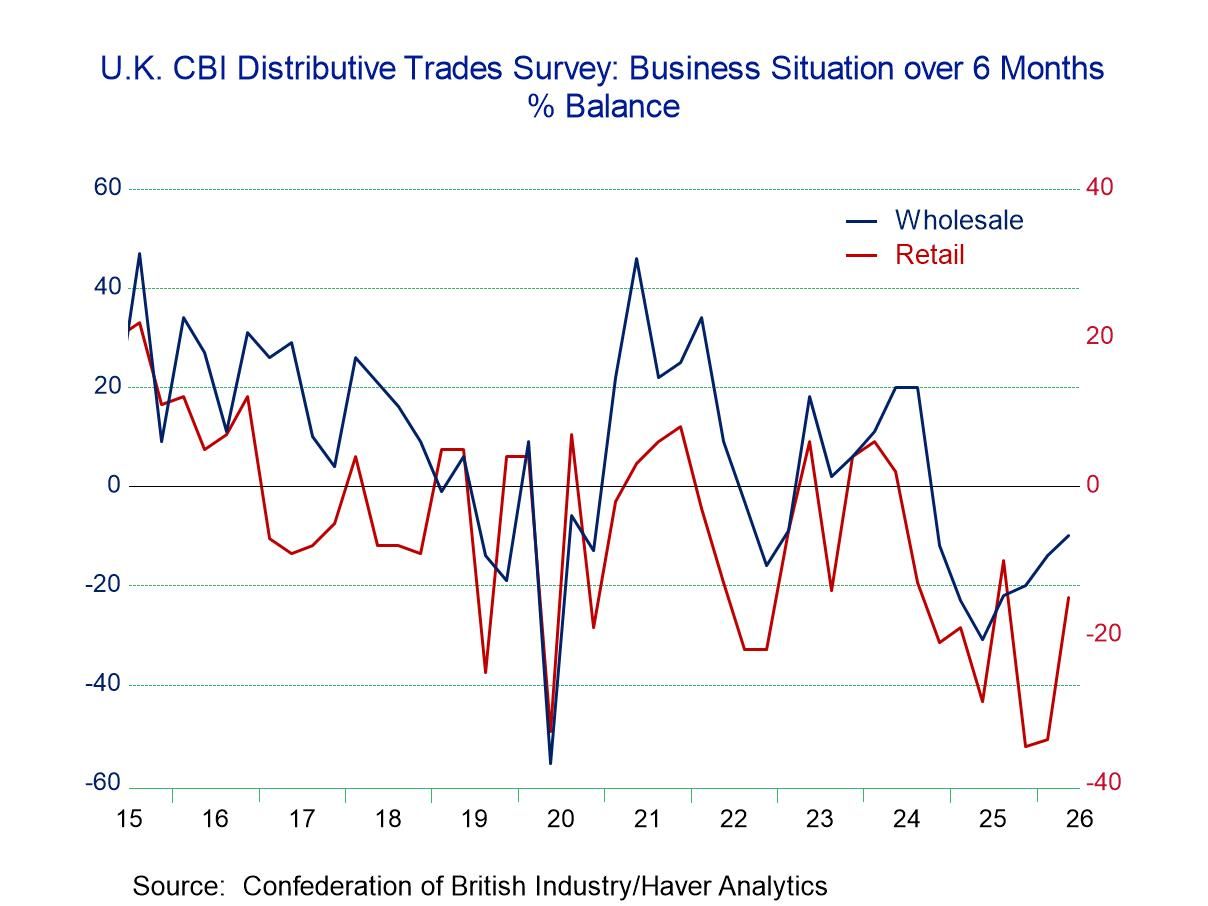
U.K. Distributive Trades Survey Is Broadly Weak
The U.K. distributive trades survey in retaliating for the second quarter of 2026 shows some improvement in the business situation expected over the next six months as that reading rose to -15 from -34 in the first quarter, putting it only slightly weaker than its third-quarter 2025 reading of -10. Still, it is a very weak reading.
The employment reading also improved in the second quarter to -30 from -40 in the first quarter. That reading, however, is still lower than its -19 reading in the fourth quarter and its -14 reading on the third quarters of 2025.
Capital spending plans on the quarter for the year ahead registered -52 in the second quarter, compared to -46 in the first quarter; this reading has steadily deteriorated.
Imports have improved slightly in the second quarter, with the reading at 7 compared to 10 in the first quarter and 13 in the fourth quarter.
The expected selling price compared to what it registered a year ago is at 42, compared to 40 in the first quarter; they compared to even stronger values at the end of last year. Expected employment in the second quarter fell sharply to -44 from -23 in the first quarter, and this reading has steadily and strongly deteriorated, particularly in the second quarter itself.
Comparing the trailing 4-quarter to 8-quarter averages shows clear deterioration across the board, except for prices. That clarifies the overall story and trend for retailing.
The retail rankings are uniformly weak, with the exception that the selling price has a 43.6 percentile standing, which is still below its historic median ranking. However, the standings for imports, capital spending, and employment are all below the 10th percentile, with the business situation coming in an 11.4 percentile standing. The expected selling price has a 63.6 percentile standing, well above its historic median (the median occurs at a ranking of 50%). Meanwhile, employment, looking ahead, has only a 2.9 percentile standing, clearly not much of a vote of confidence in the outlook for the economy.
The wholesaling portion of the distributive trades report also registers weak standings, but they are higher than those seen in retailing, with the business situation at an 18.6 percentile standing, imports at a 25.7 percentile standing, and employment at a 17.1 percentile standing, while capital spending plans are at a very weak 5.7 percentile standing. All these metrics are generally stronger than for retailing; they're still poor readings and generally below their respective medians. The only exception is the selling price with a 77.9 percentile standing, which is only a vote of confidence for inflation. The expected selling price compared to a year ago has a 44.3 percentile standing, while employment expectations compared to a year ago are at a 35-percentile standing.
Similarly, in wholesaling as for retailing, the comparison of 4-quarter to 8-quarter averages shows across the board deterioration, except for prices. The distributive trades sector for retailing as well as for wholesaling is fading.
Summing up The United Kingdom distributive trades survey is telling us clearly that it is a weak environment for the distributive trades. The standings of the current readings are weak, and the outlook and forward-looking portions of the survey are weak as well. The economy continues to fight inflation that has been over the top for some time, and inflation is still above target, keeping the BOE inflation-vigilant. Global conditions are mixed with the cutoff of goods shipments through the Straits of Hormuz impacting economies globally. The second quarter survey is a depressing statement on the state of the outlook for the U.K. economy.
 Asia| May 26 2026
Economic Letter from Asia: Fiscal Strains
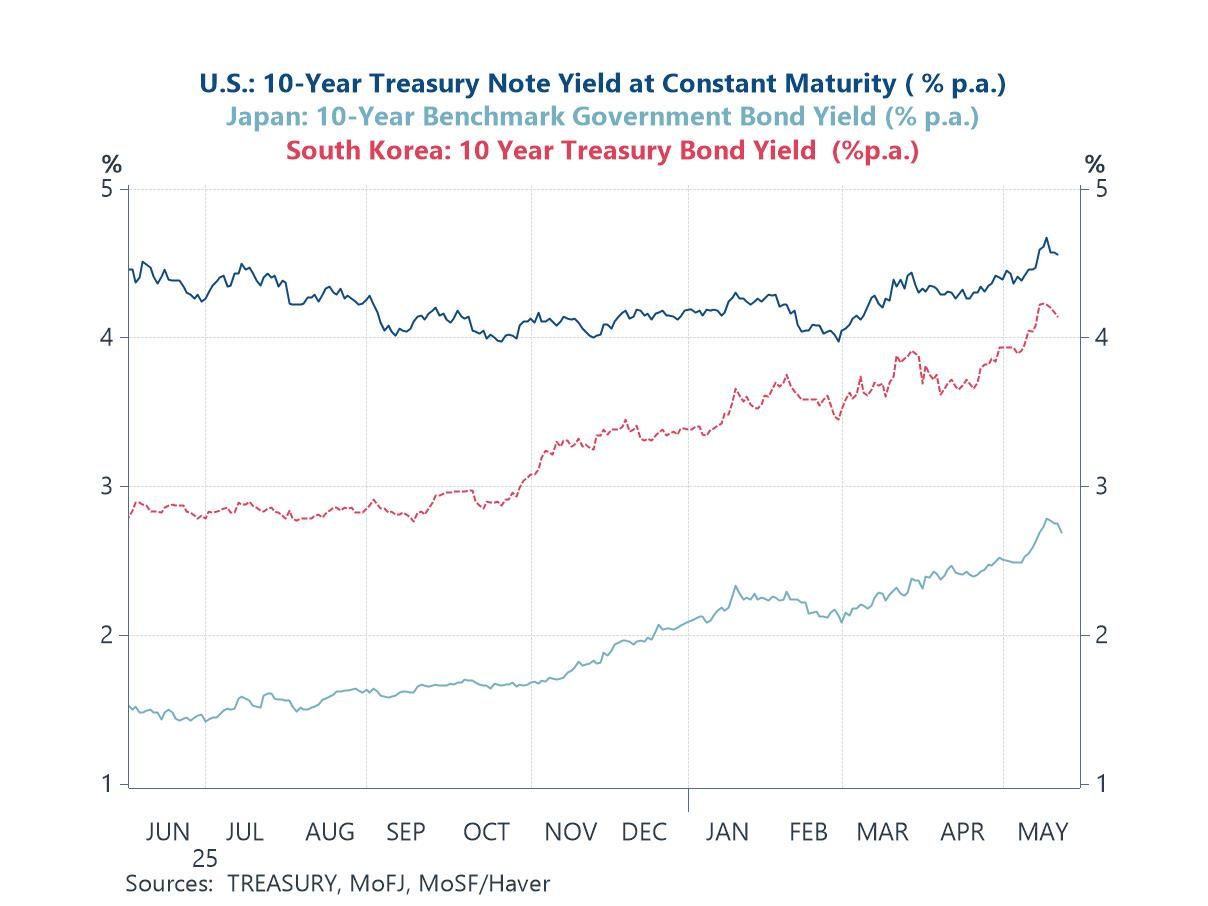
In this week’s Letter, we examine the ongoing Middle East situation through another lens — namely, the fiscal costs it has imposed on Asian economies and the strains that are already beginning to emerge. While the recent surge in bond yields has largely been attributed to inflation-related concerns, yield spikes in some Asian economies have also arguably been driven by fiscal concerns, as governments step up bond issuance to finance support measures (chart 1).
In India, cracks are beginning to show in its fuel subsidy programme, with fuel prices now being raised as previously subsidised rates appear increasingly unsustainable, underscoring the inherently finite nature of such measures (chart 2). While Indonesia continues to hold the line by keeping Pertalite fuel prices unchanged, hikes in more premium fuel grades, coupled with the government’s broader slate of spending initiatives, have left investors increasingly on edge over the country’s fiscal sustainability (chart 3). In Japan, the cabinet is reportedly seeking to put together an additional budget to help cushion inflationary pressures stemming from the Middle East conflict. Although the Prime Minister has sought to allay concerns over additional bond issuance, broader fiscal concerns remain (chart 4).
Against this backdrop of fiscal strain , inflation risks, and geopolitical instability, it is also important to keep in mind the growth-supportive factors still in place across parts of Asia. In particular, the ongoing AI upcycle continues to support exports in several regional economies (chart 5). Taking these crosscurrents into account, we then turn to the week ahead, where central banks will continue to navigate the trade-off between growth and inflation amid a heavy slate of upcoming data releases, particularly across East Asia (chart 6).
Bond markets Global yields have remained elevated, although some pullback has been seen in recent days (chart 1). Inflation-related concerns arising from elevated oil prices linked to the Middle East conflict remain front and centre and are still widely cited as the main driver of the recent spike in nominal yields. However, other factors are also at play, particularly in certain economies. Contributing to the rise in yields in some economies are fiscal concerns. Regarding the US-Iran situation, hopes for a peace deal have once again been raised in recent days, only to be subsequently dampened, underscoring how little concrete progress has ultimately been made. In addition, fresh US strikes on Iranian missile launch sites and boats highlight the continued fragility of the situation. On balance, the world remains stuck in a state of limbo, holding its breath for a positive peace outcome — particularly the reopening of the Strait of Hormuz — while the economic effects of its closure continue to weigh on the global economy.
 Germany| May 22 2026
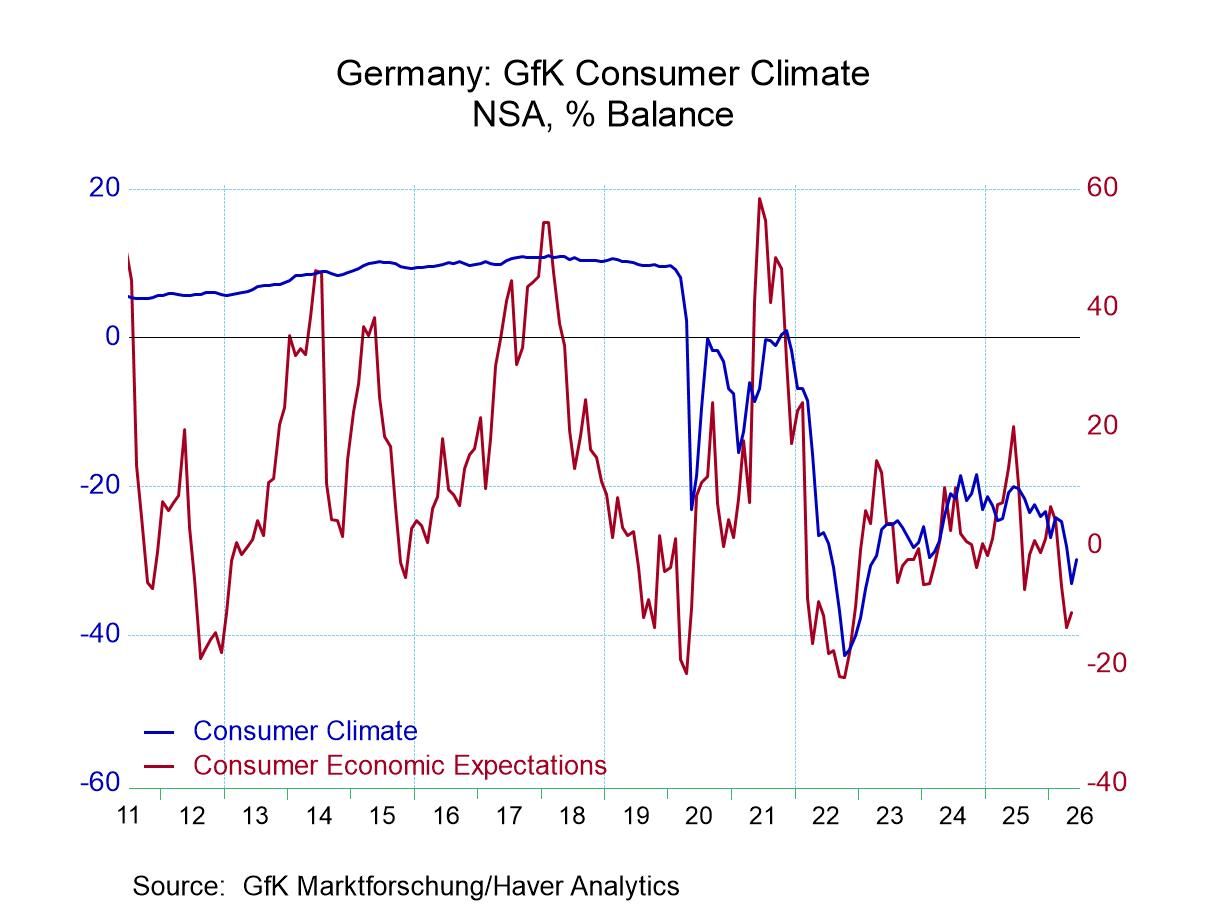
German Confidence in June (GfK) Remains Extremely Weak
GfK consumer climate for Germany improves slightly to -29.8 in June from -33.1 in May. In terms of monthly point changes, it's a reasonable improvement month-to-month however this is now the 10th weakest monthly consumer climate reading over the last 25 years and so it's an extremely weak reading. Last month was an even weaker reading, but that was the 7th weakest reading all time for this index. All the other even weaker readings were during Covid. This is a very weak report, it ranks 286th out of 296 observations.
A very weak month despite some technical improvement GfK projects a climate figure for June, however, it's underlying data for components are up to date through May. As of May, economic expectations improved slightly to -11.2 from -13.7. Income expectations improved a lot more to -13.0 from -24.4. However, that -24.4 figure was a collapse from -6.3 the month before, so that the rebound in May still leaves a significant net decline over the last two months. We should not be too focused on the month-to-month improvement. Income expectation’s April reading was likely a shock reaction to global events in the Middle East. The propensity to buy index improved to -13.2 in May from -14.4 but once again it's a case of there still being a 2-month decline on the books since the March reading was -10.9 for the propensity to buy. The even weaker propensity to buy readings historically were all in the wake of Covid.
Very weak rank standing On the whole it's another week reading from the GfK survey. This is further underscored by the rank- or the count-percentile standing of the headline which stands in its lower 3.1 percentile. Economic expectations are in their lower 19th-percentile, income expectations are in their lower 13th-percentile and the propensity to buy is in its lower 23.9-percentile. All of these are rankings that are infrequently weaker than their readings in May.
Select European comparisons As a comparison I include the most up-to-date readings for Italy, France, and the UK on confidence. Italy and France have up-to-date readings through April; the UK has an up-to-date reading through May. The three countries all show declines in confidence from April to May; the UK shows a slight improvement from May to June. If we look at the most current readings, the percentile standing for Italy is a 50-percentile standing, which implies that the current reading is right on top of its median. For France it's a 5.8 percentile standing, marking the reading as weaker less than 6% of the time. For the UK, the May standing is a 26.5 percentile standing, just above the lower quartile of its historic queue of data.
Wrap up There was nothing reassuring in these data. The economies are struggling as we saw in the S&P PMI data from yesterday from the early reporters of PMI statistics. Of course, the inflation data are uniformly poor globally, so it remains a difficult time and the consumers are feeling a good deal of pressure from inflation and a certain amount of economic uncertainty.
 USA| May 21 2026
Housing Starts: Hints of Improvement
- March & April brought the best two-month performance since late 2023.
- Multi-family activity has led the advance; single-family activity lags.
- of7Go to 2 page