- Deficit: $82.4 bil. in April, down $2.9 bil. (-3.4%) from March’s $85.3 bil.
- Exports +4.0%, fourth straight m/m gain to a record level, driven by a 7.8% rebound in nonauto consumer goods exports.
- Imports +1.9%, third consecutive m/m rise to highest level since Mar. ’25, led by a 7.5% recovery in imports of other goods.
 USA| May 29 2026
U.S. Goods Trade Deficit Narrows in April After March Widening

 Global| May 29 2026
EMU Early Inflation Readings Rise in Large Countries
In the post-COVID cycle, inflation in Italy hit its low point early in 2023 and then again late in 2024. However, for the other large monetary union economies, France, for example, inflation hit its low point early in 2026 at a pace of about 1.1%. Germany, the traditional low-inflation country in the monetary union, has had more difficult times with inflation post-COVID. For this reason, the low point for German inflation came early in 2026 (and in mid-2025 at 1.9%). For France and Italy, headline inflation began escalating very early in 2026. For Germany, the escalation was a little later, and the spiky part of inflation was blunted on the early side; inflation has actually tipped slightly lower now, in May. However, despite these differences in timing, the overpowering sense is that inflation in the large countries has turned higher early in the year, and the European Central Bank will have some decisions to make.
Month-to-month price changes In May, inflation decelerated in Germany, with the month-to-month observation going unchanged. Headline prices in Spain rose by 0.2%, in France by 0.3%, and in Italy by 0.4%. German prices excluding energy have been making steady gains for the last several months, rising by 0.2% in May; Italian core prices rose by 0.4% after being flat in April and declining sharply in March; in Spain, the core CPI rose by 0.2% for the second month in a row.
The monthly statistics on inflation from the headlines and core rates for these countries are not off-the-charts or particularly troublesome. However, when put in context in terms of 3-month, 6-month, and 12-month inflation rates, the headlines and the cores trace more disturbing patterns.
Sequential trends in the HICPs Headline inflation for these countries shows over three months that inflation has a rate excessive relative to the ECB's target for the European Monetary Union as a whole. There are no country-by-country targets from the ECB, only an objective for the union-wide result. German inflation over three months is the weakest, as it logs a 4% annual rate. Italian inflation is the strongest, rising at an 8.6% annual rate. Over six months, inflation is excessive in all four of these countries. The weakest gain is in Germany at 2.4% at an annual rate; the strongest is in Italy at a 5.9% annual rate. Over 12 months, inflation is also excessive across the board relative to the ECB's overall monetary union target of 2%. The weakest gain in 12-month inflation is Germany at 2.6%, while the strongest is Spain at 3.6%. Additionally, inflation is accelerating from 12-months to six-months to three-months in both France and Italy. Although inflation is not accelerating in that three-period sequence for Germany and Spain, it is not far from doing so. All of these are going to be uncomfortable metrics for the European Central Bank to navigate. These are the headline rates for the large EMU countries, and they are clearly being pushed up by energy prices on the constriction of traffic through the Strait of Hormuz.
Core and ex-energy inflation trends Three of the four largest EMU economies give us either core inflation or inflation excluding energy metrics. On that basis, two of three economies, Germany and Spain, show excessive inflation over three months annualized, at 2.7% for Germany and 3.4%, for Spain. We compare them to the target set by the ECB for the European Union overall. Italy is the exception, with core inflation falling 0.4% at an annual rate over three months. Over six months, Germany, Italy, and Spain all have core inflation rates at or above 2%. Italy's rate comes in at 2%, Germany's ex-energy rate is at 2.2% annualized, while Spain’s CPI core checks in at 3% inflation. Over 12 months, inflation in Germany excluding energy is 2.3%, in Spain the CPI core runs 2.9%, while in Italy, inflation is still restrained for the core measure at a 1.8% annual rate.
Headline inflation and rising energy prices clearly are generating pressures such that even the core conditions aren't looking good. Core inflation rates above 3%, as we see in Spain across nearly all three timelines, are disturbing to the monetary authority. German inflation is moderate at 2.2% over six months and 2.3% over 12 months, but then it rises to a more disturbing 2.7% over three months. So far, Italian inflation is not an issue, at 1.8% over 12 months, 2% over six months, and even declining at a 0.4% annual rate over three months.
 Global| May 28 2026
Charts of the Week: The AI Boom Meets Inflation Angst
The global macro backdrop remains dominated by instability in the Middle East and the lingering inflation concerns associated with elevated energy prices. Yet recent days have at least offered some tentative relief. Oil prices have softened amid heightened hopes that negotiations between the US and Iran could eventually ease tensions and help stabilise energy markets, even if the broader geopolitical situation remains fragile and key shipping routes continue to face disruption. Against this backdrop, the latest survey data continue to highlight an uneven global economy, with Europe looking particularly vulnerable given its greater sensitivity to higher energy costs and its weaker links to the global AI investment boom (chart 1). At the same time, rising gasoline prices continue to weigh heavily on US household confidence (the Michigan measure), raising concerns about the resilience of consumer demand (chart 2). An important question confronting markets in the meantime is whether inflation fears are now becoming overstated. Unlike during the post-pandemic inflation shock, central bank balance sheets are now shrinking rather than expanding aggressively, while money supply growth remains relatively weak across many major economies (charts 3 and 4). Meanwhile, the extraordinary boom in AI-related infrastructure spending — spanning data centres, utilities, water systems and semiconductors — continues to provide a major offset to broader macroeconomic weakness and remains a key pillar supporting global equity markets despite elevated geopolitical and inflation concerns (charts 5 and 6).
by:Andrew Cates
|in:Economy in Brief
 USA| May 28 2026
U.S. New Home Sales Drop to a Three-Month Low in April
- Sales -6.2% m/m (-11.3% y/y) to 622,000 in Apr.; +3.4% m/m (+1.1% y/y) to 663,000 in Mar.
- Sales down m/m and y/y in the Midwest, Northeast, and South; up only in the West (+18.7% m/m, +4.6% y/y).
- Median sales price +8.0% m/m to $422,500, a 4-month high; avg. price +0.7% m/m to $508,800.
- Months' supply: 9.4 mths. in Apr., a 3-month high; 8.7 mths. in Mar.
 USA| May 28 2026
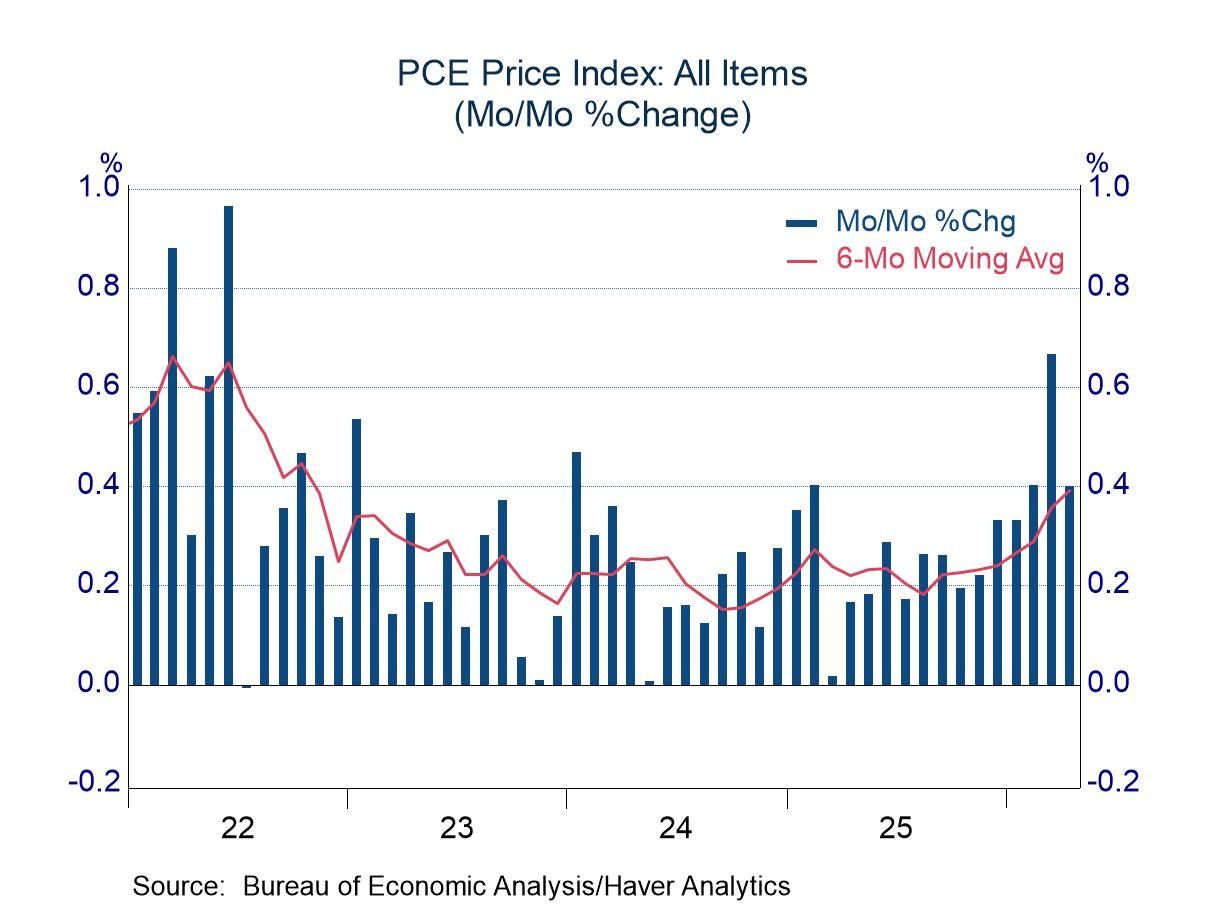
Personal Income, Consumption, and Prices in April: Consumers Soldier on Despite Inflation and Income Issues
- Food and energy prices rose sharply in April; core inflation slowed slightly, although it remained uncomfortable.
- With inflation stirring, real personal income has been soft in recent months.
- Despite softness in real income, consumers have not retrenched.
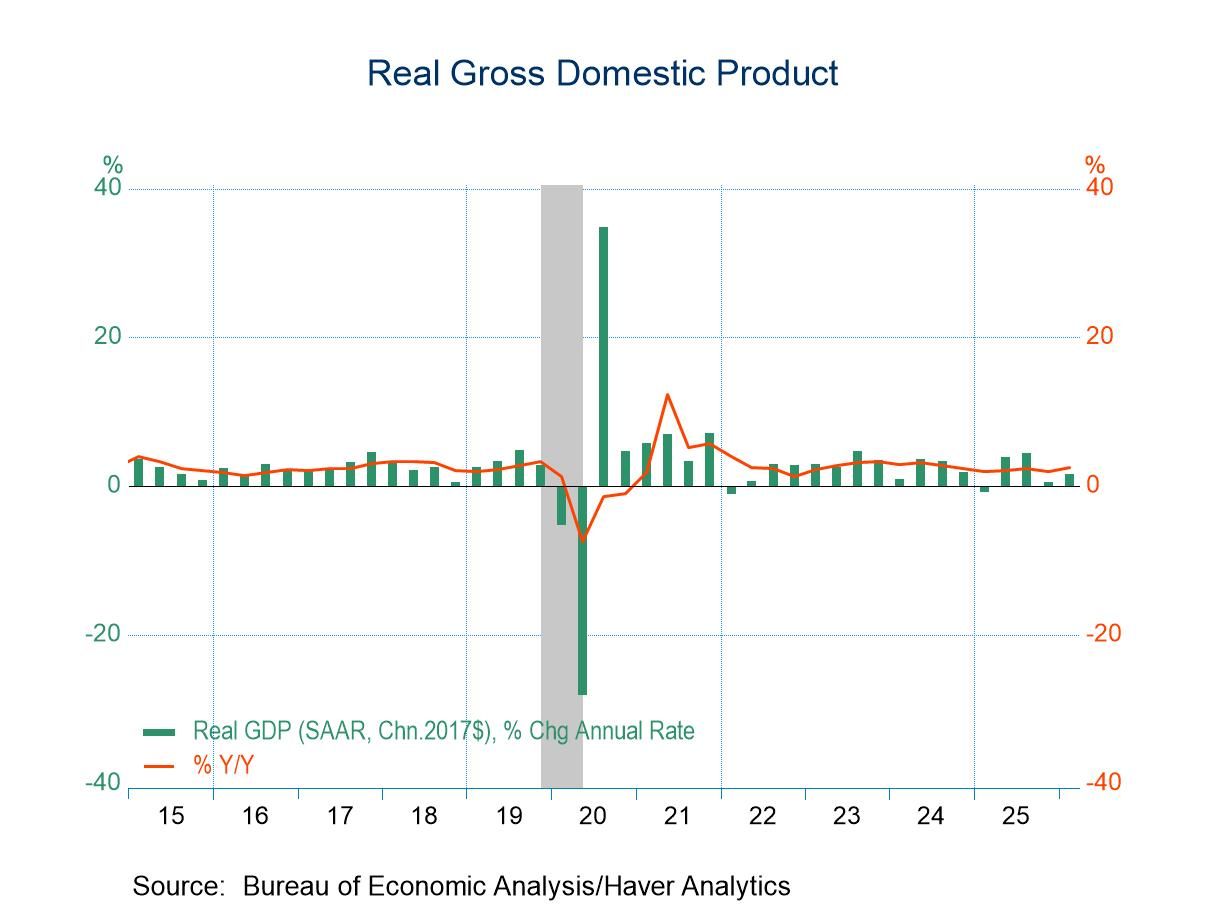
- Q1 GDP growth was unexpectedly revised down to 1.6% saar from 2.0% in the advance estimate.
- There was little revision to the major expenditure components with almost all of the total downward revision due to a larger decline in inventories than previously estimated.
- Domestic demand growth was revised down a tick but was still a solid, above-trend 2.4%.
- This report provided the first look at Q1 corporate profits. Profit growth slowed to 0.9% q/q not annualized but this was on top of a 10.7% jump in the previous two quarters.
by:Sandy Batten
|in:Economy in Brief
 USA| May 28 2026
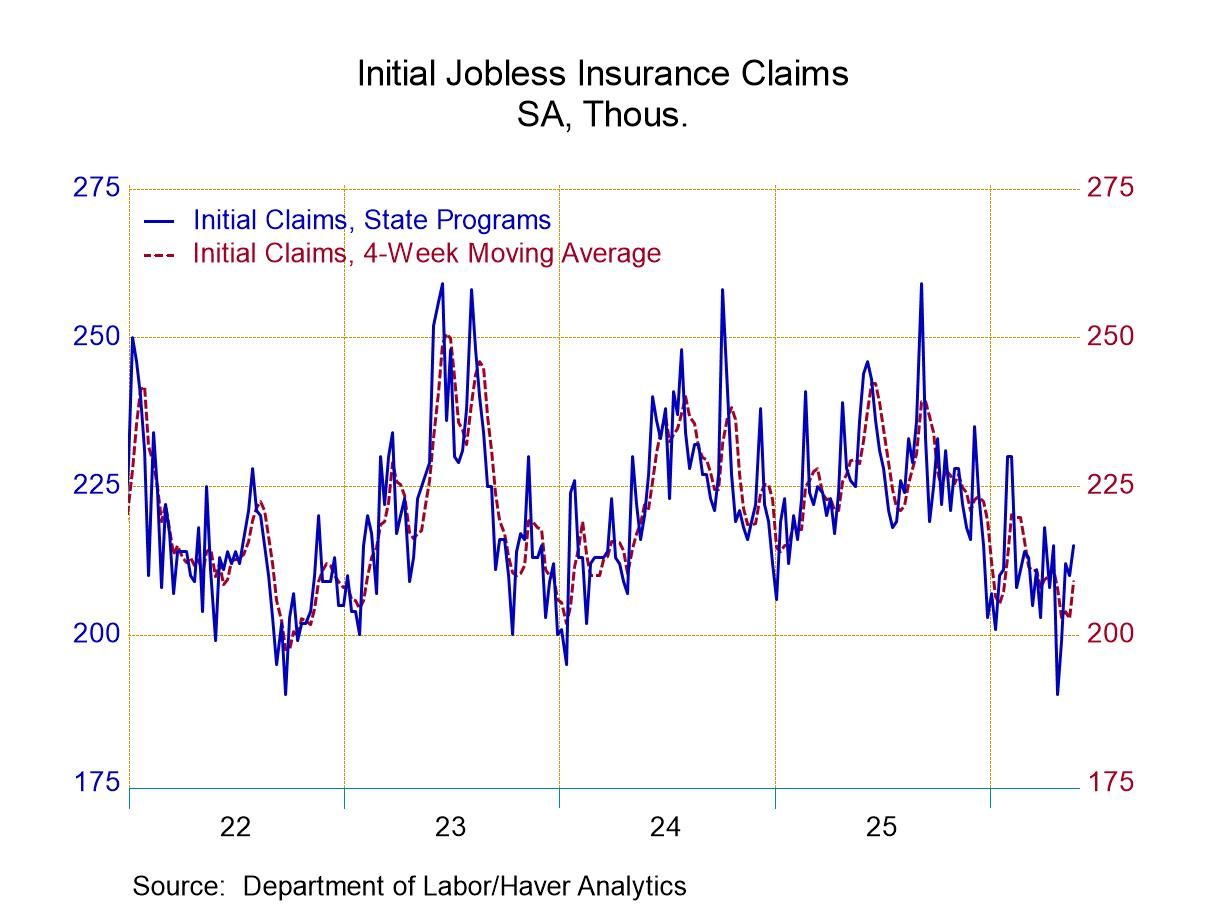
U.S. Initial Unemployment Claims Rose in the Week of May 23
- New claims rose by 5,000 to 215,000 in the week ending May 23.
- Continuing claims rose by 15,000 to 1.786 million, but the downward trend in place since October 2025 remains in place.
- The insured unemployment rate was unchanged at 1.2% in the week of May 16.
 United Kingdom| May 28 2026
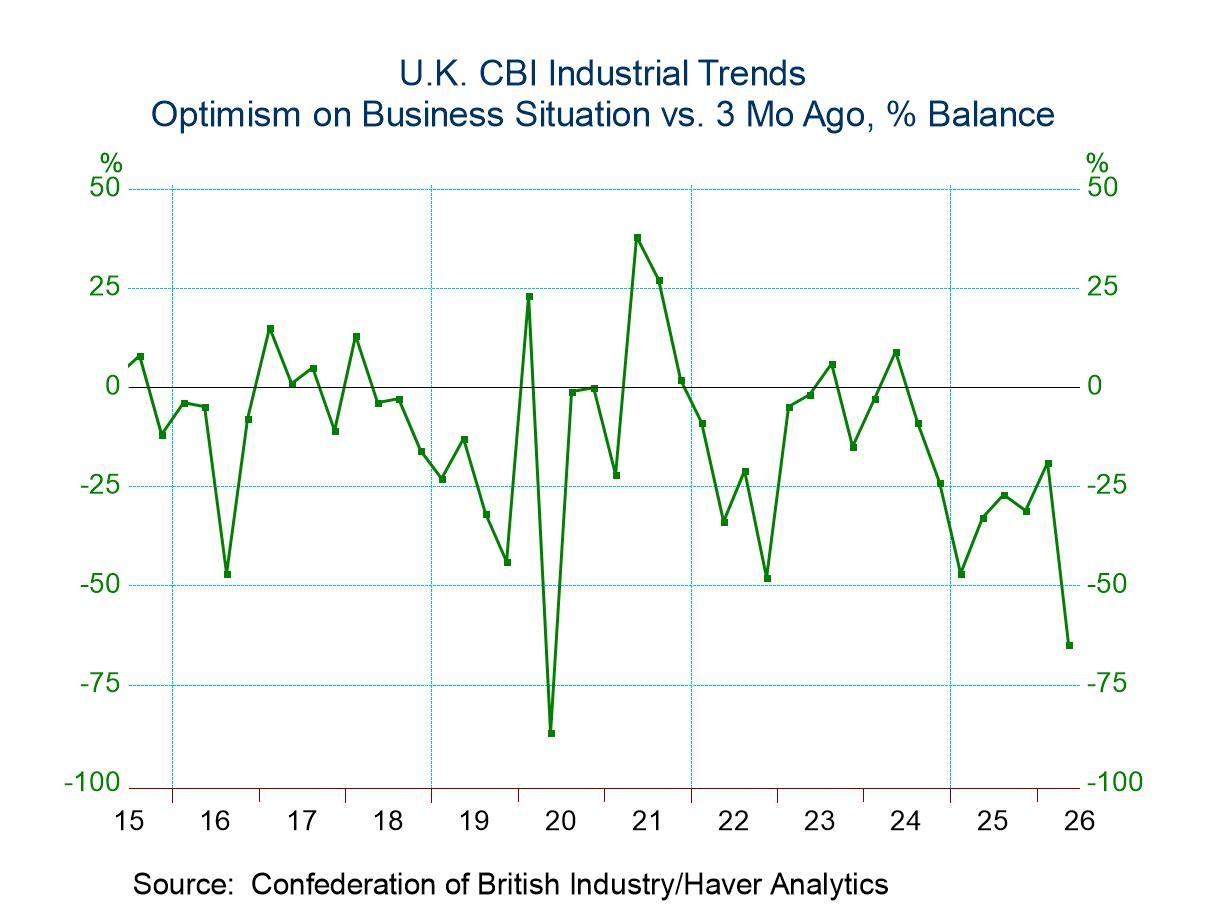
U.K. CBI Industrial Quarterly Survey Weakens
The Confederation of British Industry (CBI) shows business optimism falling sharply in Q2 2026, joined by a drop in export optimism. Expectations for capital goods spending excluding buildings improved slightly on the quarter, with the index reading rising to -38 from -44. Expectations for capital spending excluding equipment fell significantly to -36 in the second quarter from -22 in the first quarter. The two capital spending measures each have rankings below the 20th percentile; for capital spending excluding buildings, the figure is extremely weak.
The number employed over the last three months shows a slight decline to -19 from -16; however looking ahead to the next three months, the decline repeats, falling to -26 from -18 in the first quarter. The rankings for these two metrics are both in the low 30th percentiles.
New order volume for three months ago and three months ahead remain weak, with the three-month ago reading stuck at -21 and the three-month-ahead reading falling from -12 in the first quarter to -31 in the second quarter. The rankings for these two metrics are each at the 15th percentile or lower.
The volume of domestic orders for three months ago edged slightly lower, to -25 from -23; however for three months ahead it weakens more sharply to -32 from -17. Both of these metrics have rankings at the 15th percentile or weaker.
The volume for foreign orders from three months ago improved to -4 from -12. The volume for three months ahead has weakened only slightly, from +1 in the first quarter to -2 in the second quarter. The three-month-ago reading has a 35th percentile ranking, while the three-month-ahead ranking is at its 47th percentile. The foreign sector appears to be carrying some stimulus to the U.K. economy.
The volume of output from three months ago was slightly weaker in the second quarter, while the volume of output for three months ahead is expected to weaken from a -14 reading in Q1 to -20 in Q2. Both metrics have a lower 10th percentile standing.
The average cost of output three months ago rose sharply to an index reading of in the second quarter 54 from 33 in the first quarter. Looking ahead to the next three months, another ratchet up is in progress, to a reading of 79 from 50 in the first quarter. These are suddenly extremely strong readings, with three-months-ago reading at a 78th percentile standing and the three-month-ahead reading at essentially a 90th percentile standing.
The average price for domestic orders three months ago has gone up from an index value of 2 in the first quarter to 17 in the second quarter, while the average price for domestic orders for three months ahead edged up to a reading of +32 from +29 in the first quarter. The three-month-ago reading has a 53rd percentile standing, while the three-month-ahead reading has an 89th percentile standing. Price expectations are hot.
The average price on foreign orders for three months ago rose from -4 in the first quarter to +15 in the second quarter, logging a 49th percentile standing, pretty close to its historic median. The average price for foreign output for three months ahead moved down to +19 from +23 in the first quarter and has a very strong 91.8 percentile standing. The Q/Q pressure eased a bit but remains intense.
- of7Go to 1 page