The German PPI rose by 2.4% month-to-month in March. That was, of course, boosted by oil prices as Brent crude soared, gaining 46.9% month-over-month (yikes!). However, very little of that got into German ex-energy prices, which did rise, but by only 0.4%. Still, do not be fooled by that ‘only.’ That 0.4% rise is the largest rise of that magnitude since February 2023—a period of about 2¼ years. So be wary of what might be in train here; 0.4% does not seem so large, but it annualizes to about a 5% pace.
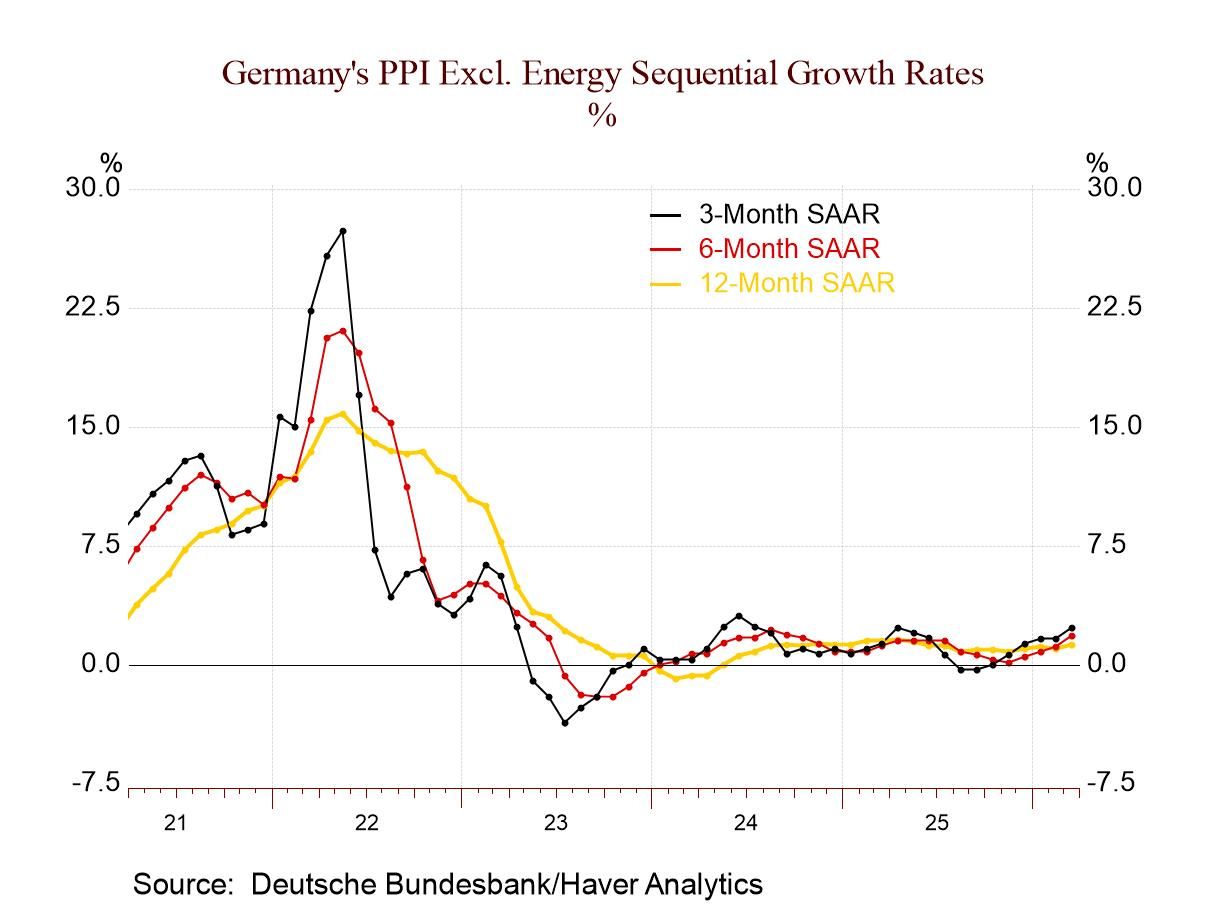
In addition, 12 months to six months to three months, the headline PPI is accelerating—from a 12-month drop, to a well-behaved 2.1% pace of expansion over six months, and then to an elevated 3.9% annual rate over three months.
The core PPI is a bit more copacetic, but it shows clear acceleration, rising from a 12-month pace of 1.3%, to a 1.8% pace over six months, and to 2.4% annualized over three months.
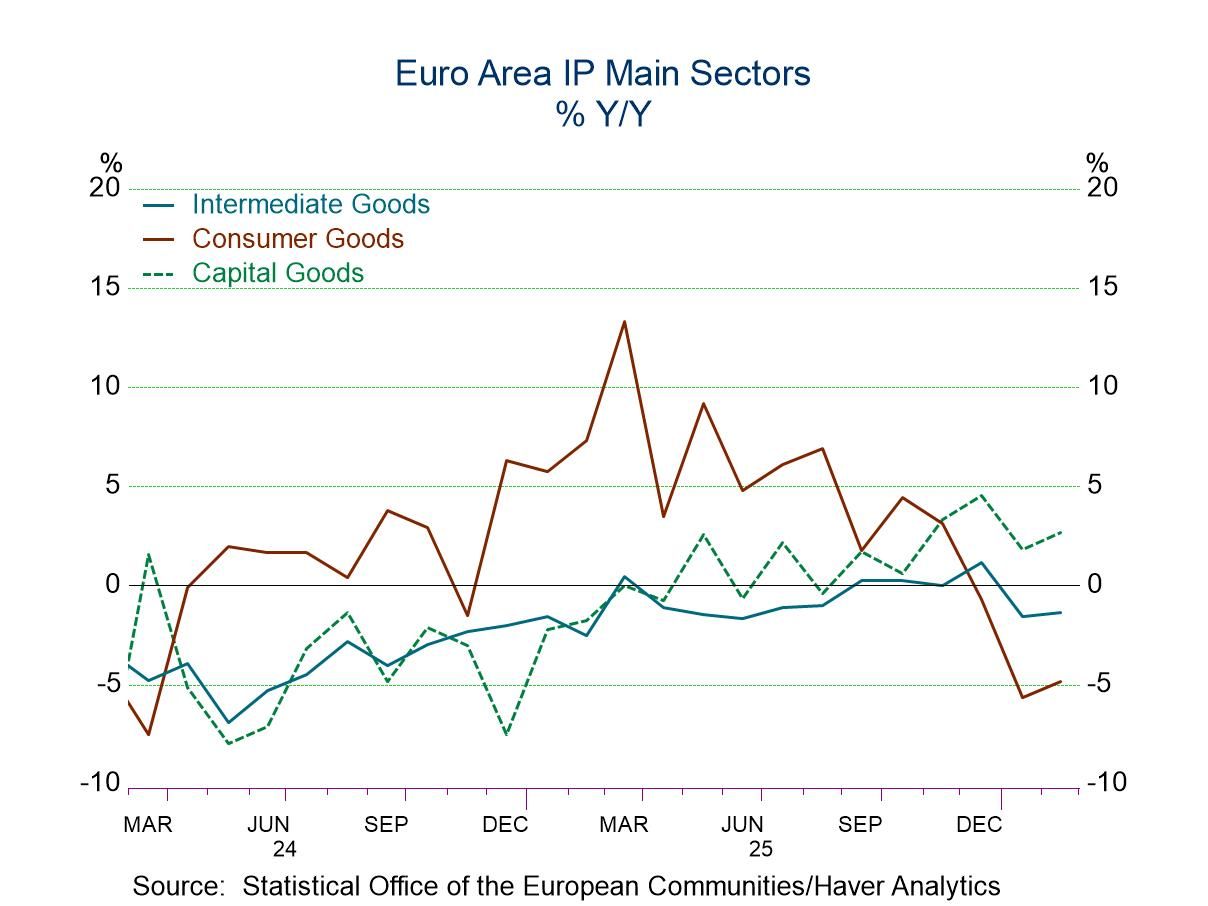
Consumer prices in Germany The sky is not falling. So far, there is no evidence of inflation in consumer goods: the consumer goods index does not even rise over 12 months, six months, or three months—though it is flat over three months. Investment goods, by contrast, show clear price acceleration, rising from 1.9% over 12 months, to 2.6% over six months, and to 4.1% over three months. Intermediate goods show the inflation wallop as prices rise by 1.5% over 12 months, to a 5.1% pace over six months, and at an 8.1% annual rate pace over three months. That annualized intermediate goods gain is something to watch. It is driven by oil, but other commodities and goods are caught up in supply chain woes as well.
For reference, the headline CPI shows acceleration, rising from a 12-month pace of 2.7% to a 5% annualized rate over three months. The ex-energy CPI, however, remains subdued, rising 2.3% over 12 month and at a more modest 2% annualized pace over three months.
 Asia
Asia