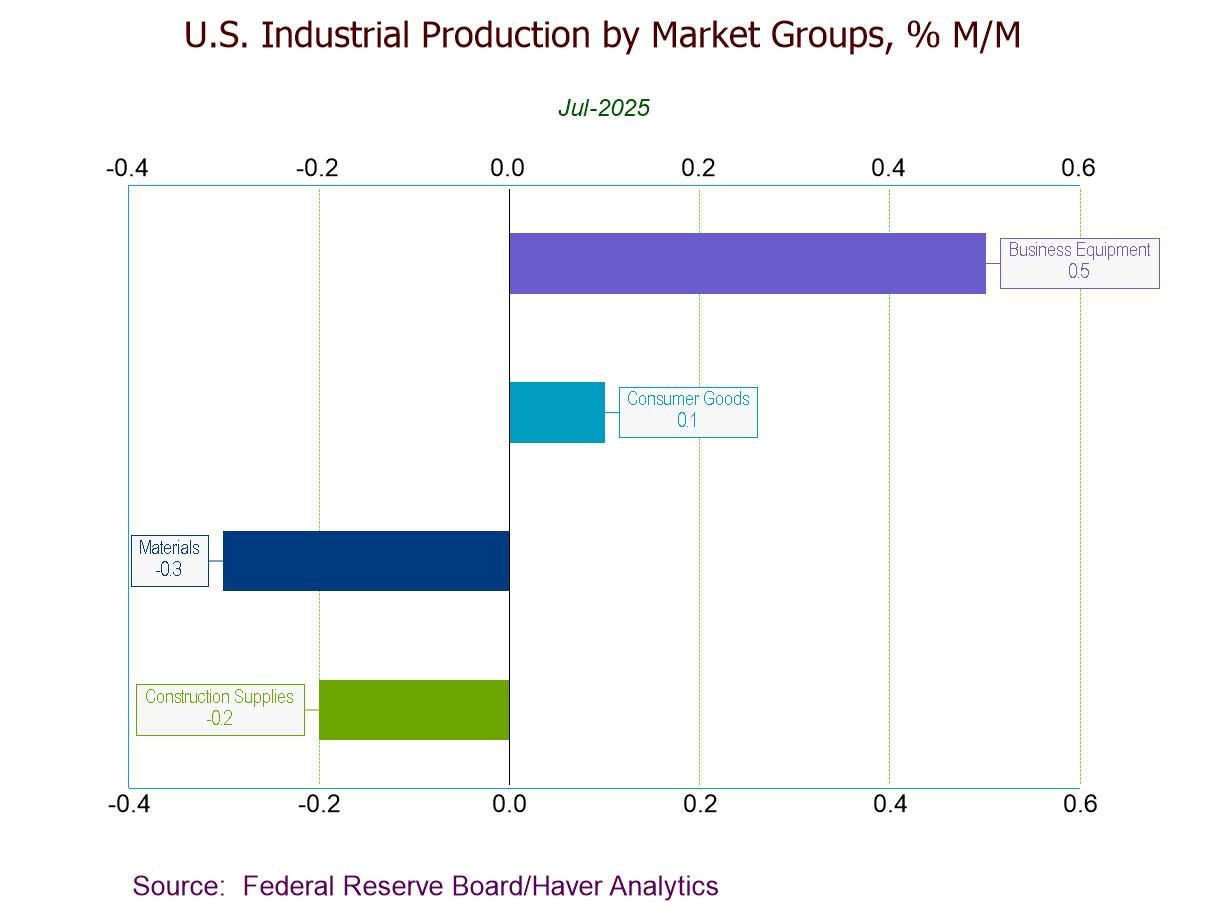
- July IP -0.1% (+1.4% y/y), led by a 0.4% decline in mining activity.
- Mfg. IP unchanged, w/ durables up 0.3% and nondurables down 0.4%.
- Utilities output -0.2%, the second m/m fall in three months.
- Key categories in market groups post mixed results.
- Capacity utilization down 0.2%pt. to 77.5%; mfg. capacity utilization down 0.1%pt. to 76.8%.
 USA| Aug 15 2025
U.S. Industrial Production Eases in July
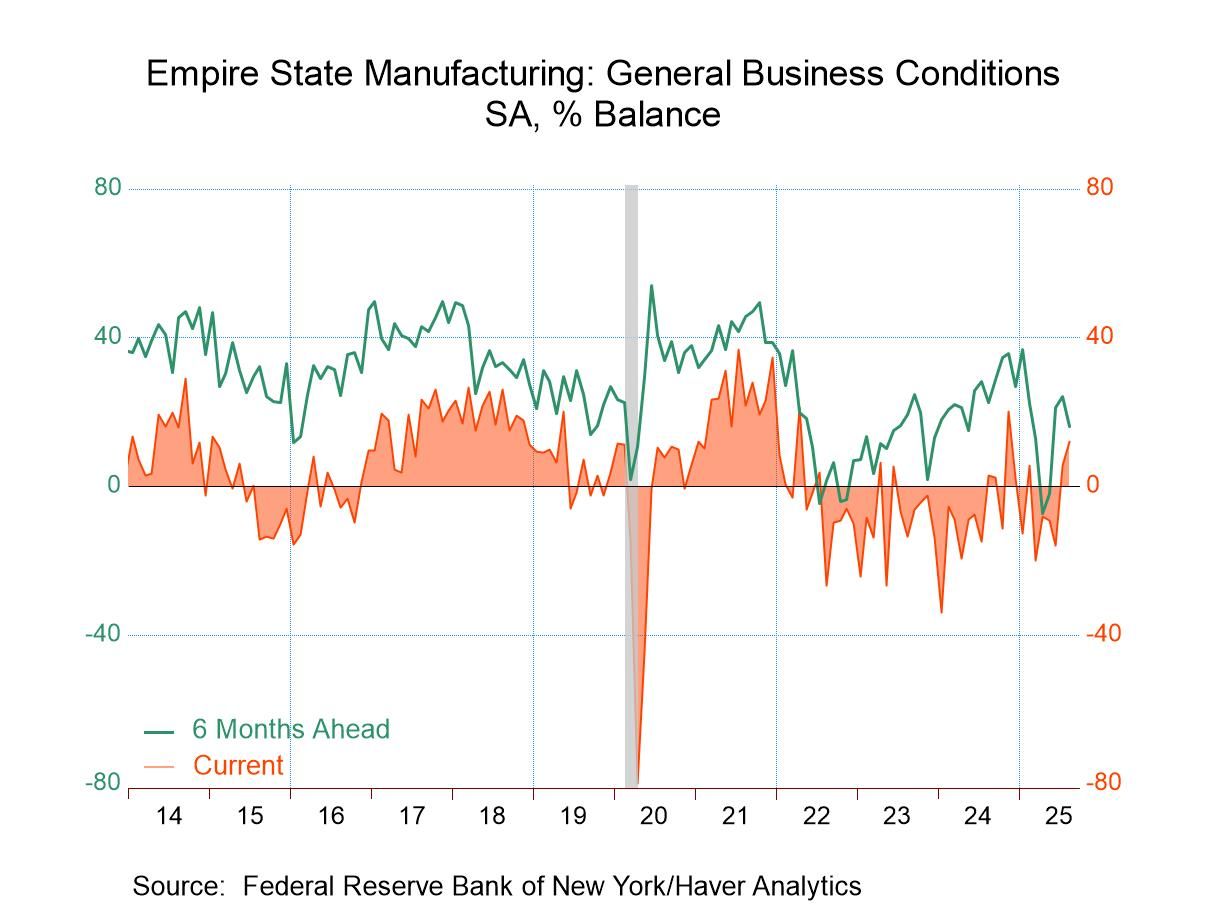
- The highest reading since November 2024.
- The August rise was led by stronger new orders and continued gains in shipments.
- More evidence of nascent supply-chain problems.
- Outlook six months ahead faded slightly.
by:Sandy Batten
|in:Economy in Brief
 USA| Aug 15 2025
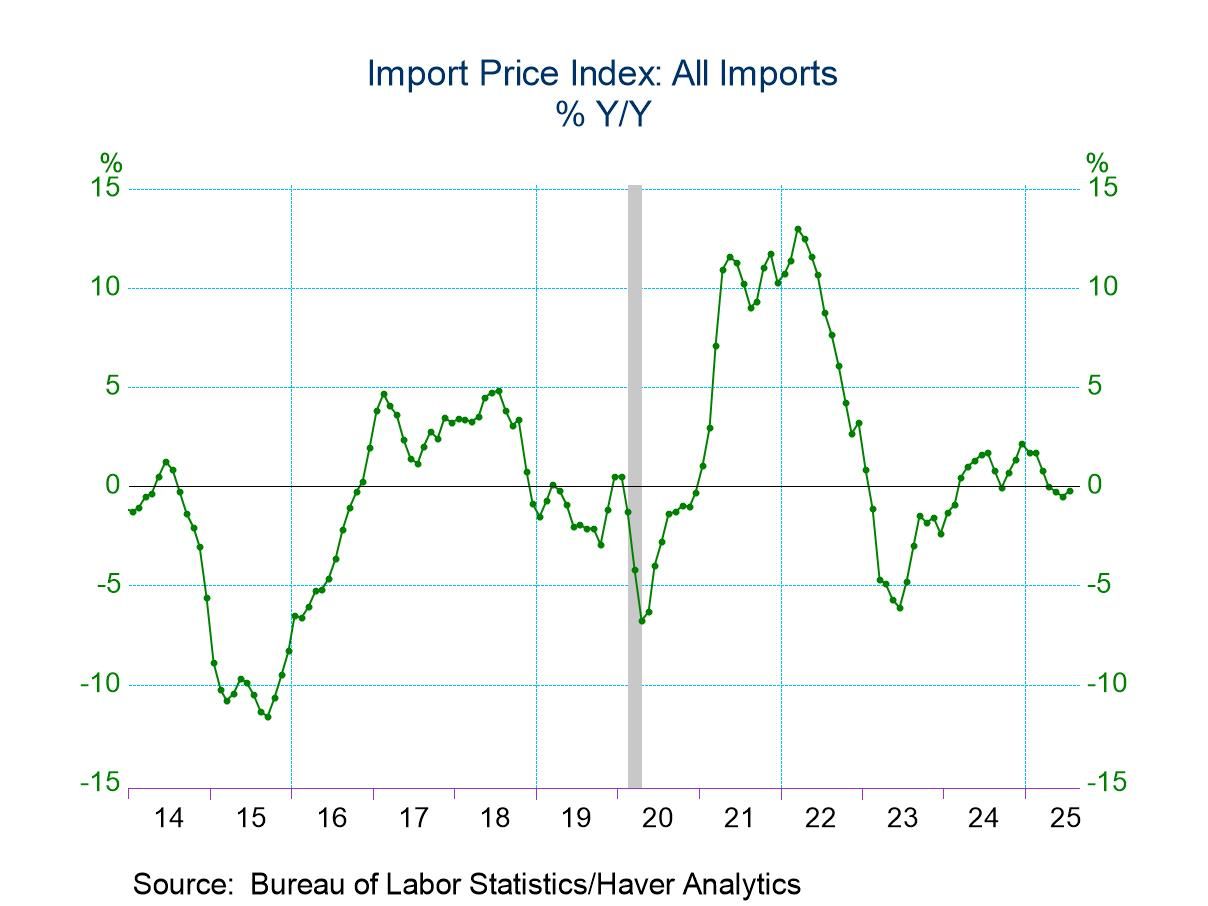
U.S. Import Prices Rebounded in July
- Import prices rose 0.4% m/m in July against expectations of no change after declines in both May and June.
- Higher prices for imported petroleum and natural gas drove the July rebound.
- Export prices ticked up 0.1% m/m, largely reflecting higher prices for nonagricultural exports.
by:Sandy Batten
|in:Economy in Brief
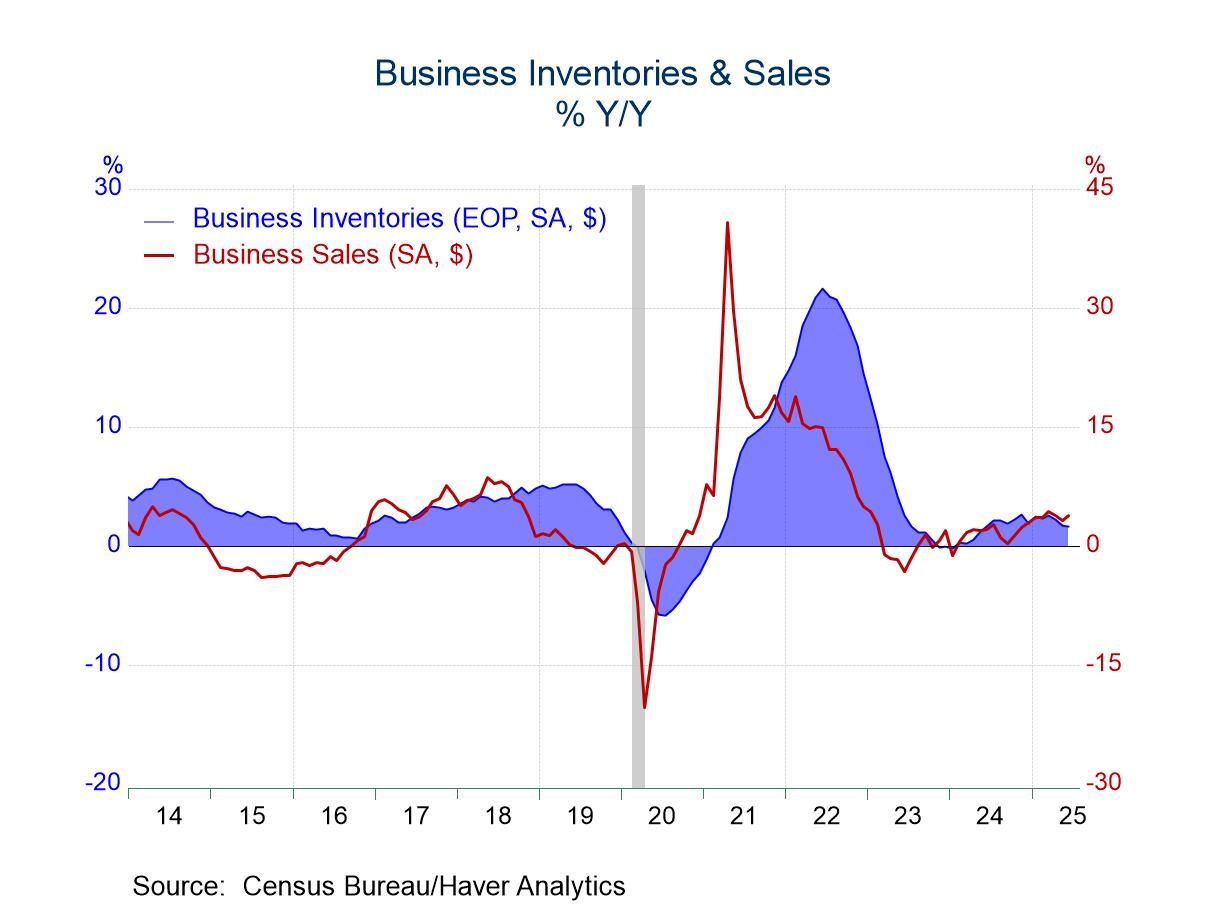
- Inventory increase is first in three months & spread across sectors.
- Sales rise is led by retailers.
- I/S ratios are little changed.
by:Tom Moeller
|in:Economy in Brief
 Japan| Aug 15 2025
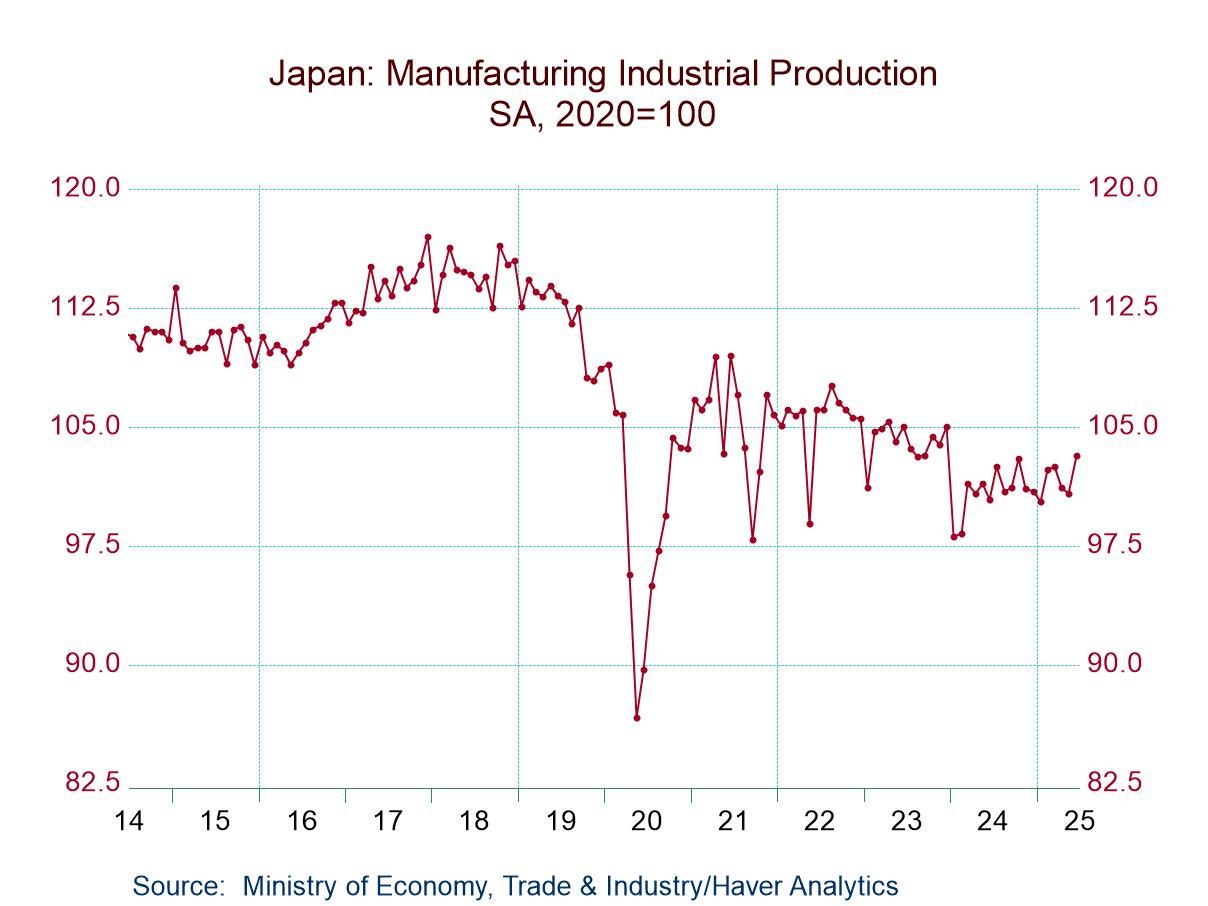
Japan’s IP: Stagnation Rules Despite Monthly Gain
Industrial production in Japan broke higher in June rising by 2.1% month-to-month after declining 0.2% in May and by 1% in April. Manufacturing output rose by 2.4% in June. Main manufacturing sectors show consumer goods output fell by 2.5% on the month, intermediate goods output rose by 1.3%, and investment goods output rose by 2.3%. Outside of manufacturing, mining output fell by 3.1% while utilities- gas and electric - output grew by 4.7%, erasing several months of declines.
Sequential growth rates show total industry output gaining momentum rising 2.8% over 12 months, at a 4.4% annual rate over six months and stepping back only slightly to a 3.6% growth rate over three months. Manufacturing output has been relatively firm and steady over 12 months, six months and three months. Consumer goods output has been more mercurial in its behavior, rising 3.8% over 12 months, stepping up to an 11.2% annual rate of expansion over six months but then falling at a 3.7% annual rate over three months. Intermediate goods output, on the other hand, has shown steady but slow-paced expansion, rising 0.1% over 12 months, at a 1% annual rate over six months and at a 0.8% annual rate over three months. Investment goods output has been accelerating; it has a surging 5.6% growth rate over 12 months, which steps up to 8.9% over six months and steps up again to a 13.6% annual rate over three months. The capital goods part of Japan's economy appears to be doing quite well in contrast mining where declines occur on all these horizons and at an accelerating pace of contraction. Electric utility & gas output accelerates through 12-months to 6-months to 3-months.
On a quarter-to-date basis, output grew at a 1.2% annual rate in the just-completed second quarter. Consumer goods output and intermediate goods output increased by less than 1% in the quarter while investment goods output rose at a 3.5% annual rate.
The far-right hand column shows the change in output compared to January 2020. The result shows negative numbers for all the entries in the table except for utilities usage which is up by only 6.4% over this 5 1/2-year period. However, output in the other sectors shows declines. There's been no increase - no net increase - in output over this 5 1/2-year span. This is a real testament to the kind of lethargy that Japan's economy has been through during this period.
 Global| Aug 14 2025
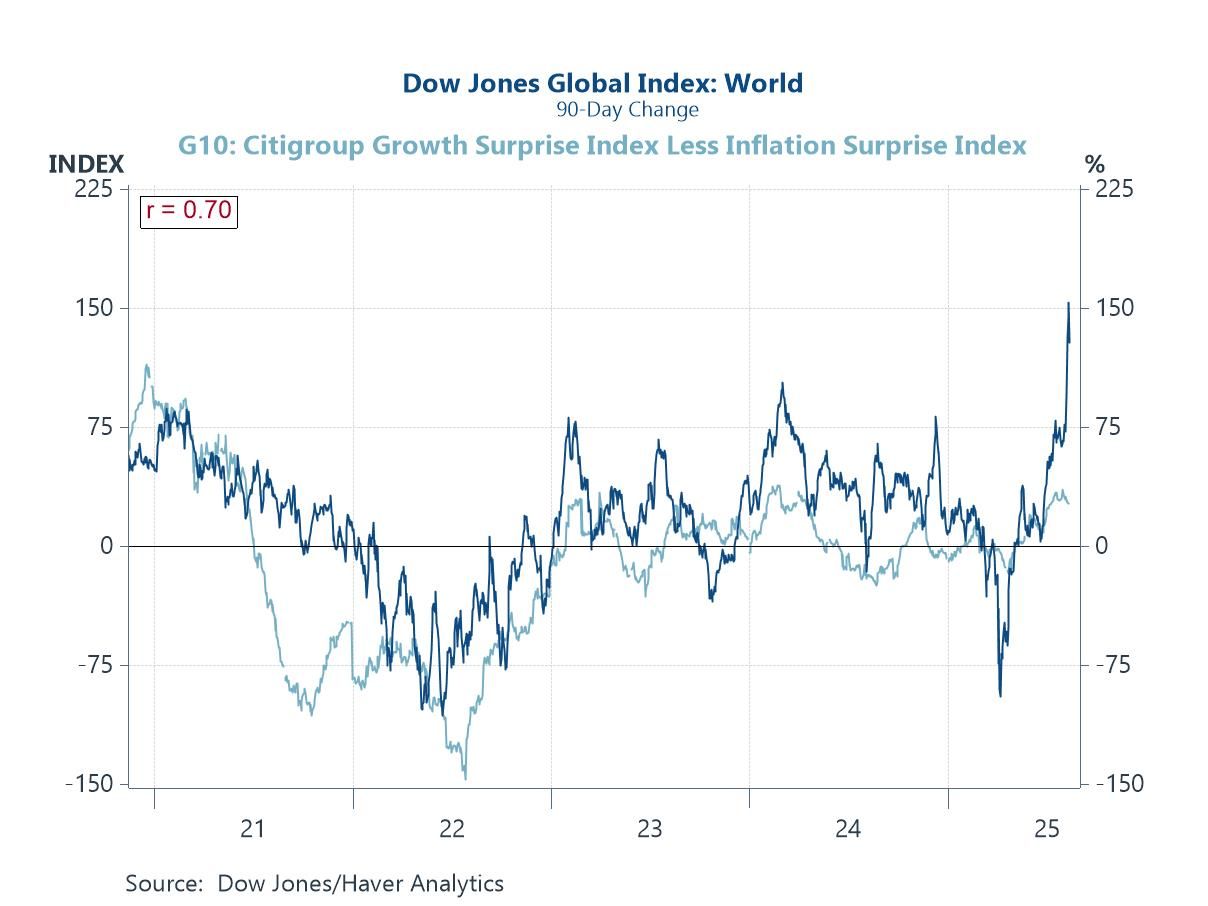
Charts of the Week: What Gives?
Global financial markets head into late summer buoyed by resilient risk appetite, underpinned by hopes that AI will boost productivity and growth alongside expectations for further central bank policy easing (chart 1). Yet this optimism has not been fully mirrored in the macro outlook: US non-residential investment forecasts for 2026 have been marked down in recent months, and global growth projections — particularly for US-exposed economies — have also softened, arguably reflecting tariff-related uncertainty (charts 2 and 3). This week’s data have nevertheless been friendly for the idea that further policy easing will be enacted in the months ahead. In the US, a benign July inflation report has, for example, bolstered expectations of a September Fed rate cut (chart 4). And in the UK, weaker labour market data have raised hopes of further BoE easing despite the hawkish tone that accompanied last week’s rate cut (chart 5). Meanwhile, falling global energy prices are also providing an important counterweight to the inflationary risks posed by US tariff measures, a balance that could be central in shaping the path of interest rates into year-end (chart 6).
by:Andrew Cates
|in:Economy in Brief
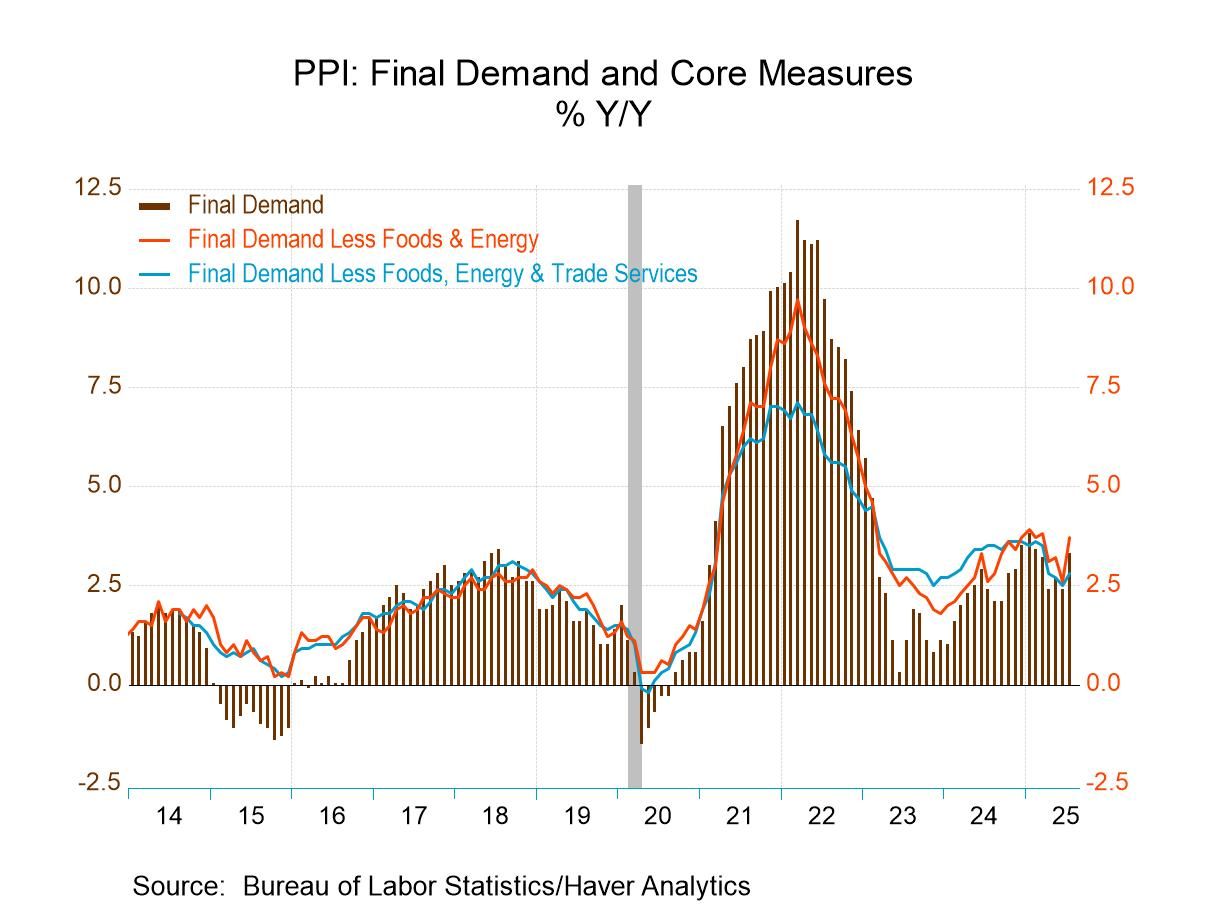
- Core index posts unexpected gain.
- Trade service prices move markedly higher.
- Food & energy price inflation also accelerates.
by:Tom Moeller
|in:Economy in Brief
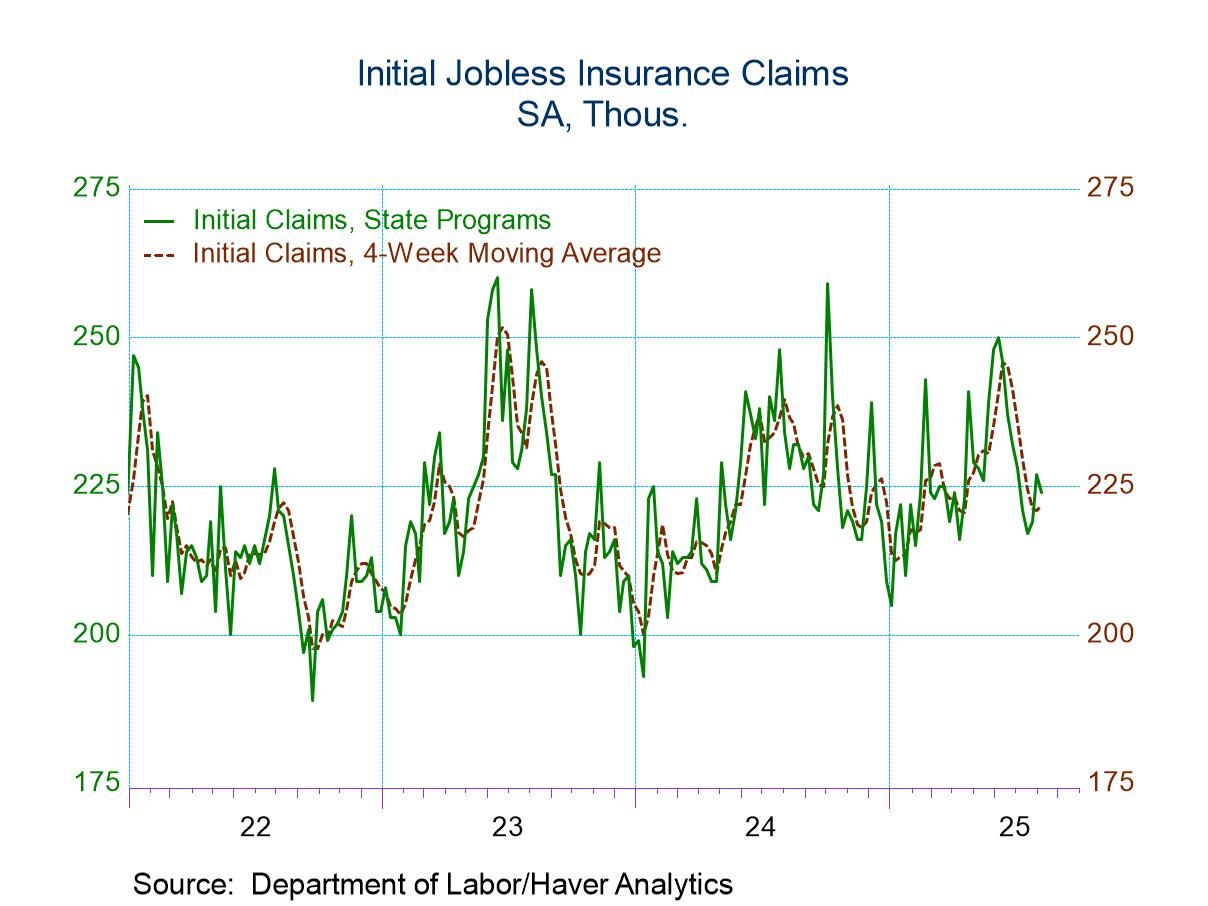
- New claims edged down to 224,000 from 227,000 in the previous week.
- Continuing claims fell to 1.953 million from 1.968 million.
- The insured unemployment rate was unchanged at 1.3%.
by:Sandy Batten
|in:Economy in Brief
- of9Go to 5 page