U.S. Industrial Production Eases in July
Summary
- July IP -0.1% (+1.4% y/y), led by a 0.4% decline in mining activity.
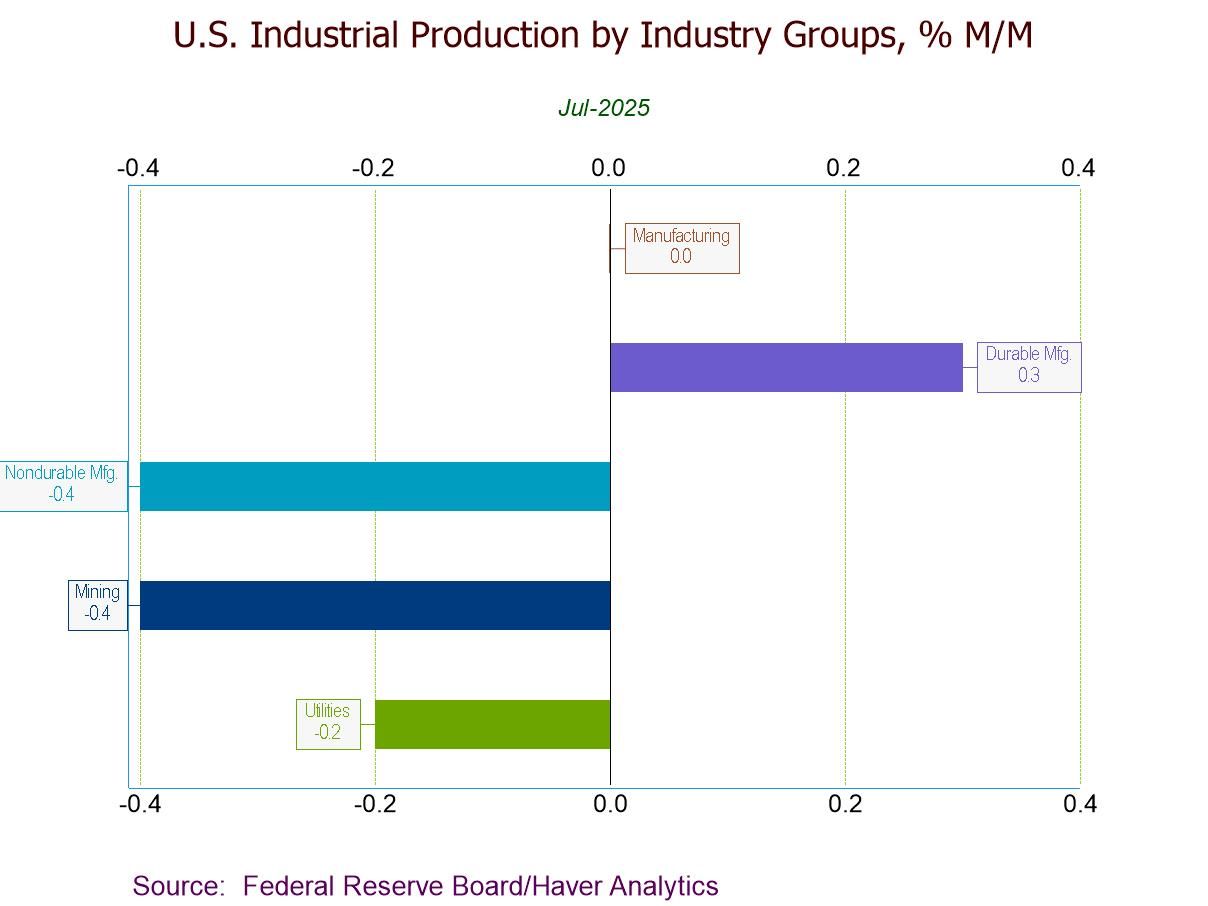
- Mfg. IP unchanged, w/ durables up 0.3% and nondurables down 0.4%.
- Utilities output -0.2%, the second m/m fall in three months.
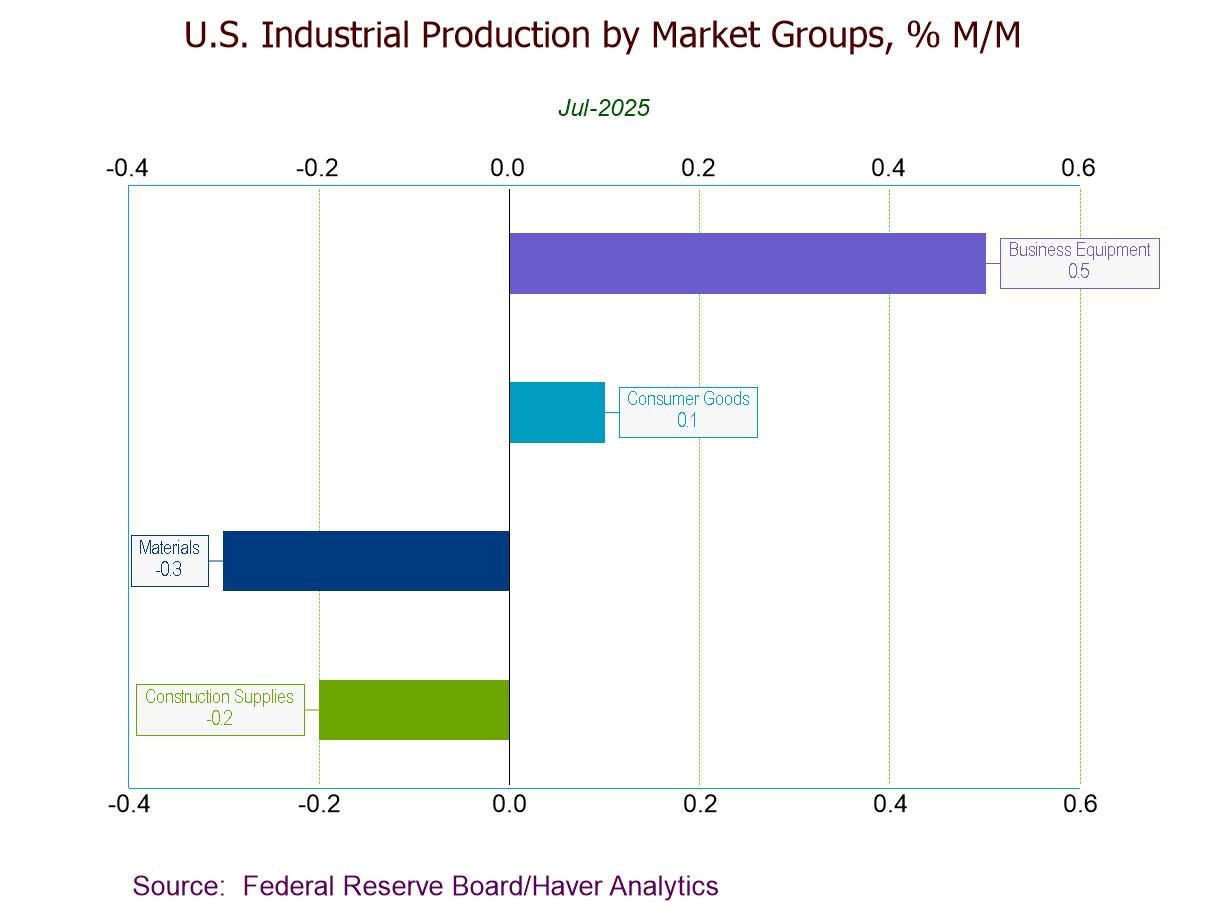
- Key categories in market groups post mixed results.
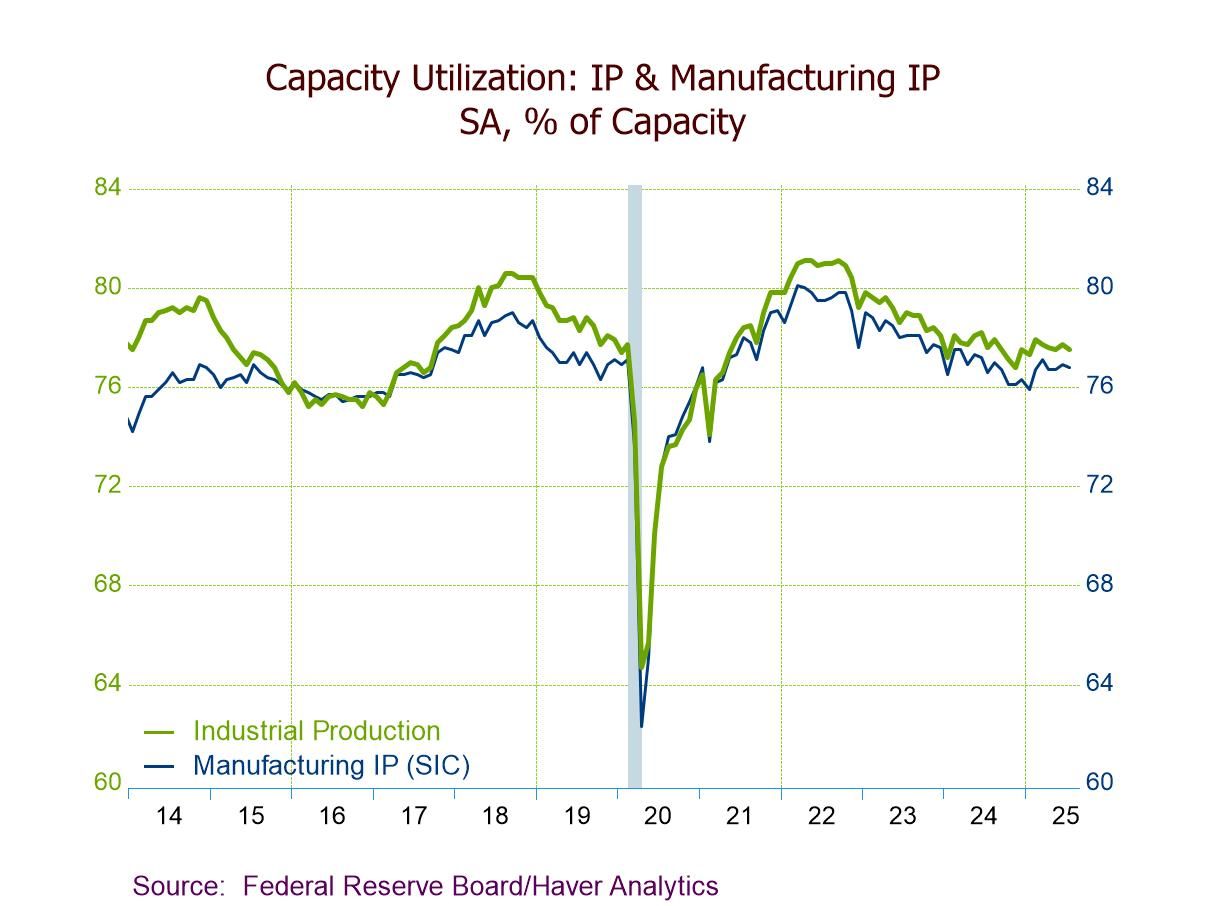
- Capacity utilization down 0.2%pt. to 77.5%; mfg. capacity utilization down 0.1%pt. to 76.8%.
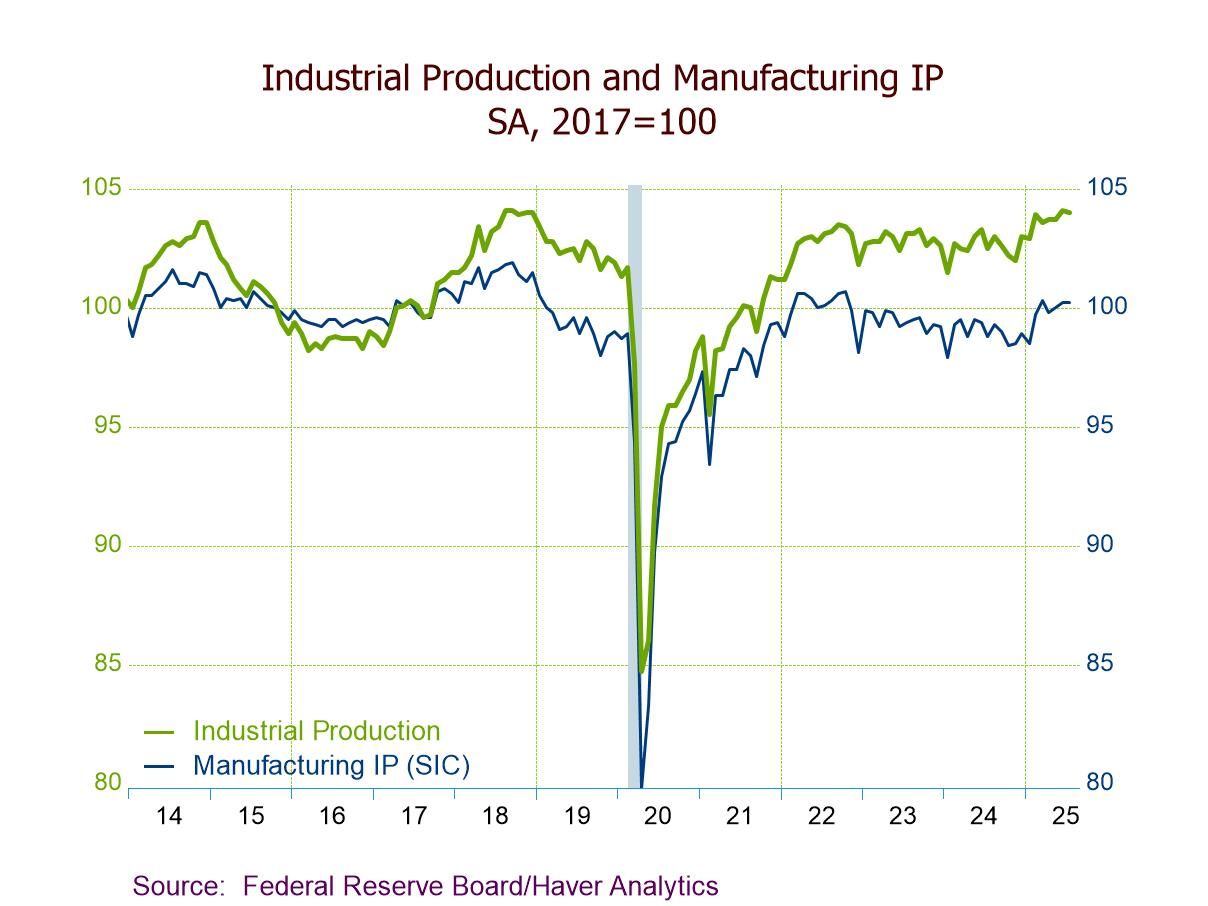
Industrial production (IP) dipped 0.1% m/m in July after upwardly revised increases of 0.4% in June (+0.3% initially) and 0.1% in May (0.0% previously), data from the Federal Reserve Board showed. A 0.0% m/m for July had been expected in the Action Economics Forecast Survey. The year-on-year rate of increase accelerated to 1.4% in July from 0.7% in June; it was well above -0.2% y/y in July 2024. The July IP index was at 104.0, marginally down from 104.1 in June (the highest since September 2018) and 2.5% above a low of 101.5 in January 2024.
By industry groups, manufacturing production was virtually unchanged (+1.4% y/y) in July following rises of 0.3% in June (+0.1% initially) and 0.2% in May (+0.3% previously). Durable goods production grew 0.3% (2.7% y/y) in July, the second m/m gain in three months, following a 0.1% downtick in June. Within durables, the following categories rose m/m in July, including output increases of 1.7% (8.9% y/y) in aerospace & miscellaneous transportation equipment, 1.3% (-1.7% y/y) in miscellaneous durables goods, 1.0% (-2.0% y/y) in electrical equipment, appliances & components, 1.0% (-0.2% y/y) in furniture & related products, 0.7% (1.7% y/y) in wood products, 0.6% (-1.3% y/y) in nonmetallic mineral products, 0.2% (-0.3% y/y) in fabricated metal products, and 0.1% (5.6% y/y) in computer & electronic products. Notably, aircraft & parts production climbed 1.1% (11.4% y/y) in July, the ninth straight m/m rise, on top of a 2.3% gain in June. To the downside, the following durable goods categories fell for the third time in four months in July, including machinery (-0.3%; +0.9% y/y), motor vehicles & parts (-0.3%; +8.3% y/y), and primary metals (-0.3%; +4.0% y/y).
Nondurable goods production fell 0.4% (+0.6% y/y) in July, down for the third month in four, following a 0.7% rebound in June, reflecting m/m output falls of all nondurable goods categories. These included output declines of 2.1% (-4.7% y/y) in textiles & product mills, 1.7% (-5.5% y/y) in apparel & leather goods, 0.8% (-3.1% y/y) in plastics & rubber products, 0.5% (0.0% y/y) in paper, 0.5% (+0.7% y/y) in petroleum & coal products, 0.4% (+2.5% y/y) in chemicals, 0.2% (+0.3% y/y) in food, beverages & tobacco, and 0.1% (-1.3% y/y) in printing & related support activities.
Mining activity slid 0.4% (+1.9% y/y) in July, the third m/m slide in four months, after an unrevised 0.3% decrease in June. Utilities output declined 0.2% (+0.8% y/y), down for the second month in three, following a downwardly revised 1.8% June gain (+2.8% initially), with a 0.3% decrease (+1.6% y/y) in electric utilities output and a 0.5% rebound (-5.3% y/y) in natural gas utilities output.
By market groups, materials production fell 0.3% (+1.8% y/y) in July, the first m/m fall since March, after a 0.5% advance in June. Construction supplies production declined 0.2% (+2.0% y/y) following a 0.3% June increase. To the upside, business equipment output rose 0.5% (3.8% y/y) in July, the ninth consecutive m/m rise, after a 0.1% uptick in June. Consumer goods output edged up 0.1% (0.6% y/y) after a 0.3% June rebound, reflecting increases of 0.1% (2.5% y/y) in durable consumer goods and 0.1% (0.1% y/y) in nondurable consumer goods.
In special classifications, factory output of selected high-tech industries rose 1.4% (14.0% y/y) in July on top of an upwardly revised 0.9% gain in June (+0.5% initially), posting the fourth successive m/m rise and the seventh in eight months. Meanwhile, manufacturing production excluding selected high-tech industries dipped 0.1% (+1.1% y/y) in July, the first m/m easing since April, following a 0.3% increase in June; manufacturing production excluding selected high-tech and motor vehicles & parts slipped 0.1% (+0.6% y/y), the third m/m decline in four months, following a 0.5% June rebound.
Capacity utilization fell to 77.5% in July from a three-month-high 77.7% in June (77.6% previously). The Action Economics Forecast Survey forecasted 77.6%. The July reading was 2.1 percentage points below its long-run (1972–2024) average. Manufacturing capacity utilization dipped to 76.8% in July from an unrevised 76.9% in June; the July rate was 1.4 percentage points below its long-run average.
Industrial production and capacity data are in Haver’s USECON database. Additional detail on production and capacity utilization can be found in the IP database. The expectations figures come from the AS1REPNA database.

Winnie Tapasanun
AuthorMore in Author Profile »Winnie Tapasanun has been working for Haver Analytics since 2013. She has 20+ years of working in the financial services industry. As Vice President and Economic Analyst at Globicus International, Inc., a New York-based company specializing in macroeconomics and financial markets, Winnie oversaw the company’s business operations, managed financial and economic data, and wrote daily reports on macroeconomics and financial markets. Prior to working at Globicus, she was Investment Promotion Officer at the New York Office of the Thailand Board of Investment (BOI) where she wrote monthly reports on the U.S. economic outlook, wrote reports on the outlook of key U.S. industries, and assisted investors on doing business and investment in Thailand. Prior to joining the BOI, she was Adjunct Professor teaching International Political Economy/International Relations at the City College of New York. Prior to her teaching experience at the CCNY, Winnie successfully completed internships at the United Nations. Winnie holds an MA Degree from Long Island University, New York. She also did graduate studies at Columbia University in the City of New York and doctoral requirements at the Graduate Center of the City University of New York. Her areas of specialization are international political economy, macroeconomics, financial markets, political economy, international relations, and business development/business strategy. Her regional specialization includes, but not limited to, Southeast Asia and East Asia. Winnie is bilingual in English and Thai with competency in French. She loves to travel (~30 countries) to better understand each country’s unique economy, fascinating culture and people as well as the global economy as a whole.
More Economy in Brief
 Asia
Asia

