 Global| Aug 14 2025
Charts of the Week: What Gives?
by:Andrew Cates
|in:Economy in Brief
Summary
Global financial markets head into late summer buoyed by resilient risk appetite, underpinned by hopes that AI will boost productivity and growth alongside expectations for further central bank policy easing (chart 1). Yet this optimism has not been fully mirrored in the macro outlook: US non-residential investment forecasts for 2026 have been marked down in recent months, and global growth projections — particularly for US-exposed economies — have also softened, arguably reflecting tariff-related uncertainty (charts 2 and 3). This week’s data have nevertheless been friendly for the idea that further policy easing will be enacted in the months ahead. In the US, a benign July inflation report has, for example, bolstered expectations of a September Fed rate cut (chart 4). And in the UK, weaker labour market data have raised hopes of further BoE easing despite the hawkish tone that accompanied last week’s rate cut (chart 5). Meanwhile, falling global energy prices are also providing an important counterweight to the inflationary risks posed by US tariff measures, a balance that could be central in shaping the path of interest rates into year-end (chart 6).
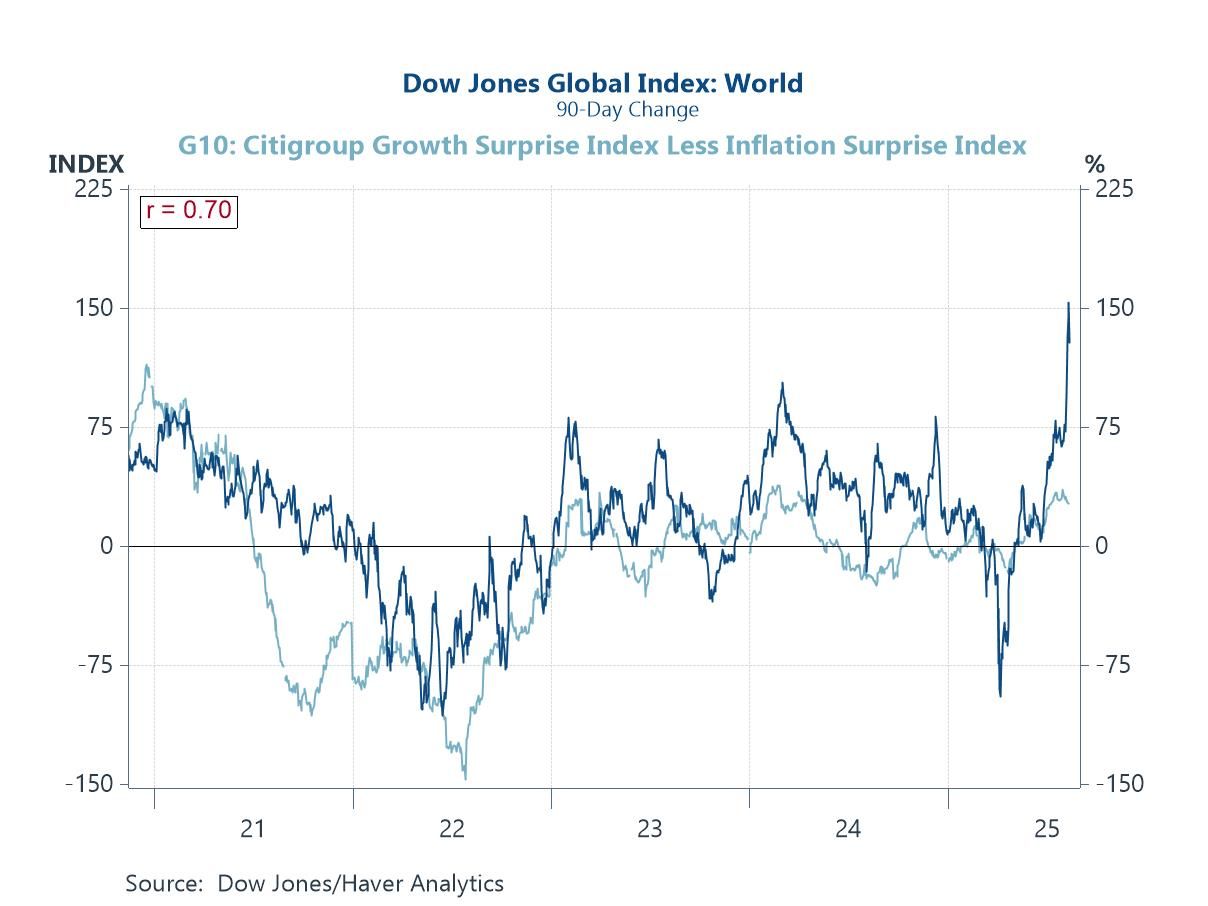
Global equity markets and economic data surprises The surge in global equity markets over recent weeks has been eye-catching and underscores a degree of optimism that seems only loosely connected to incoming macroeconomic data. While data surprises have turned mildly positive, the scale and speed of the equity rally suggest markets could be pricing in a far more robust global growth outlook than current fundamentals warrant. This disconnect may reflect the influence of other powerful forces — heightened optimism over AI-driven productivity gains, expectations of further central bank easing following softer inflation prints, and a general revival of risk appetite after earlier geopolitical and policy scares. Still, the danger is that if economic data fail to catch up with these elevated expectations, markets could be vulnerable to sharp reversals.
Chart 1: Global equity market momentum versus global growth and inflation surprises
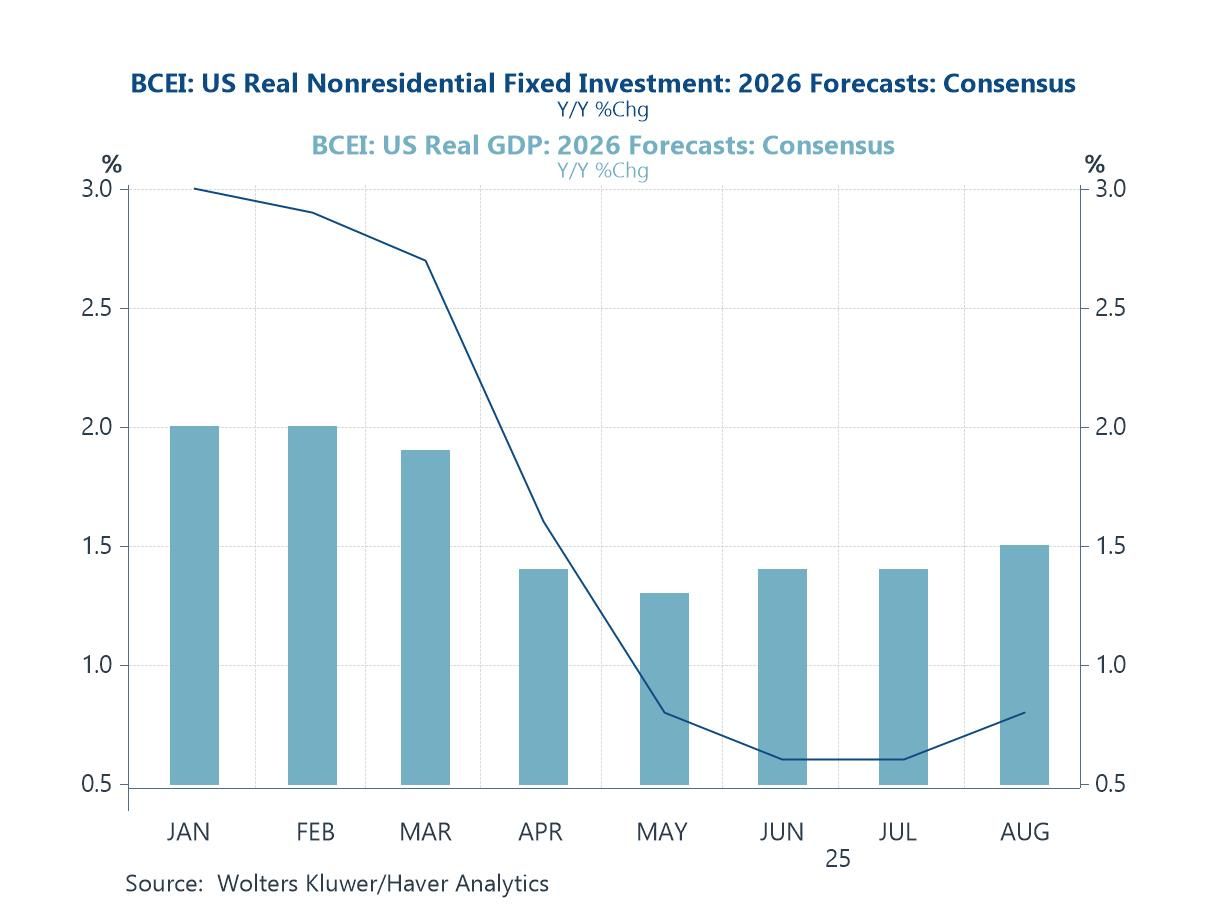
The US growth and investment consensus for 2026 Notwithstanding the buoyant narrative around AI-driven investment, US economic forecasters have steadily pared back their expectations for non-residential (i.e. business) investment growth in 2026 over recent months. Consensus projections have dropped sharply from around 3% at the start of the year to well below 1% by mid-summer, signalling growing caution about the durability of capital spending momentum. This arguably suggests that AI-related enthusiasm has yet to translate into a broad-based uplift in corporate capex plans — at least in the near term.
Chart 2: The evolution of the Blue Chip US growth and business investment consensus for 2026
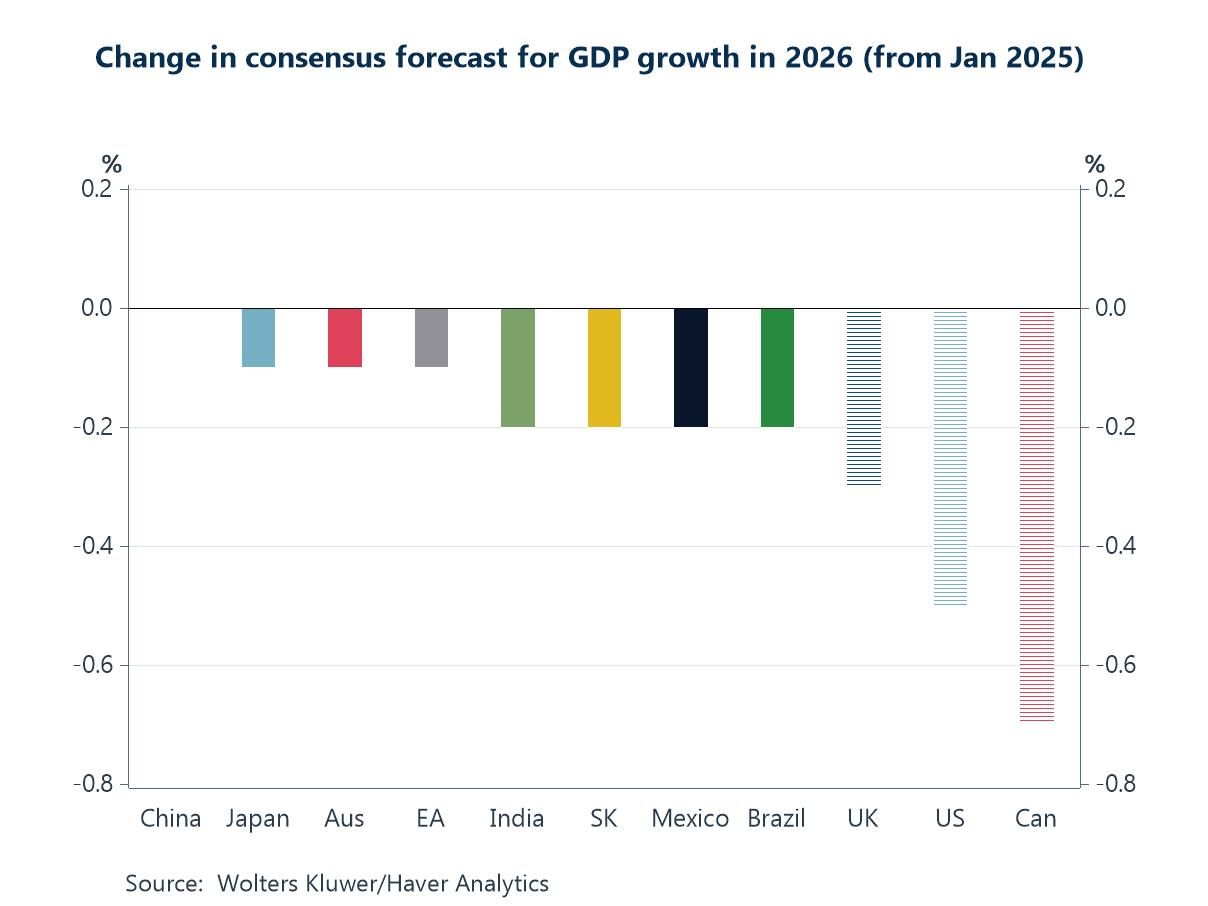
The global growth consensus for 2026 Looking more broadly at the global outlook, consensus GDP forecasts for 2026 have been trimmed across most major economies since the start of the year. While the downgrades are modest for many, the steepest revisions have been concentrated in the US and in economies with high exposure to US trade, including Canada and Mexico. This pattern suggests that the escalation of US tariff measures — both enacted and threatened — is emerging as a drag on medium-term growth expectations, amplifying uncertainty around trade flows, investment planning, and supply chain stability.
Chart 3: The change in the Blue Chip GDP consensus for 2026 (from January to August 2025)
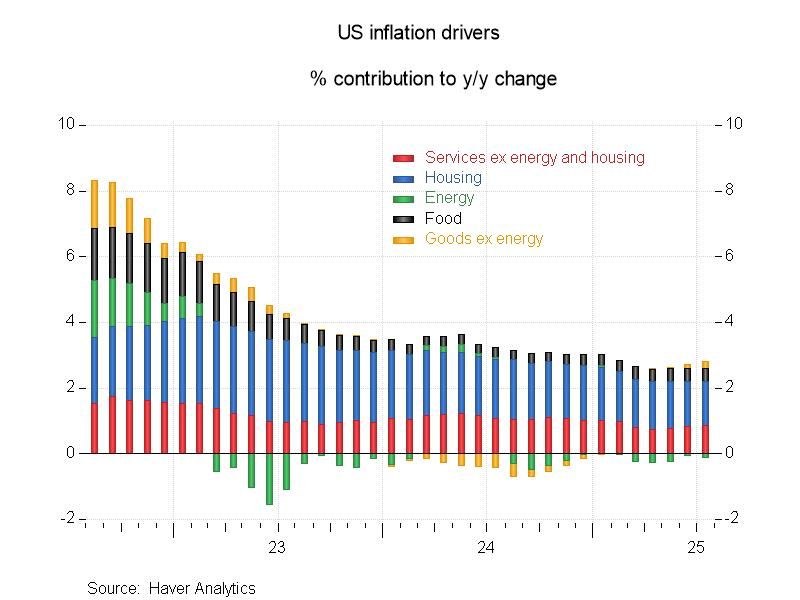
US inflation drivers A relatively benign US inflation report this week has strengthened market conviction that the Fed could deliver another rate cut at its September meeting. The data underline a broader trend in recent months: most of the remaining inflationary pressure is concentrated in services and, in particular, housing. However, housing’s contribution is now easing and may largely reflect the lagged impact of earlier monetary tightening rather than a persistent source of upward pressure. That said, the picture is not without risks — in particular, US tariff policies raise the prospect of renewed goods price inflation in the months ahead, as higher import costs filter through supply chains.
Chart 4: US inflation drivers: Contributions to y/y change in headline CPI inflation
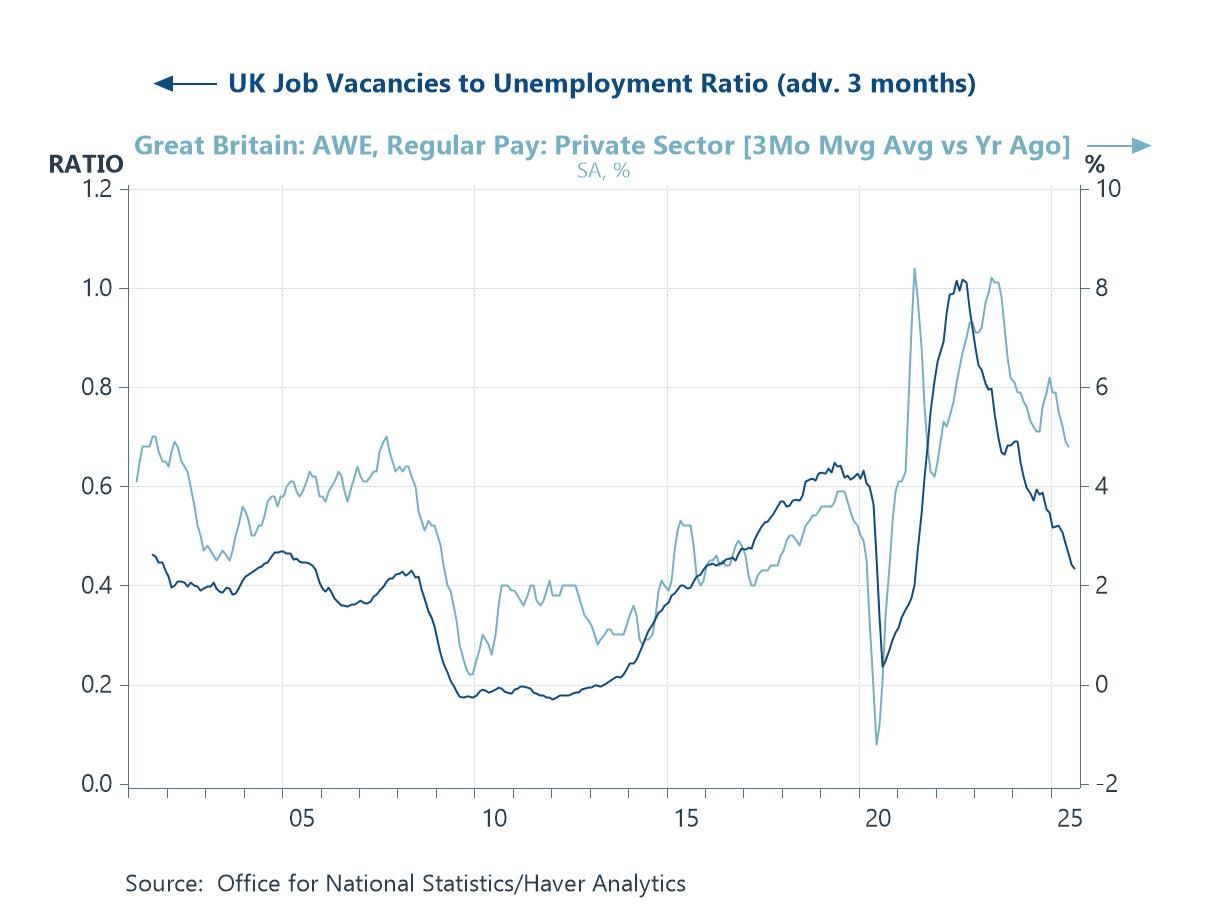
The UK labour market This week’s UK labour market data added to evidence of a cooling jobs backdrop, with employment growth slowing (and on some measures falling), unemployment drifting higher, and vacancy levels continuing their steady decline. As the chart below shows, the vacancies-to-unemployment ratio has fallen sharply from its post-pandemic highs, a trend that typically leads private sector pay growth lower. Even though the BoE cut policy rates by 25bps last week, the accompanying commentary was distinctly hawkish. These labour market readings, however, arguably strengthen the case for another rate cut in the months ahead, particularly if inflation continues to drift toward target.
Chart 5: The job vacancies to unemployment ratio in the UK versus average earnings growth
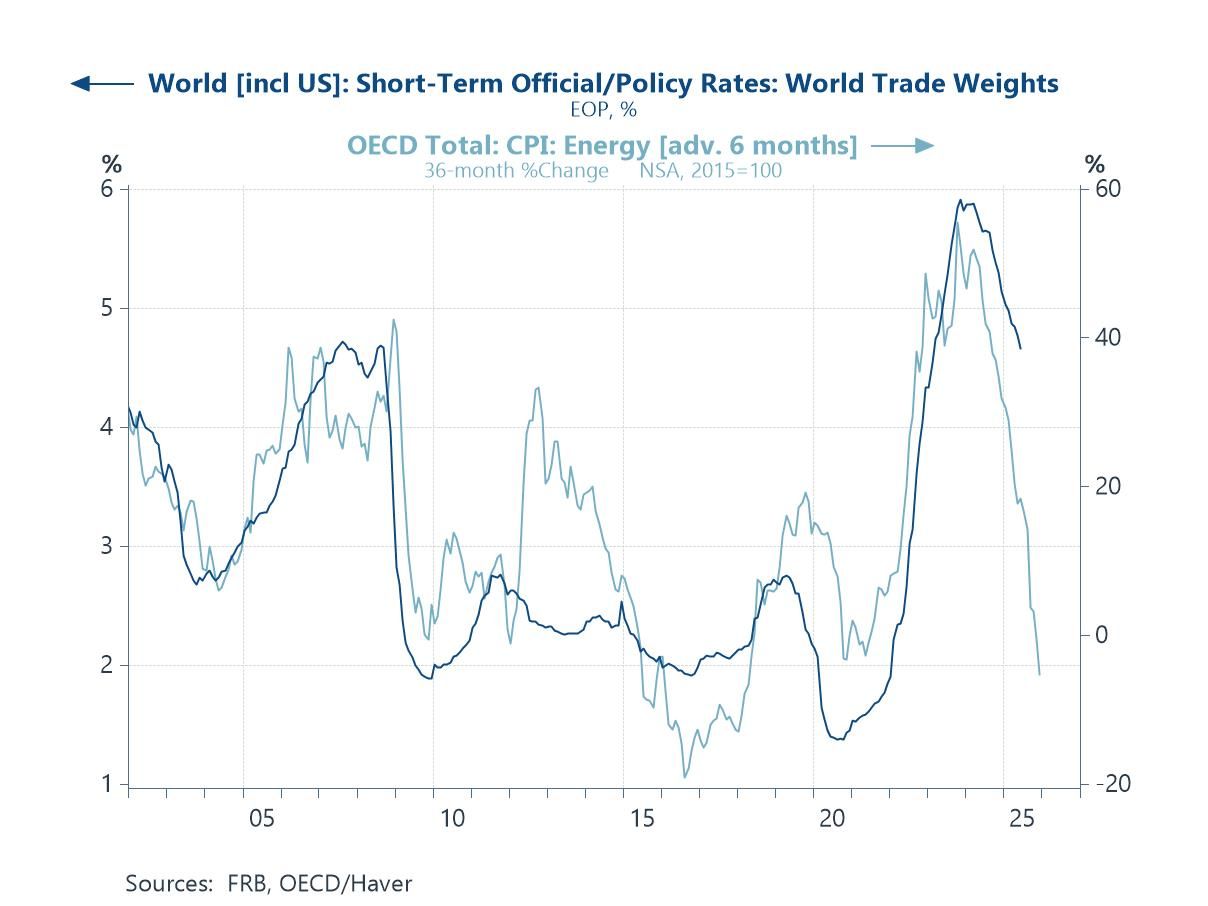
Energy prices and monetary policy Energy price swings will remain a key determinant of the global inflation and interest rate trajectory in the months ahead. As the final chart below shows, movements in energy prices have historically led shifts in policy rates, underscoring their influence on central bank decision-making. While tariff-related pressures threaten to re-ignite goods price inflation, energy dynamics act as a critical counterweight — with the recent sharp decline offering potential disinflationary relief. The balance between these opposing forces will be central to whether global policy rates can ease meaningfully or remain constrained by renewed cost-push pressures.
Chart 6: Energy prices in the OECD versus Haver’s global aggregation of central bank policy rates

Andrew Cates
AuthorMore in Author Profile »Andy Cates joined Haver Analytics as a Senior Economist in 2020. Andy has more than 25 years of experience forecasting the global economic outlook and in assessing the implications for policy settings and financial markets. He has held various senior positions in London in a number of Investment Banks including as Head of Developed Markets Economics at Nomura and as Chief Eurozone Economist at RBS. These followed a spell of 21 years as Senior International Economist at UBS, 5 of which were spent in Singapore. Prior to his time in financial services Andy was a UK economist at HM Treasury in London holding positions in the domestic forecasting and macroeconomic modelling units. He has a BA in Economics from the University of York and an MSc in Economics and Econometrics from the University of Southampton.
More Economy in Brief


