 Asia
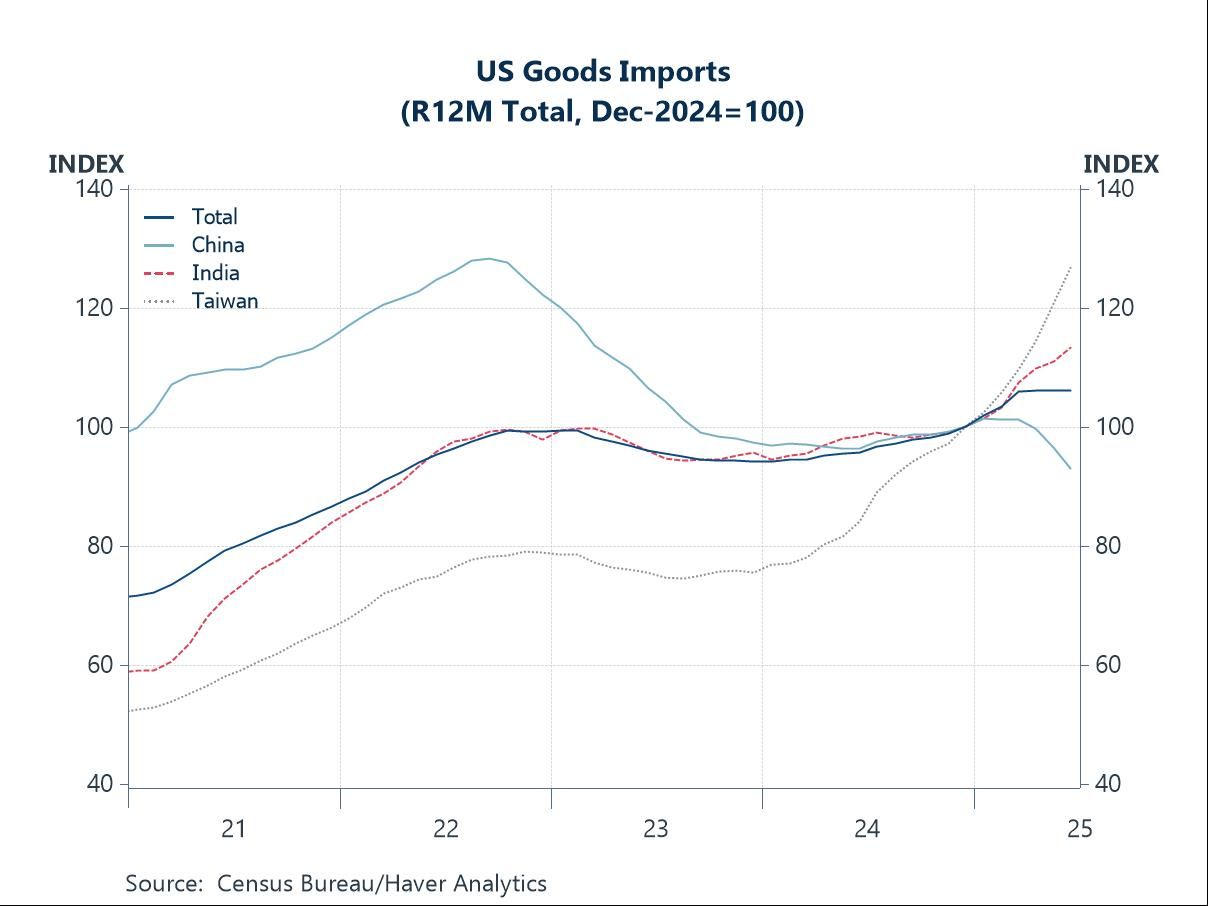
AsiaThis week, we explore how the new round of US reciprocal tariffs is reshaping global trade patterns. The US import profile is already being reshaped: imports from China have fallen as intended, while higher shipments from other economies, such as India and Taiwan, have broadly offset the decline, keeping overall import levels largely unchanged (chart 1). Coupled with steadily growing exports, this has improved the US trade balance. China, meanwhile, has absorbed the hit from reduced US export revenues by redirecting shipments elsewhere, particularly to its Asian trading partners. Substantial growth has been seen in transportation goods, including EVs, while exports of mineral products have declined (chart 2).
Looking more broadly, the current tumultuous global trade landscape—while having supported Asian growth (chart 3) through front-loading by US importers—now poses significant downside risks for the region, particularly with higher US reciprocal tariffs in effect. At the same time, the combination of these growth risks and cooling inflation has paved the way for further central bank easing across much of Asia. Many central banks have opted to follow the path of least resistance, implementing additional easing so far this year (chart 4), with further moves expected in the coming weeks.
In sector-specific developments with potential global impact, President Trump’s threat to impose up to 300% tariffs on semiconductors could reverberate through Asia, home to most of the world’s semiconductor manufacturing and the primary source of US imports (chart 5). This would also affect American consumers, given how pervasive semiconductors are in everyday products. Another potential flashpoint is rare earths: Trump has threatened a 200% tariff on China if it does not supply sufficient magnets, underscoring China’s dominant position in the sector (chart 6).
The new normal We have entered a new normal, marked by US President Trump’s updated reciprocal tariff rates that took effect earlier this month. Beyond the usual considerations—such as comparative production advantages, shipping costs, and geographic proximity—producers now must also account for varying US tariff rates in their decisions. They must decide whether to onshore production to the US, reshore from abroad, or shift operations to economies facing lower US tariffs. Given how fluid the tariff landscape remains, it is unsurprising that many businesses are cautious about committing to major, long-term investments. Moreover, with Washington increasingly hawkish on alleged “transshipments” designed to circumvent tariffs—particularly from economies like China—producers face added deterrents against simply re-routing trade flows. As shown in Chart 1, this new tariff regime has already reshaped US trade patterns. Imports from China have cooled sharply as the rivalry intensified and mutual tariffs escalated earlier. In contrast, despite persistent uncertainty over future trade actions, US imports from some other Asian economies—such as Taiwan and India—have surged, led by computer and electronic products. Overall, rolling 12-month US import values have stalled this year, while exports have continued to expand, resulting in an improved US trade balance.