U.S. Existing Home Sales Rise Slightly in July; Home Prices Decline
by:Tom Moeller
|in:Economy in Brief
Summary
- Home sales remain below recent high in December.
- Sales are slightly higher m/m in most of country.
- Median sales price slips from record high.
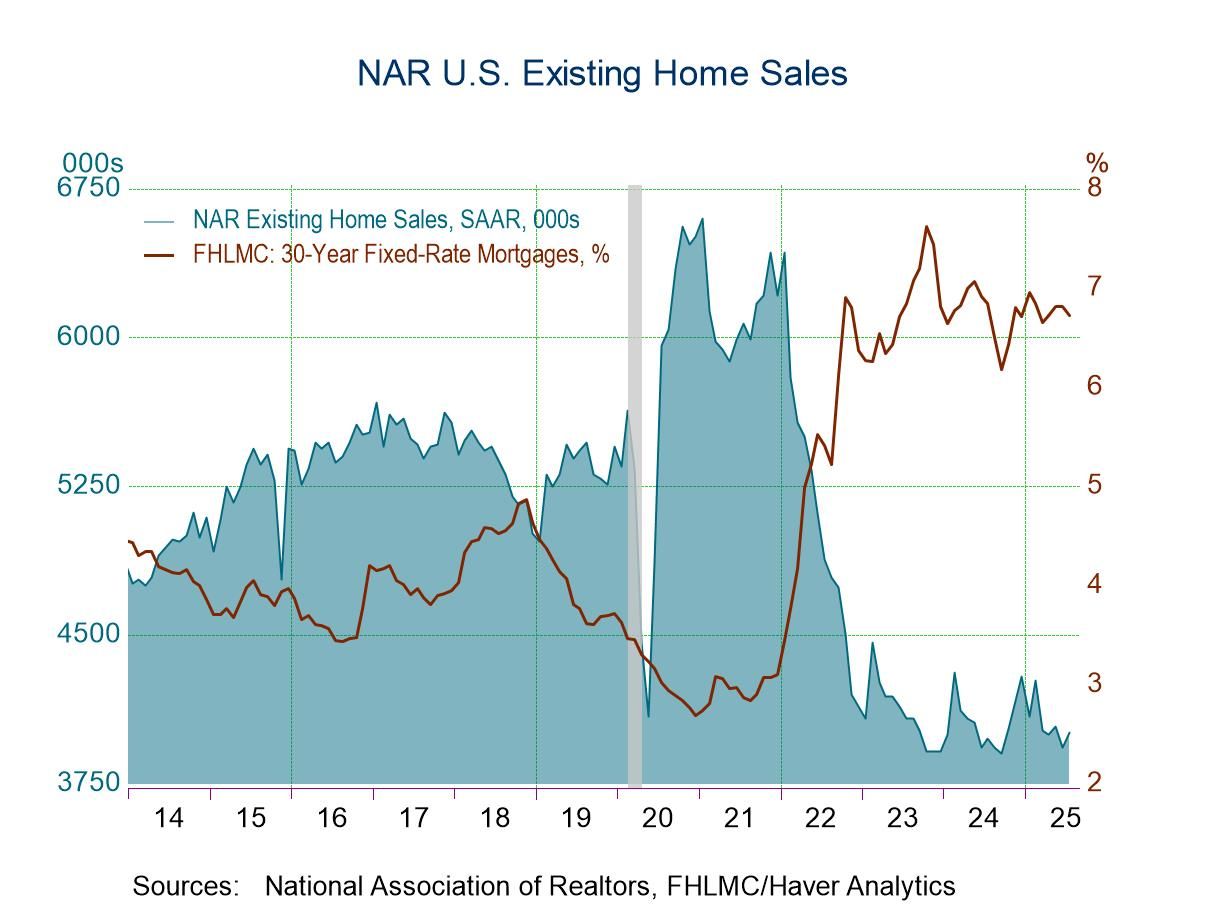
Existing home sales rose 2.0% (0.8% y/y) to 4.01 million (SAAR) in July after falling 2.7% in June to an unrevised to 3.93 million and rising 1.0% to 4.04 million in May, according to the National Association of Realtors (NAR). The Action Economics Forecast Survey expected 3.91 million unit sales in July. Last month’s sales decline accompanied a decline in the effective 30-year mortgage interest rate to 6.72% from 6.82% in June. The sales figures are based on closings of sales signed over the past couple of months.
Existing single-family home sales rose 2.0% (1.1% y/y) during July to 3.64 million units after a 3.0% decline to 3.57 million in June and a 1.4% May rise to 3.68 million. Sales of condos and co-ops rose 2.8% (-2.6% y/y) to 370,000 after holding steady in June.
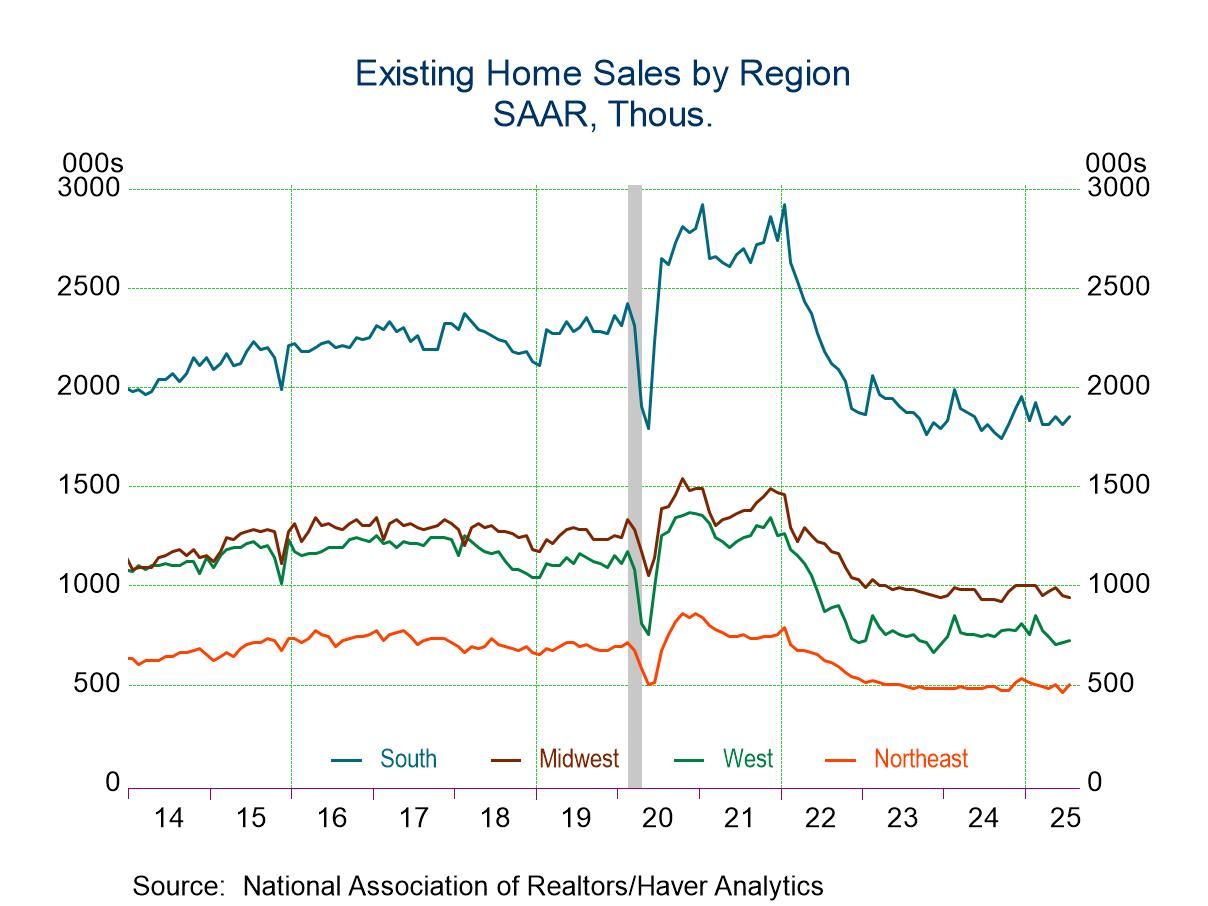
Sales were mixed across the country last month. Sales in the Northeast increased 8.7% (2.0% y/y) to 500,000 following an 8.0% June decline. Sales in the South improved 2.2% both m/m and y/y to 1.85 million, after falling 2.2% in June. Sales in the West rose 1.4% (-4.0% y/y) to 720,000 after a 1.4% June gain. Falling by 1.1% (+1.1% y/y) to 940,000 were sales in the Midwest after falling 4.0% in June.
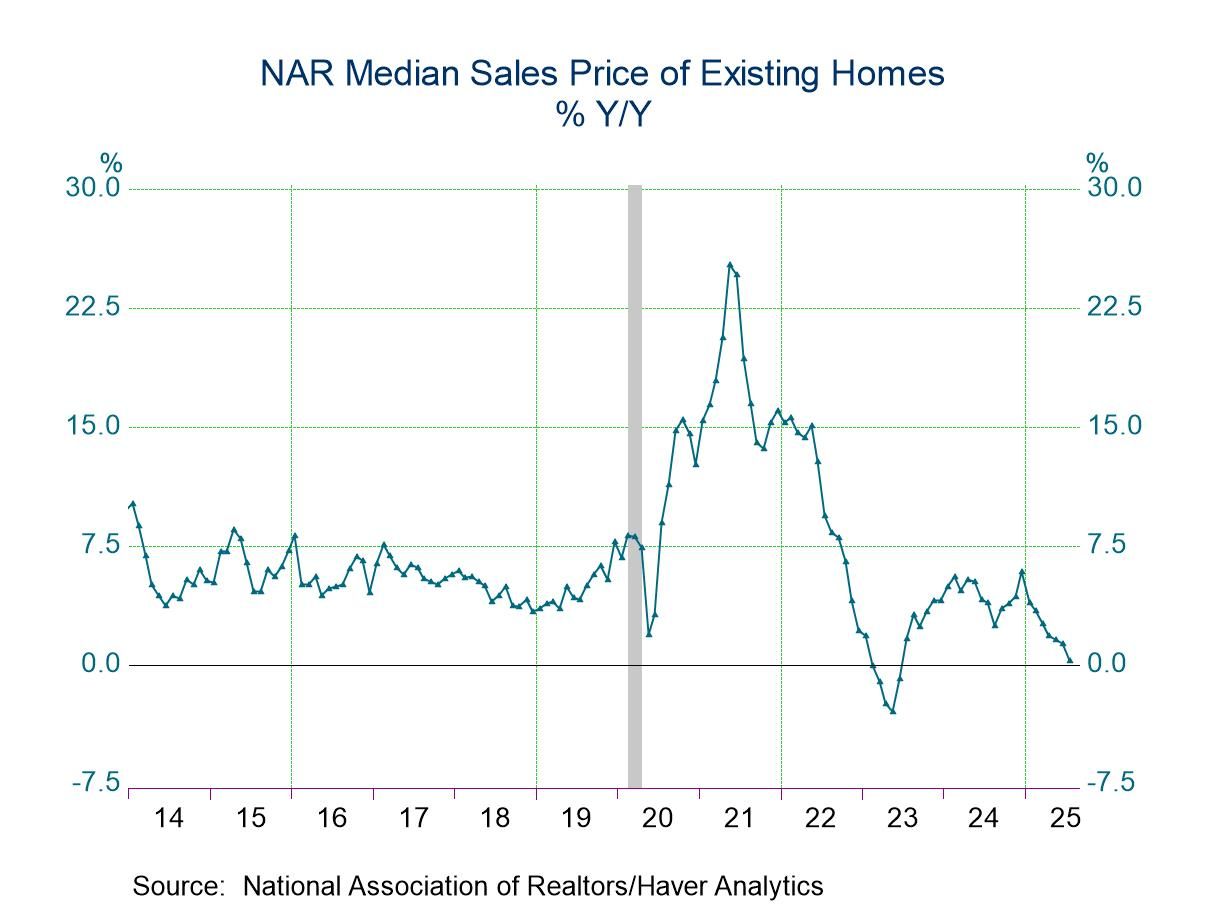
The median price of all existing homes (NSA) in July weakened 2.4% (+0.2% y/y) from the June record to $422,400. The median price of an existing single-family home fell 2.3% (+0.3% y/y) to $428,500 in July, and the median price of condos & co-ops declined 3.1% (-1.2% y/y) to $362,600 last month. Prices for homes in the West declined 1.1% (-1.4% y/y) to $620,700 while prices in the Northeast fell 6.3% (+0.8% y/y) to $509,300. In the South, prices were off 1.8% (-0.6% y/y) to $367,400 while in the Midwest, home prices fell 1.1% (+3.9% y/y) to $333,800.
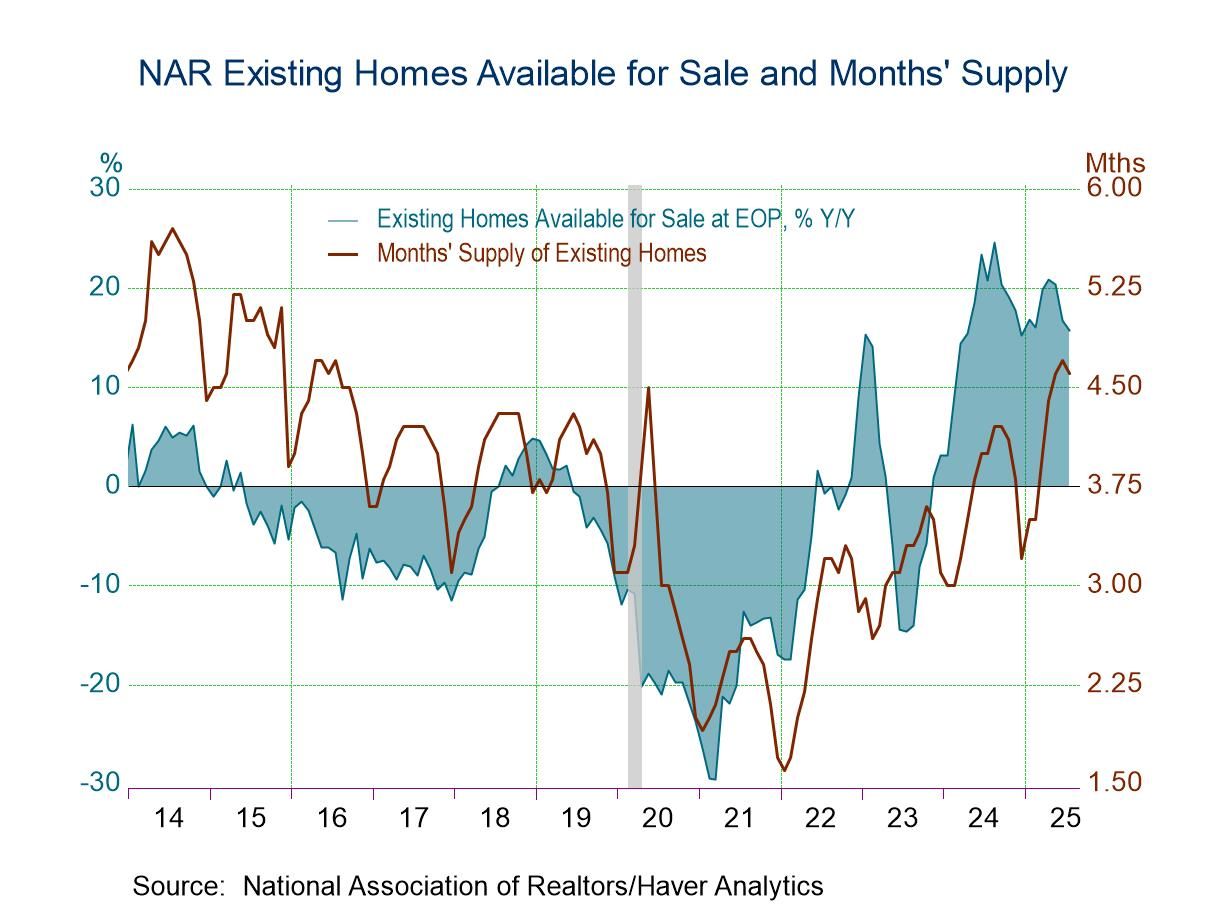
The number of existing homes for sale (NSA) rose 0.6% (15.7% y/y) to 1.55 million units in July. The supply of homes on the market at the current selling rate (NSA) slipped to 4.6 months, still nearly the highest level in nine years, up from a low of 1.6 months in January 2022.
The data on existing home sales, prices and affordability are compiled by the National Association of Realtors. The data on single-family home sales extend back to February 1968. Total sales and price data and regional sales can be found in Haver's USECON database. Regional price and affordability data and national inventory data are available in the REALTOR database. Mortgage interest rates can be found in the WEEKLY database. The expectations figure is from the Action Economics Forecast Survey, reported in the AS1REPNA database.
The minutes to the latest FOMC meeting can be found here.

Tom Moeller
AuthorMore in Author Profile »Prior to joining Haver Analytics in 2000, Mr. Moeller worked as the Economist at Chancellor Capital Management from 1985 to 1999. There, he developed comprehensive economic forecasts and interpreted economic data for equity and fixed income portfolio managers. Also at Chancellor, Mr. Moeller worked as an equity analyst and was responsible for researching and rating companies in the economically sensitive automobile and housing industries for investment in Chancellor’s equity portfolio. Prior to joining Chancellor, Mr. Moeller was an Economist at Citibank from 1979 to 1984. He also analyzed pricing behavior in the metals industry for the Council on Wage and Price Stability in Washington, D.C. In 1999, Mr. Moeller received the award for most accurate forecast from the Forecasters' Club of New York. From 1990 to 1992 he was President of the New York Association for Business Economists. Mr. Moeller earned an M.B.A. in Finance from Fordham University, where he graduated in 1987. He holds a Bachelor of Arts in Economics from George Washington University.
More Economy in Brief


 Global
