 Global| Jan 15 2026
Charts of the Week: Between Optimism and Uncertainty
by:Andrew Cates
|in:Economy in Brief
Summary
The global backdrop remains unsettled, reflected in rising gold prices amid geopolitical tensions—most recently around Venezuela—and renewed political noise, including questions over Federal Reserve independence. At the same time, however, many major equity indices remain at or close to all-time highs, buoyed by optimism around AI and reinforced by a run of relatively benign US inflation readings. Against this mixed backdrop, the charts this week point to a global outlook that is becoming more differentiated rather than uniformly weaker. Blue Chip forecasts for 2026 growth have edged higher over the past six months, with upgrades concentrated in economies most exposed to the AI investment cycle, notably the US and parts of Asia (chart 1). Central bank expectations remain fluid: while panelists broadly anticipate easing by the Fed and Bank of England, conviction around timing is limited, and the Bank of Japan remains an outlier with further tightening still expected (chart 2). In the UK, that uncertainty sits alongside a deteriorating data flow, with negative economic surprises increasingly tilting market expectations toward an earlier BoE rate cut (chart 3). Turning to the US, special questions highlight a divide over whether AI is already having a noticeable macro impact or whether its effects will emerge more gradually, a tension that mirrors concerns about over-optimism in financial markets (chart4). That debate is echoed in the recent pick-up in US productivity growth and the step-change in business formation—developments that may reflect AI-related dynamics but which also warrant caution given the historically cyclical nature of productivity (chart 5). Finally, China’s trade data point to a continued re-orientation of export growth away from the US and toward Europe and ASEAN, consistent with evolving US trade policy and broader supply-chain realignment (chart 6).
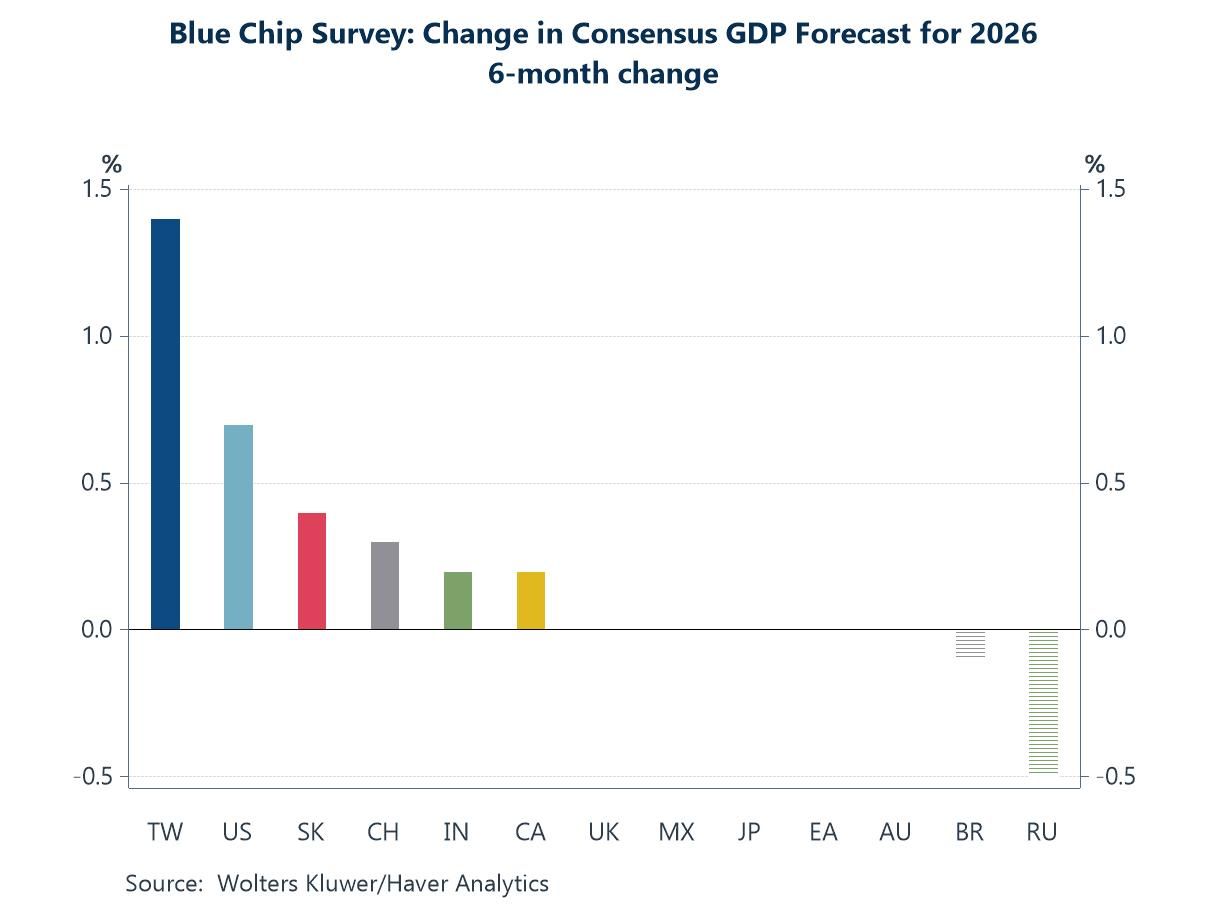
The growth consensus for 2026 Consensus growth forecasts for 2026 have continued to firm over the past six months, with upward revisions most pronounced in economies that are more directly exposed to the global AI investment cycle. Taiwan stands out, reflecting its central role in advanced semiconductor manufacturing and the spillovers from sustained AI-related capex across the global tech supply chain. The US has also seen a sizeable upgrade, consistent with strong domestic investment in AI infrastructure and data-centre capacity, alongside resilient demand for high-value tech services. Elsewhere in Asia, upgrades to South Korea and, to a lesser extent, China and India point to a broader regional benefit from the AI-driven electronics and capital-goods cycle, even as underlying macro conditions remain mixed. Canada has also seen modest upward revisions, likely reflecting its close integration with US investment trends. By contrast, revisions across much of Europe and Japan have been more muted, while forecasts for Russia remain under downward pressure.
Chart 1: 6-month change in Blue Chip consensus GDP forecast for 2026
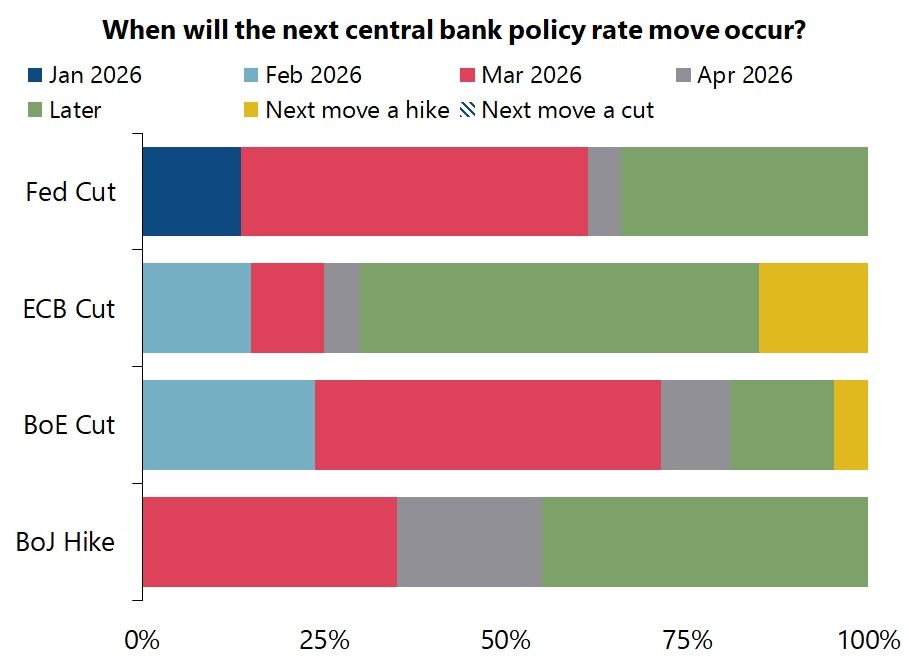
The next steps for central bank policy Based on responses to the special questions in the latest Blue Chip survey, the chart highlights how uncertain panelists remain about the precise timing of the next policy move, even where there is broad agreement on direction. Expectations for both the Fed and the Bank of England are now loosely centred on March 2026 as the most likely window for the next easing step, but the spread of responses points to limited conviction and a high sensitivity to incoming data. By contrast, panelists continue to see the ECB as largely through its easing cycle, with a clear majority expecting any further move only later, if at all. The Bank of Japan remains the clear outlier: while further tightening is still the central expectation, views are split on timing, with panelists divided between a March move and a hike pushed beyond April 2026—highlighting ongoing uncertainty over the durability of domestic inflation and wage dynamics.
Chart 2: Blue Chip Survey Question results concerning central bank policy
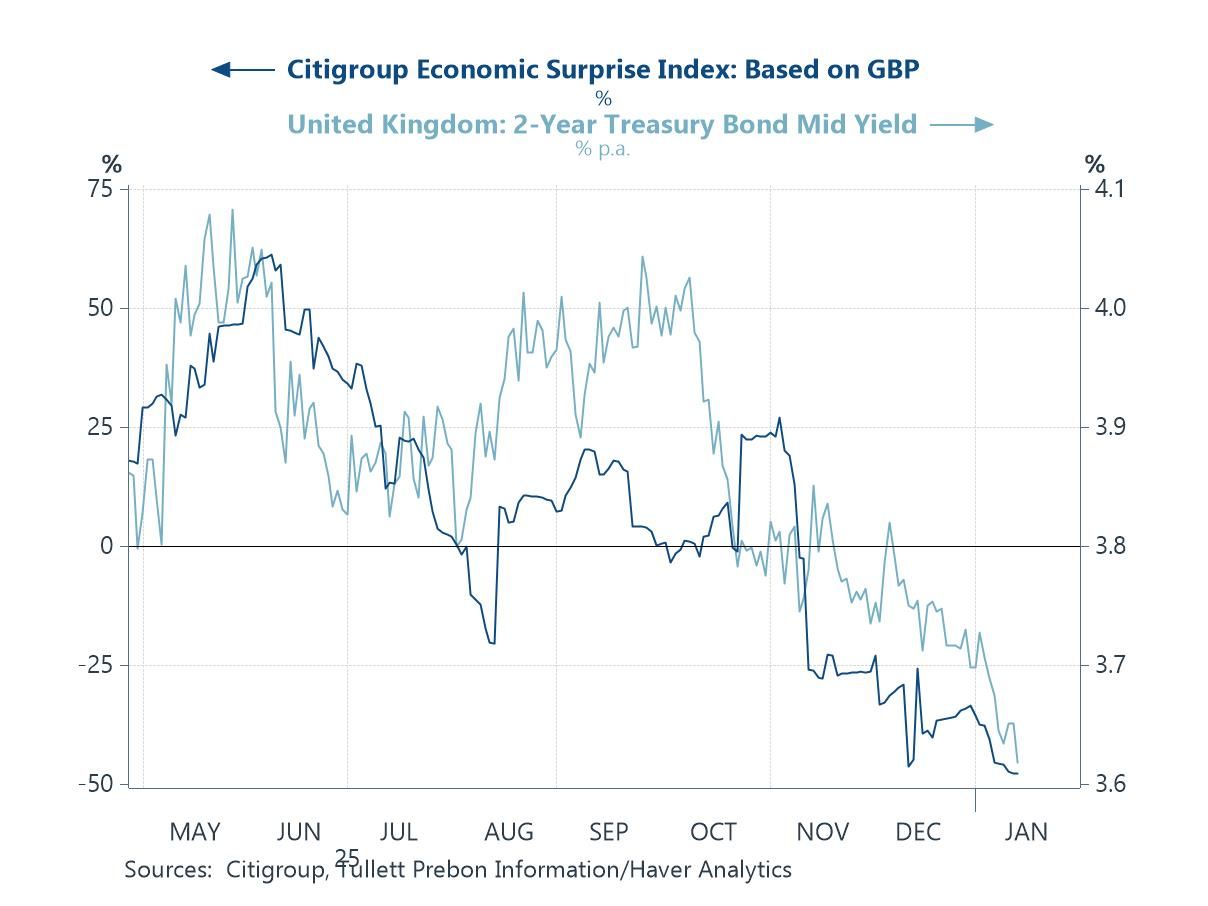
The UK economy and BoE policy While Blue Chip panelists remain divided on the precise timing of the Bank of England’s next policy cut, the latest run of UK data is tilting market expectations toward an earlier move. Economic releases have increasingly fallen short of expectations, a pattern that has coincided with a steady decline in short-dated gilt yields. The negative surprise profile reflects a combination of weak household demand and softer labour-market indicators. This has generated downside momentum in the data, reinforcing the case—at least from a market perspective—for earlier or deeper policy easing.
Chart 3: The Citigroup UK growth surprise index versus 2-year bond yields
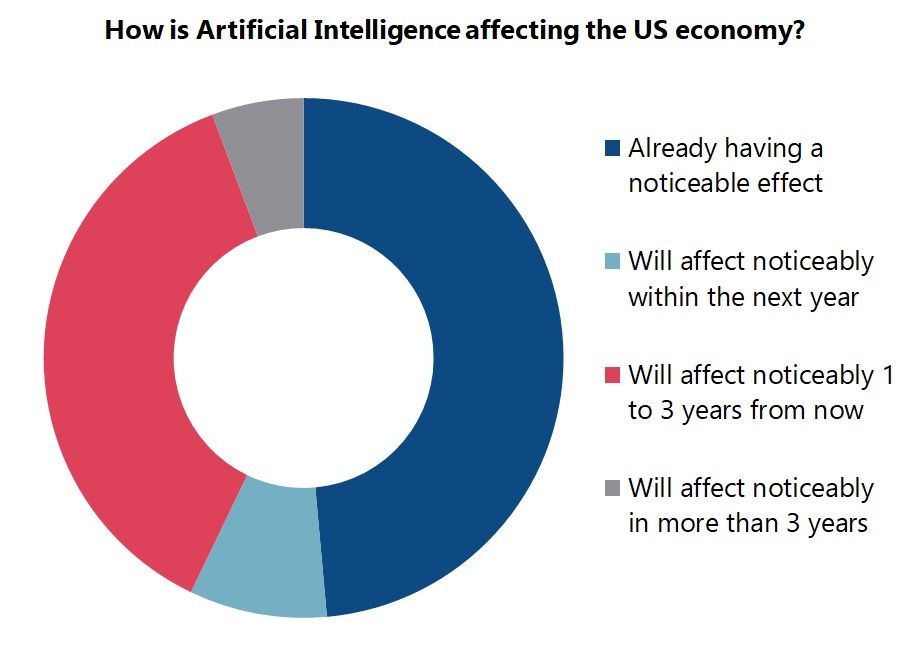
The impact of Artificial Intelligence Responses to the special questions in the latest Blue Chip survey also suggest that panelists are divided over the timing of AI’s macroeconomic impact in the US. A sizeable share already reports seeing noticeable effects, consistent with the rapid pace of AI-related investment and adoption over the past year. At the same time, a similarly large group expects AI’s impact to become more evident only over the next one to three years, implying a belief that productivity and growth effects will materialise with a lag. These views are notable given that a majority of panelists continue to judge anticipated AI-related gains as being overstated in financial markets, underscoring the risk of disappointment—and potential equity market volatility—if realised outcomes fail to match elevated expectations.
Chart 4: Blue Chip Survey Question concerning the impact of Artificial Intelligence on the US
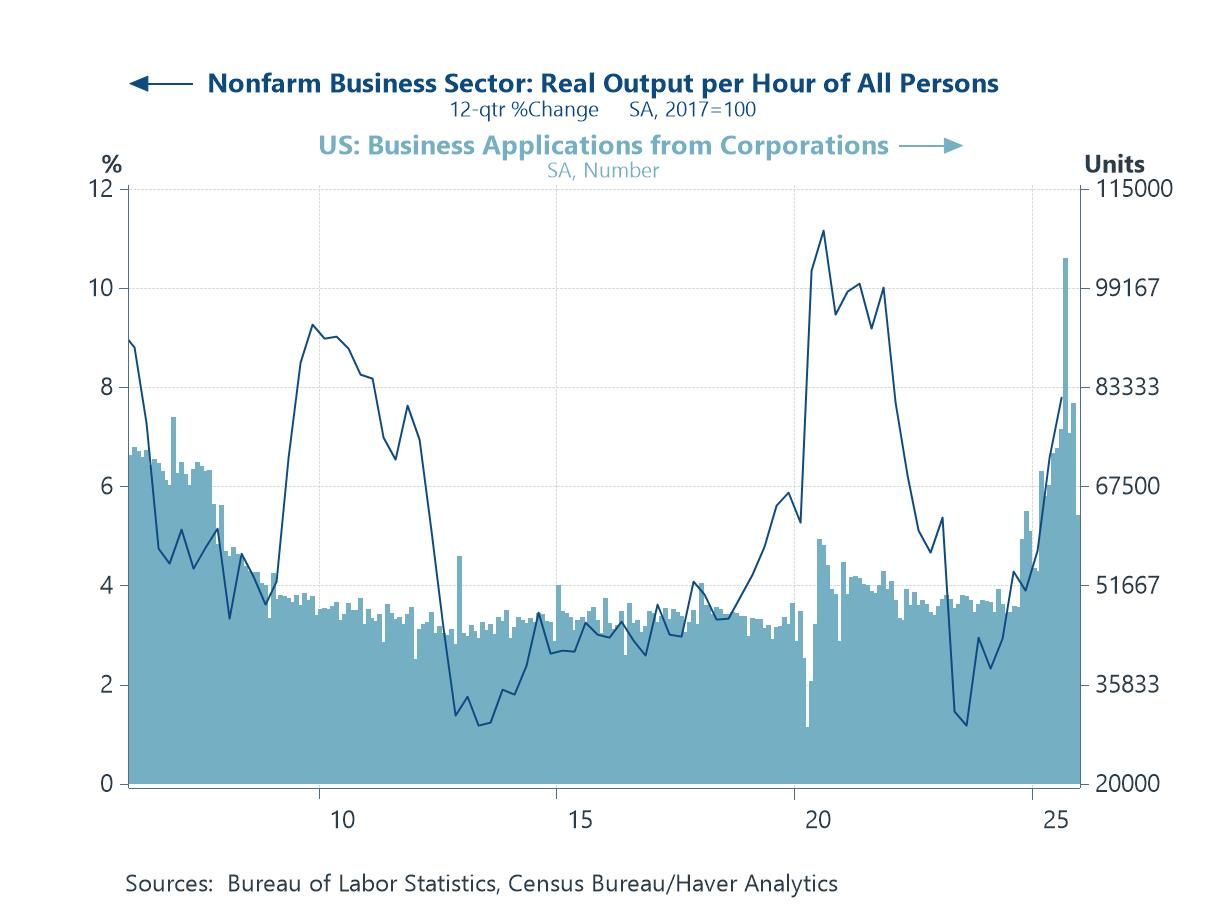
US business formation and productivity growth The chart points to a renewed pick-up in US productivity growth alongside a marked step-up in business applications, a combination that has naturally fuelled interest in the role of AI. The acceleration in output per hour over the past year coincides with a surge in corporate formations, potentially reflecting both heightened investment in new technologies and the emergence of new, AI-enabled business models. That said, productivity growth has historically been highly cyclical, often strengthening late in the cycle or during periods of labour hoarding and cost discipline, before fading again. As such, while AI may be contributing at the margin, it remains too early to conclude that the recent improvement marks a durable, technology-driven shift rather than another cyclical upswing.
Chart 5: US business sector productivity growth versus company business applications
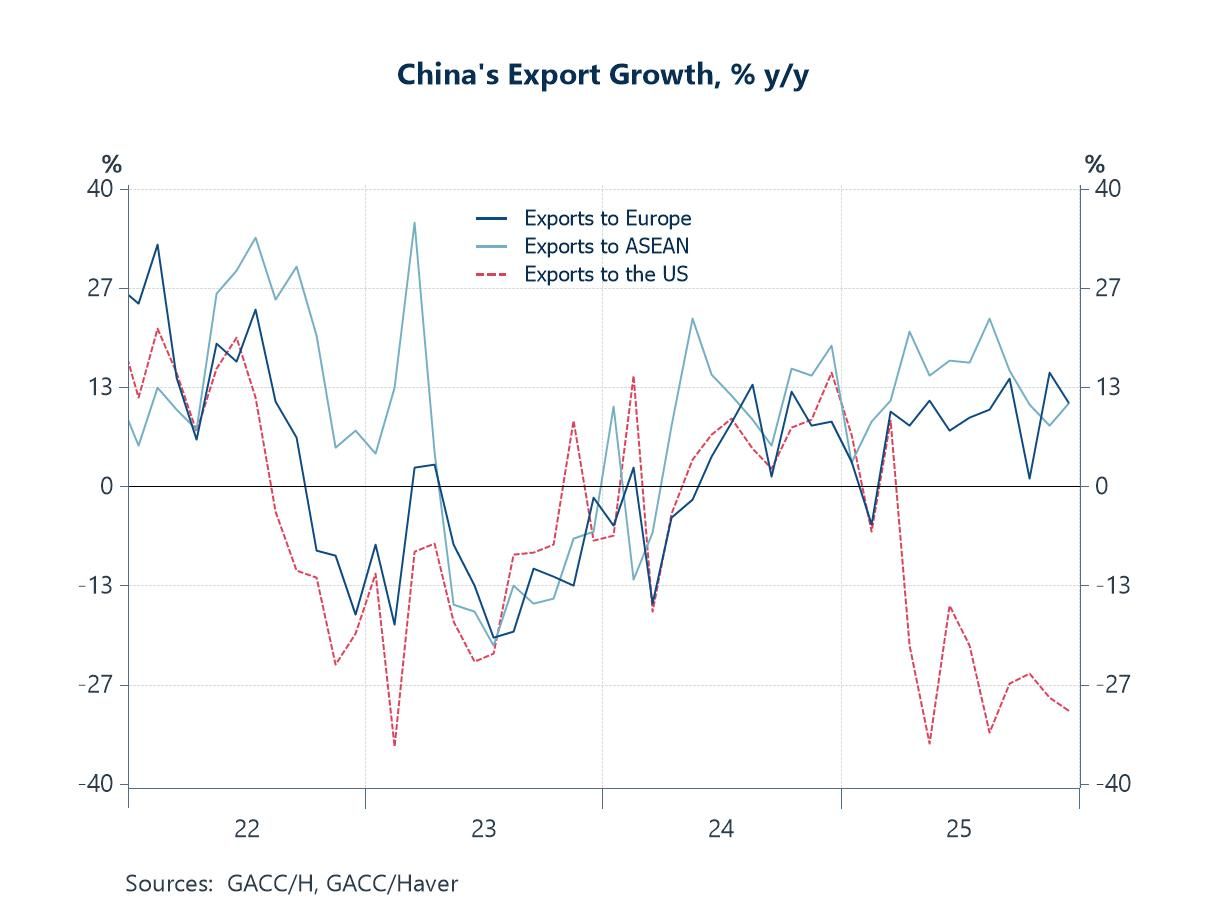
China’s export growth This week’s China trade data revealed that its export growth has continued to rotate away from the US and toward Europe and ASEAN, a pattern that has become more pronounced over the past year. While exports to the US have fallen sharply on a year-on-year basis, shipments to both Europe and ASEAN have held up markedly better, and in recent months have returned to positive growth. This divergence is consistent with the tightening of US trade policy toward China, including higher tariffs, expanded export controls and broader efforts to “de-risk” supply chains. By contrast, trade with Europe and ASEAN appears to be benefiting from trade diversion and re-routing, as Chinese firms redirect exports toward markets where barriers remain lower and supply-chain integration is deeper.
Chart 6: China’s export growth to the Europe, ASEAN and the US

Andrew Cates
AuthorMore in Author Profile »Andy Cates joined Haver Analytics as a Senior Economist in 2020. Andy has more than 25 years of experience forecasting the global economic outlook and in assessing the implications for policy settings and financial markets. He has held various senior positions in London in a number of Investment Banks including as Head of Developed Markets Economics at Nomura and as Chief Eurozone Economist at RBS. These followed a spell of 21 years as Senior International Economist at UBS, 5 of which were spent in Singapore. Prior to his time in financial services Andy was a UK economist at HM Treasury in London holding positions in the domestic forecasting and macroeconomic modelling units. He has a BA in Economics from the University of York and an MSc in Economics and Econometrics from the University of Southampton.
More Economy in Brief


