 Asia| Aug 26 2025
Economic Letter from Asia: A New Normal
This week, we explore how the new round of US reciprocal tariffs is reshaping global trade patterns. The US import profile is already being reshaped: imports from China have fallen as intended, while higher shipments from other economies, such as India and Taiwan, have broadly offset the decline, keeping overall import levels largely unchanged (chart 1). Coupled with steadily growing exports, this has improved the US trade balance. China, meanwhile, has absorbed the hit from reduced US export revenues by redirecting shipments elsewhere, particularly to its Asian trading partners. Substantial growth has been seen in transportation goods, including EVs, while exports of mineral products have declined (chart 2).
Looking more broadly, the current tumultuous global trade landscape—while having supported Asian growth (chart 3) through front-loading by US importers—now poses significant downside risks for the region, particularly with higher US reciprocal tariffs in effect. At the same time, the combination of these growth risks and cooling inflation has paved the way for further central bank easing across much of Asia. Many central banks have opted to follow the path of least resistance, implementing additional easing so far this year (chart 4), with further moves expected in the coming weeks.
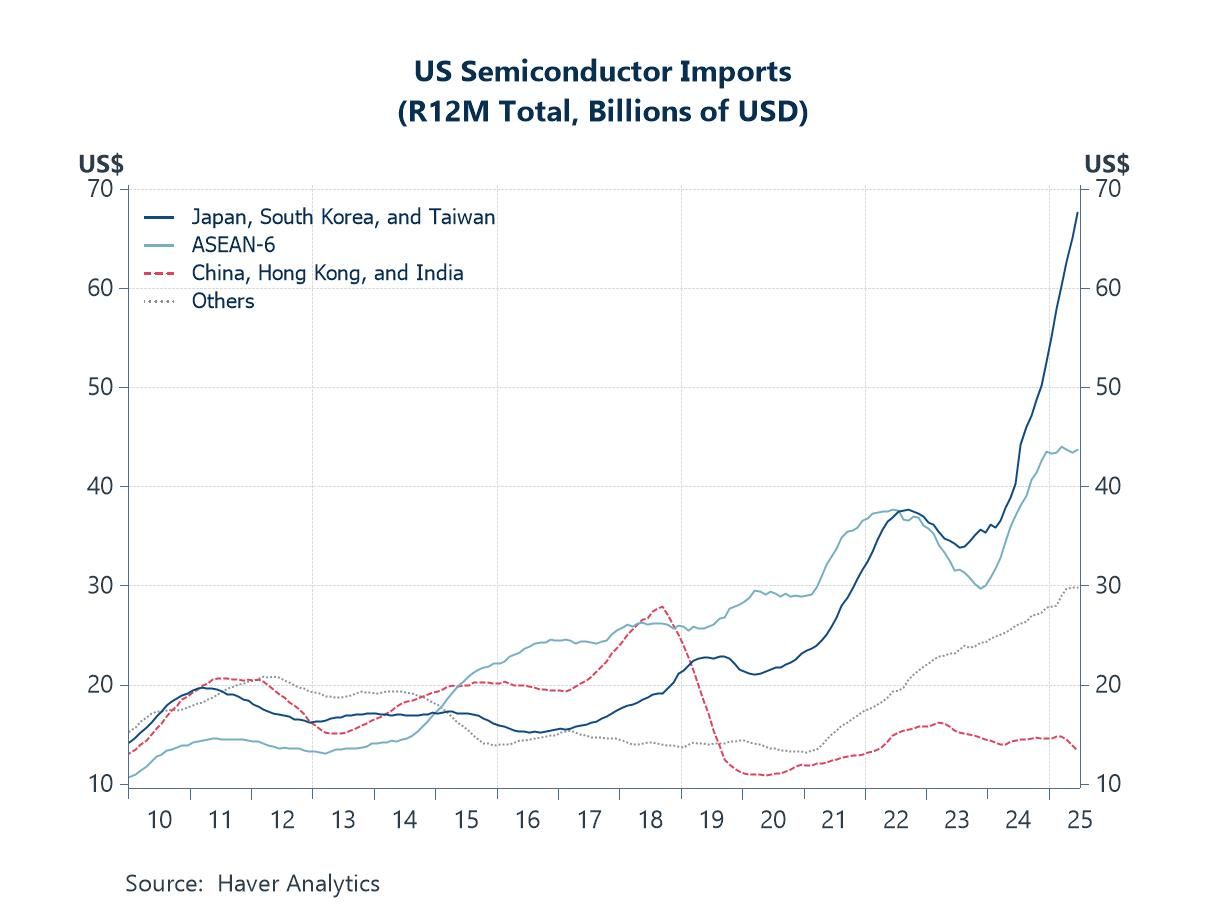
In sector-specific developments with potential global impact, President Trump’s threat to impose up to 300% tariffs on semiconductors could reverberate through Asia, home to most of the world’s semiconductor manufacturing and the primary source of US imports (chart 5). This would also affect American consumers, given how pervasive semiconductors are in everyday products. Another potential flashpoint is rare earths: Trump has threatened a 200% tariff on China if it does not supply sufficient magnets, underscoring China’s dominant position in the sector (chart 6).
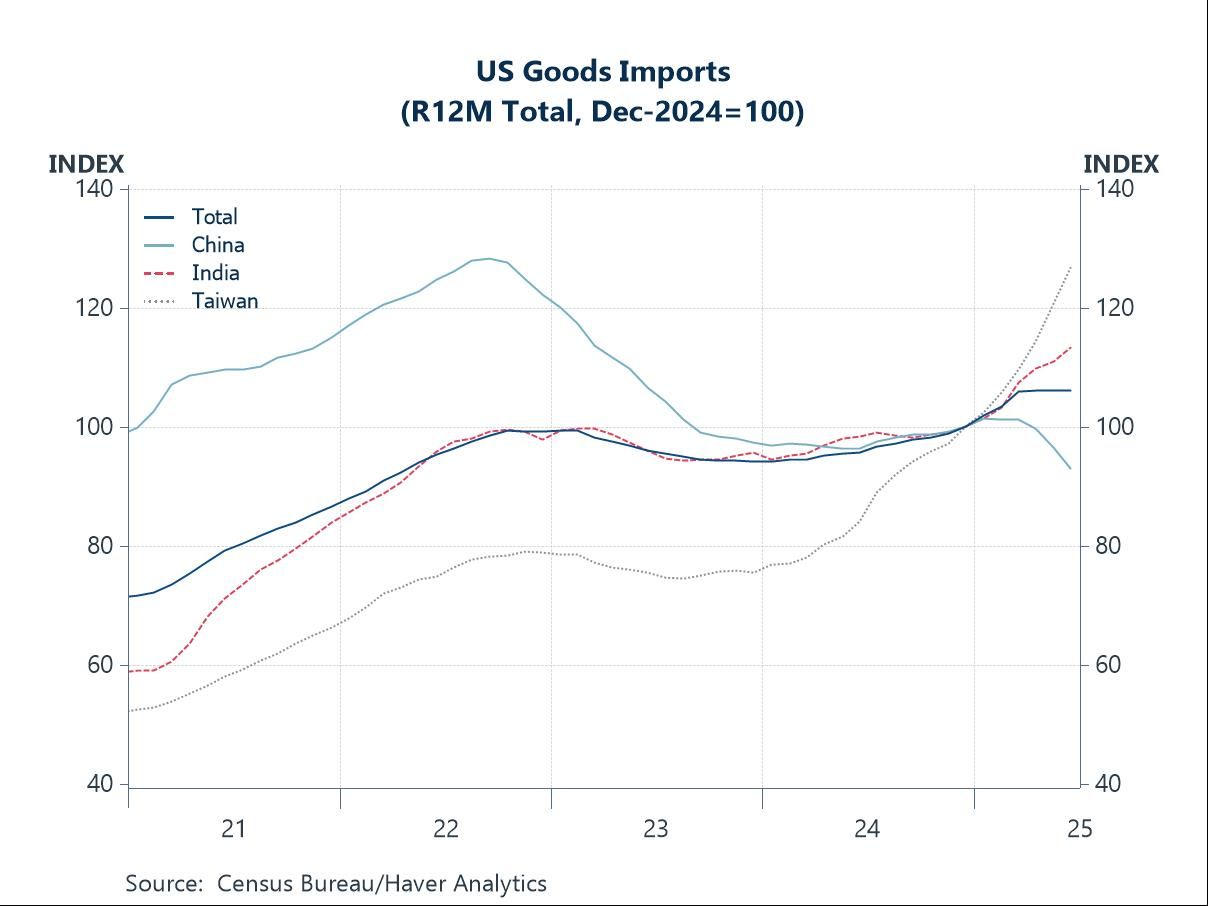
The new normal We have entered a new normal, marked by US President Trump’s updated reciprocal tariff rates that took effect earlier this month. Beyond the usual considerations—such as comparative production advantages, shipping costs, and geographic proximity—producers now must also account for varying US tariff rates in their decisions. They must decide whether to onshore production to the US, reshore from abroad, or shift operations to economies facing lower US tariffs. Given how fluid the tariff landscape remains, it is unsurprising that many businesses are cautious about committing to major, long-term investments. Moreover, with Washington increasingly hawkish on alleged “transshipments” designed to circumvent tariffs—particularly from economies like China—producers face added deterrents against simply re-routing trade flows. As shown in Chart 1, this new tariff regime has already reshaped US trade patterns. Imports from China have cooled sharply as the rivalry intensified and mutual tariffs escalated earlier. In contrast, despite persistent uncertainty over future trade actions, US imports from some other Asian economies—such as Taiwan and India—have surged, led by computer and electronic products. Overall, rolling 12-month US import values have stalled this year, while exports have continued to expand, resulting in an improved US trade balance.
Chart 1: US goods imports by major Asia trading partner
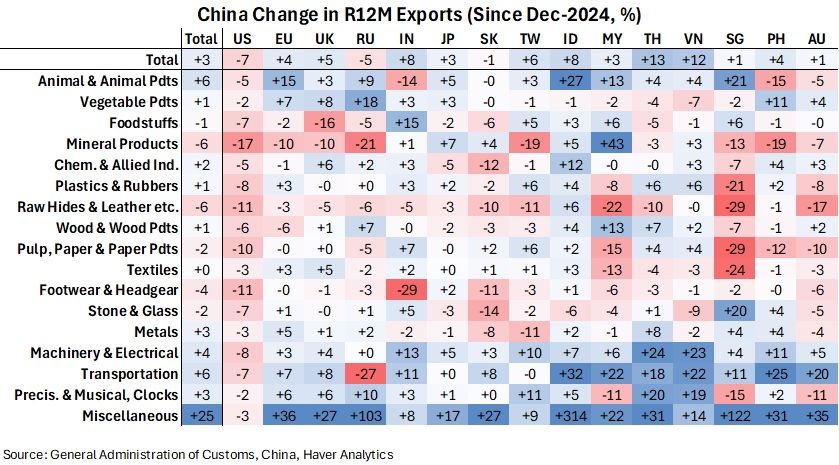
Although China’s trade has been hurt by reduced US imports, chart 2 shows its overall exports have still grown. While its trade with the US has fallen sharply, exports to other partners, particularly in Asia, have risen significantly. Chinese exports have risen sharply to ASEAN economies such as Thailand, Vietnam, and Indonesia, as well as to other Asian markets like India and Taiwan. Transportation goods, especially automobiles, account for much of this surge. This suggests China has, so far, managed to more than offset lost US export revenue by redirecting goods to other markets. On the other hand, China’s exports of mineral products and some other goods have declined in several destinations. Interestingly, China’s exports of goods classified as “miscellaneous” have surged sharply.
Chart 2: China’s change in 12-month exports
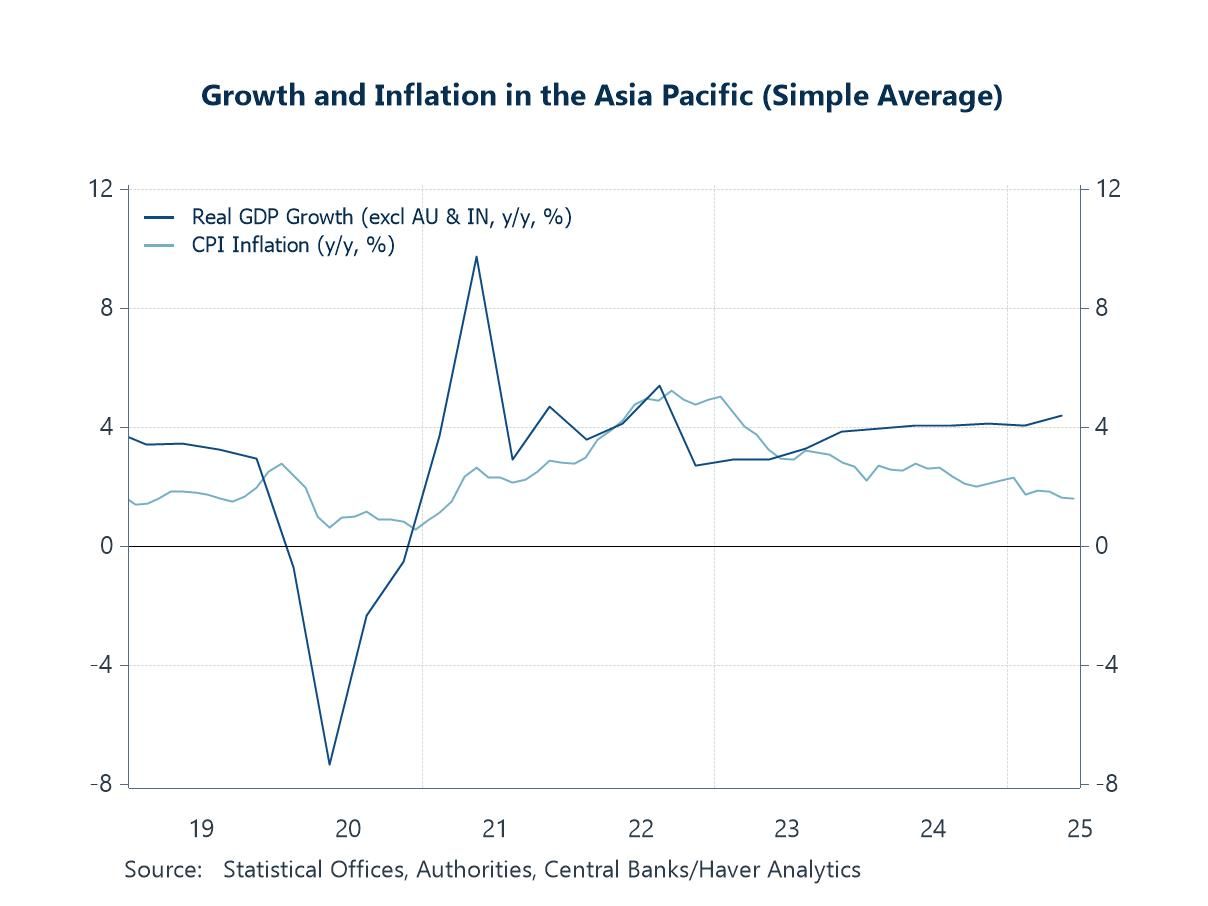
Growth, inflation, and monetary policy The latest round of US tariff actions has only just begun to register in US inflation data, but their impact on Asia’s trade—and by extension, growth—is already evident. Chart 3 shows that, on average, regional growth has held steady so far. Yet this masks a clear divergence among economies. Taiwan and Vietnam rode strong electronics demand and export momentum in Q2, while Thailand continues to struggle to identify new growth engines. Many Asian economies also benefited earlier from US importers front-loading purchases to avoid potential tariff hikes. Those temporary gains are likely to fade, and when combined with the tariff increases that took effect earlier this month, they present a significant downside risk after a robust start to the year. Looking ahead, India’s Q2 GDP data is expected later this week, followed by Australia’s figures in early September. Meanwhile, inflation pressures have eased across much of Asia. China and Thailand are still grappling with deflationary trends, whereas Japan and Vietnam continue to see relatively firm price growth.
Chart 3: Asia Pacific real GDP growth and inflation
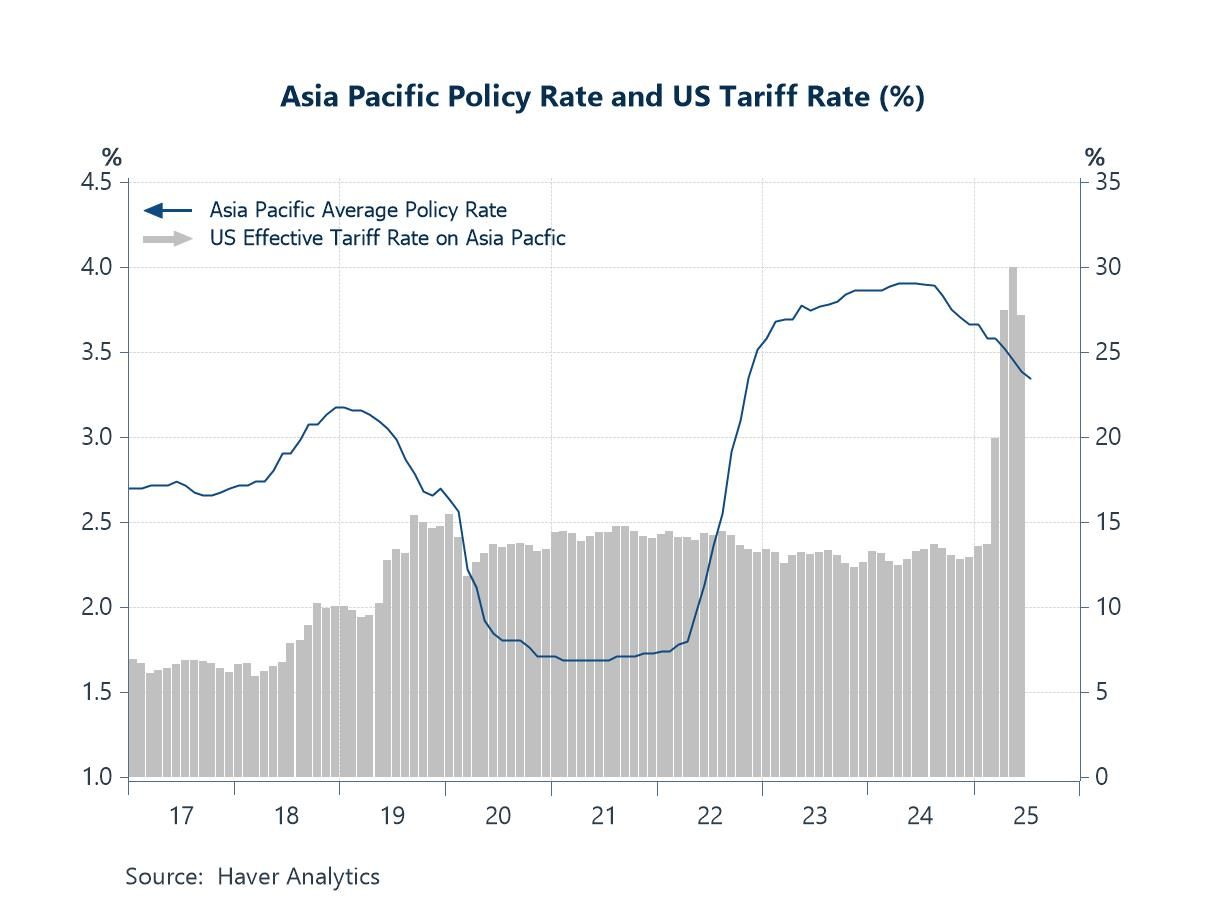
The combination of significant downside growth risks and cooling inflation has paved the way for further central bank easing across much of Asia. Indeed, most Asian central banks have implemented monetary easing via interest rate cuts this year, as shown in chart 4. This is likely a response to lingering downside risks from Trump’s post-pause reciprocal tariffs, which, while averting investors’ worst-case fears, still represent a notable increase from the prior 10% baseline pause rate. Most recently, Indonesia’s central bank surprised markets with a 25 bps rate cut last week and signalled the possibility of further easing to support growth in a low-inflation environment. While low growth amid subdued inflation makes easing a relatively straightforward choice, central banks remain mindful of other risks, including rising household debt (e.g., in South Korea), property prices, and the potential for excessive currency weakening due to rate cuts. Looking ahead, several central bank decisions are scheduled this week. In South Korea, a sharp rise in household debt during Q2 complicates the path for further easing, making a rate hold likely. By contrast, the Philippines appears set for additional cuts, with the central bank governor indicating that the first of two planned rate reductions this year could occur at the August meeting.
Chart 4: Asia Pacific policy rate and US effective tariff rate
Semiconductors and magnets Beyond broad, economy-specific US tariffs, attention is now turning potential US sectoral tariffs on semiconductors. President Trump has threatened that these could reach as high as 300%. If fully enacted with no concessions, such tariffs would undoubtedly ripple through the global semiconductor industry and across Asia, which accounts for most of the world’s semiconductor manufacturing and supplies the bulk of US imports, as shown in chart 5. For American consumers, a broad 300% semiconductor tariff would likely lead to higher prices for a wide range of electronics. It would also affect other products, such as cars, which increasingly rely on electronic components, reflecting the pervasive role of semiconductors in modern life. That said, there appears to be some room for concessions and exemptions. Companies with manufacturing capabilities or committed investment in the US—such as Apple and TSMC—are likely candidates for exemptions, although the specific criteria remain unclear.
Chart 5: US semiconductor imports
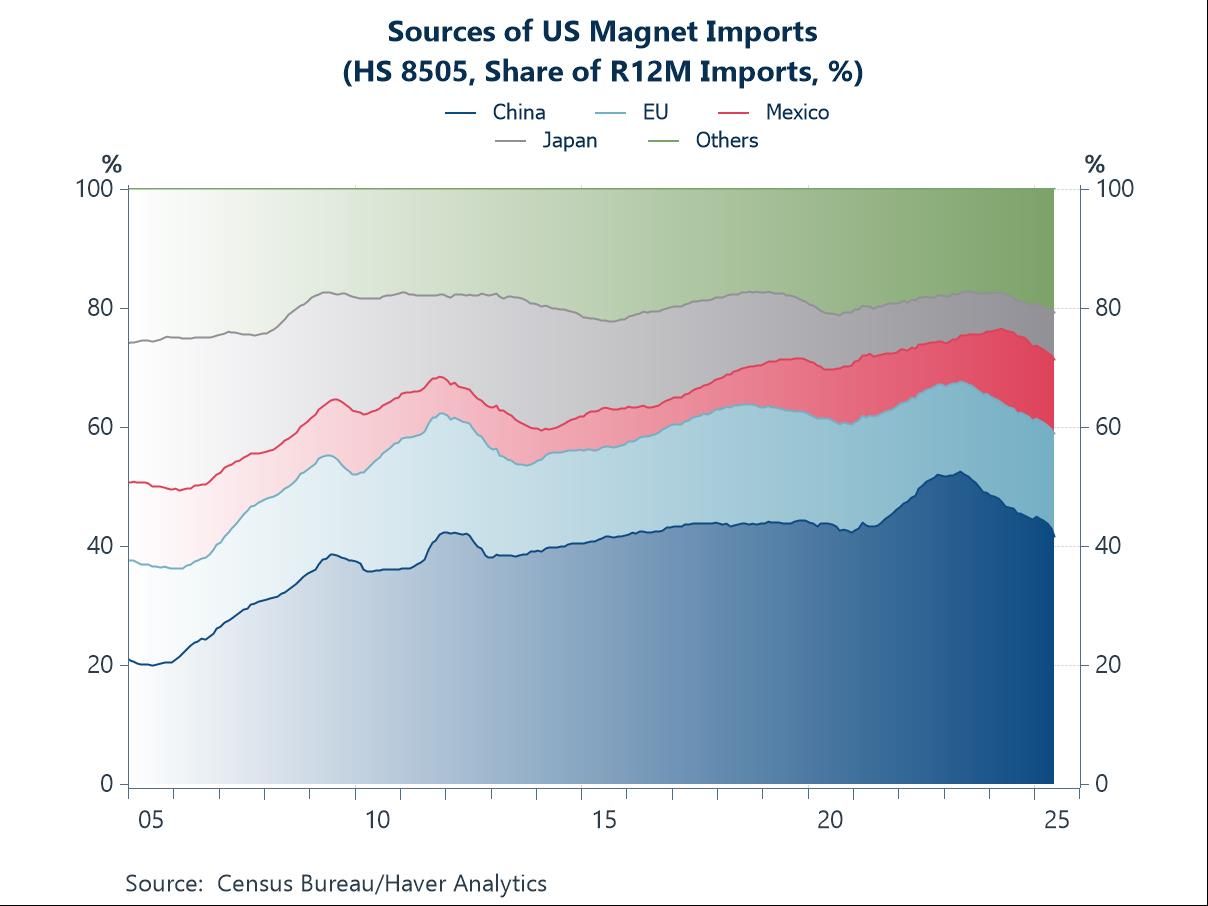
Lastly, a potential flashpoint for renewed US-China tensions is President Trump’s recent threat to impose a 200% tariff on China if it does not supply sufficient magnets. This underscores both the fragility of the US-China tariff truce and China’s dominant position in the rare earth market. China eased its rare earth export controls some time ago to resume supply flows, which may have helped prevent a re-escalation of tensions at the time. Since then, Chinese rare earth exports to the US reportedly reached a six-month high in July. As shown in chart 6, China is the main supplier of magnets to the US, which are critical for EV production and other high-end industries. Many alternative suppliers also rely on Chinese raw materials, highlighting China’s pivotal role in the supply chain.
Chart 6: Sources of US magnet imports

Tian Yong Woon
AuthorMore in Author Profile »Tian Yong joined Haver Analytics as an Economist in 2023. Previously, Tian Yong worked as an Economist with Deutsche Bank, covering Emerging Asian economies while also writing on thematic issues within the broader Asia region. Prior to his work with Deutsche Bank, he worked as an Economic Analyst with the International Monetary Fund, where he contributed to Article IV consultations with Singapore and Malaysia, and to the regular surveillance of financial stability issues in the Asia Pacific region.
Tian Yong holds a Master of Science in Quantitative Finance from the Singapore Management University, a Master of Science in Analytics from the Georgia Institute of Technology, a Bachelor of Science in Mathematics from the Singapore University of Social Sciences, and a Bachelor of Science in Banking and Finance from the University of London.
More Economy in Brief


