 Global| Aug 21 2025
Charts of the Week: Cracks Beneath The Shine
by:Andrew Cates
|in:Economy in Brief
Summary
Recent financial market gains have been underpinned by resilient global data, AI-fuelled optimism, and hopes that most central banks will continue to loosen monetary policy. Yet beneath the surface, a more complicated picture may be emerging. In the US, housing indicators are flashing warnings about household balance sheets and credit channels (chart 1), while China’s latest data—covering retail sales, industrial output, and property—underscore persistent weakness (chart 2). In the UK, this week’s data showing sticky services inflation is complicating the Bank of England’s easing path (chat 3), while back in the US, medium-term inflation expectations have been rising despite softer oil prices (chart 4), hinting at a more disruptive role for trade policy. Against this cyclical backdrop sit deeper structural challenges: global energy consumption remains overwhelmingly dependent on fossil fuels, the clean energy sector has lost momentum amid high costs and policy uncertainty, and equity markets have punished renewables even as climate imperatives intensify (charts 5 and 6). Together, these dynamics suggest that while markets continue to trade on optimism, the mix of weak housing signals, patchy Chinese demand, sticky inflation, and an uneven energy transition potentially leaves the global outlook more fragile than headline performance implies.
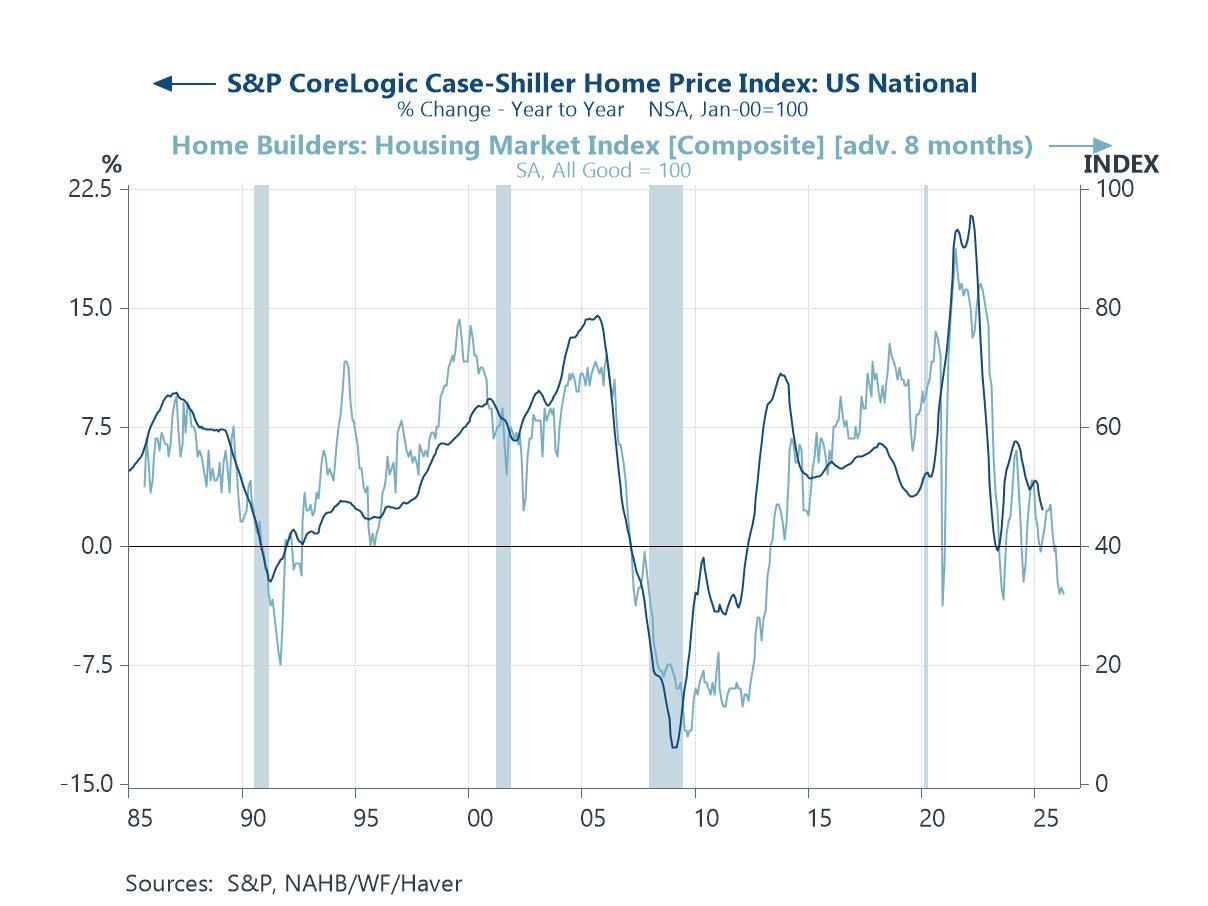
The US housing market This first chart below highlights the growing downside risks to the US economic outlook stemming from the housing market. The S&P Case-Shiller home price index has slowed sharply from the pandemic-era surge, while the NAHB (National Association of Homebuilders) housing market index has weakened to levels historically associated with falling home prices. Housing matters because it is not just a cyclical sector but also a key transmission channel for the broader economy: consumer confidence, household balance sheets and credit conditions are all heavily influenced by shifts in the housing market.
Chart 1: US homebuilders’ sentiment versus house prices
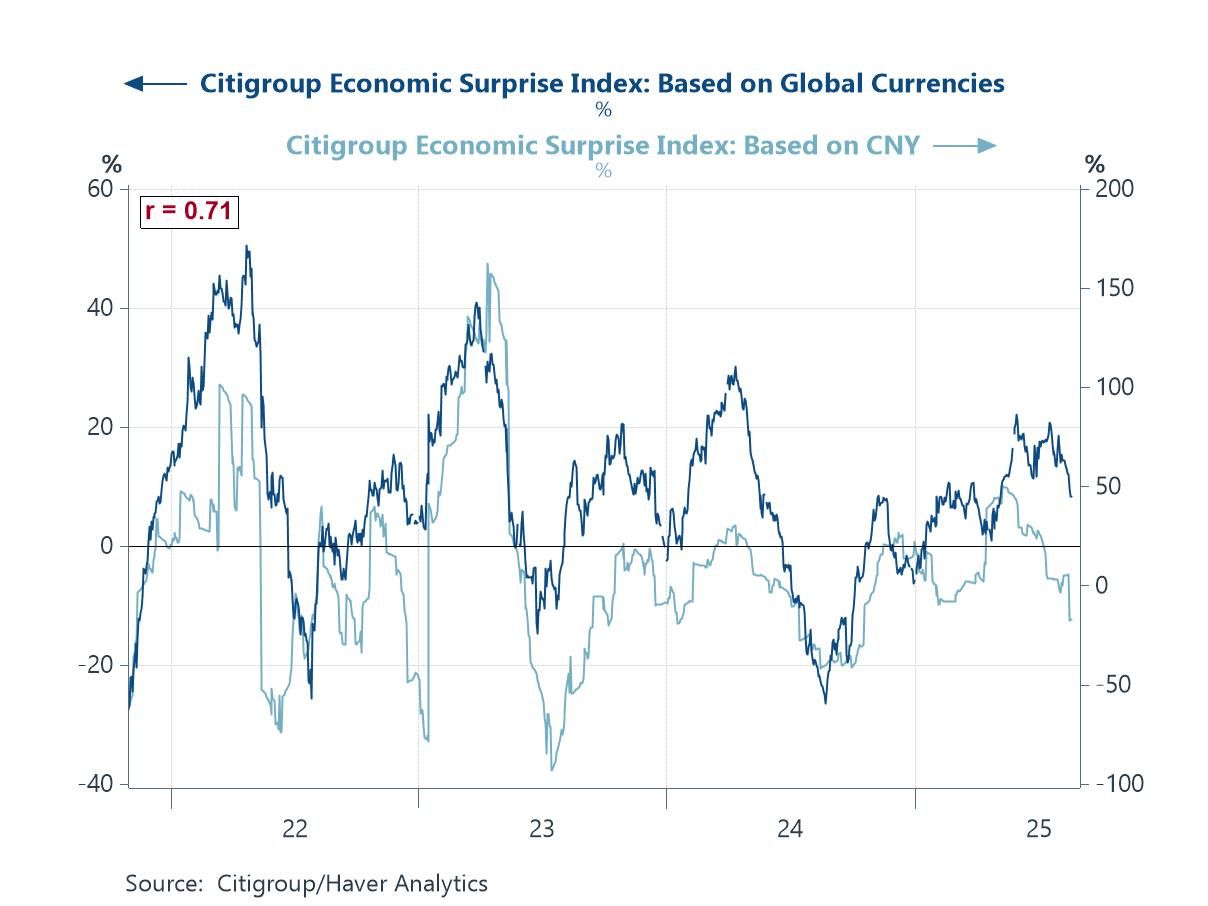
China’s economy The latest run of data from China has also reinforced downside risks for the broader world economy. As the Citigroup Economic Surprise Indices show below, China-specific data have more consistently undershot expectations in recent days. China’s July releases in particular disappointed: retail sales growth slowed to just 3.7% y/y, with weakness in autos and furniture hinting that earlier policy-driven boosts are fading. Industrial output and fixed-asset investment also came in below consensus, while property prices continued to fall and retail sector investment contracted by double digits. Even the labour market showed strain, with unemployment edging higher. The worry is not just China’s slowdown in isolation, but the spillovers. Softer Chinese demand feeds directly into global supply chains, commodity markets, and regional trade partners. Combined with tariff and non-tariff headwinds from the US, the risk is that China’s structural challenges spill into weaker global growth momentum.
Chart 2: Citigroup global growth surprise index versus China growth surprise index
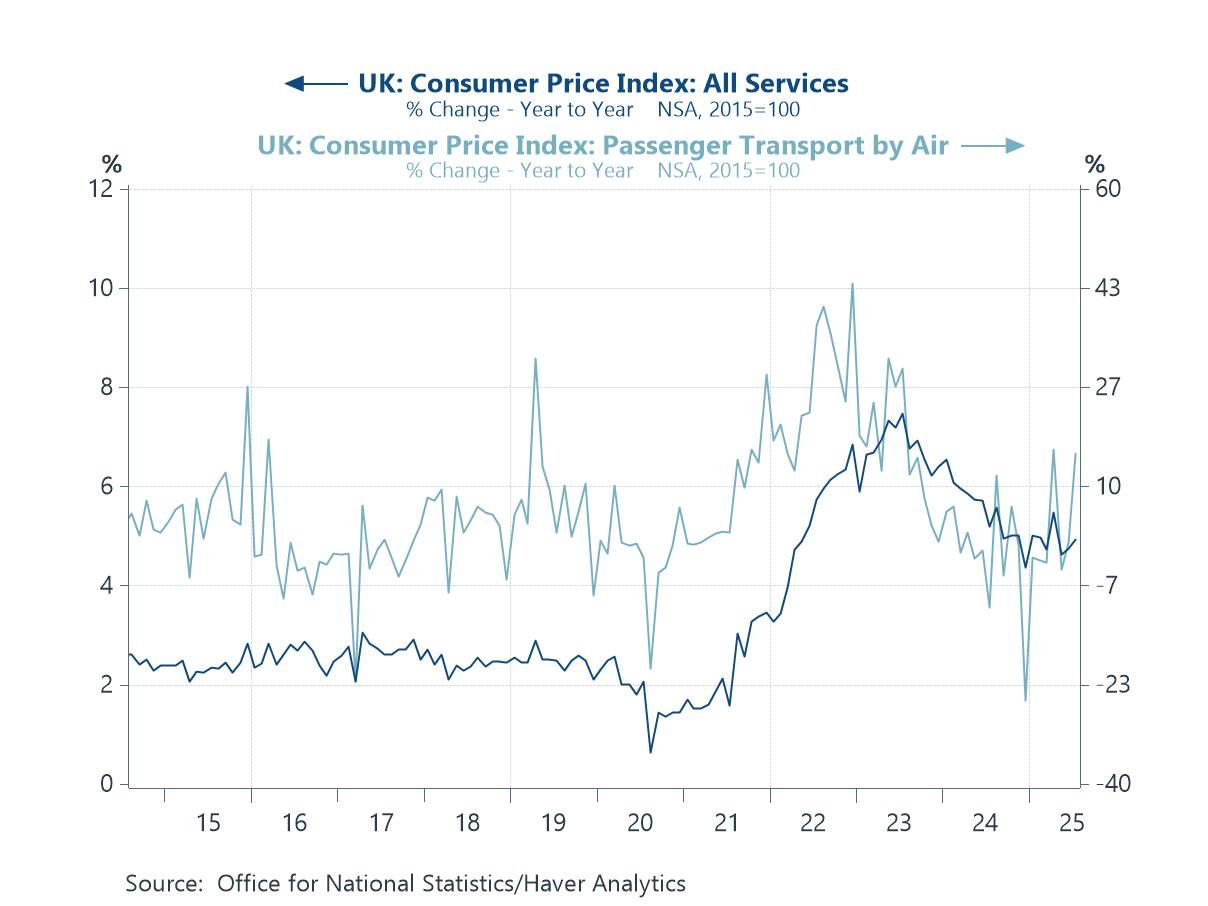
UK inflation Persistently high services inflation remains one of the biggest headaches for UK monetary policy - and the UK is far from unique in that regard. Services are wage- and demand-sensitive, and their stickiness complicates the calibration of monetary policy even as broader disinflation takes hold. This week’s July upside surprise to UK services inflation was driven in no small part by airfares, which spiked 30% month-on-month – the largest July rise on record. While such volatility may prove temporary, it nonetheless lifted year-on-year services inflation to 5.0%, well above comfort levels. Still, the offsets are important: stripping out airfares and other volatile components, underlying services momentum appears to have eased, while broader data on wages, employment, and activity point to cooling demand. Nevertheless, this tension – headline stickiness versus softer underlying trends – underscores why the Bank of England is treading carefully.
Chart 3: UK CPI inflation: Services and airfares
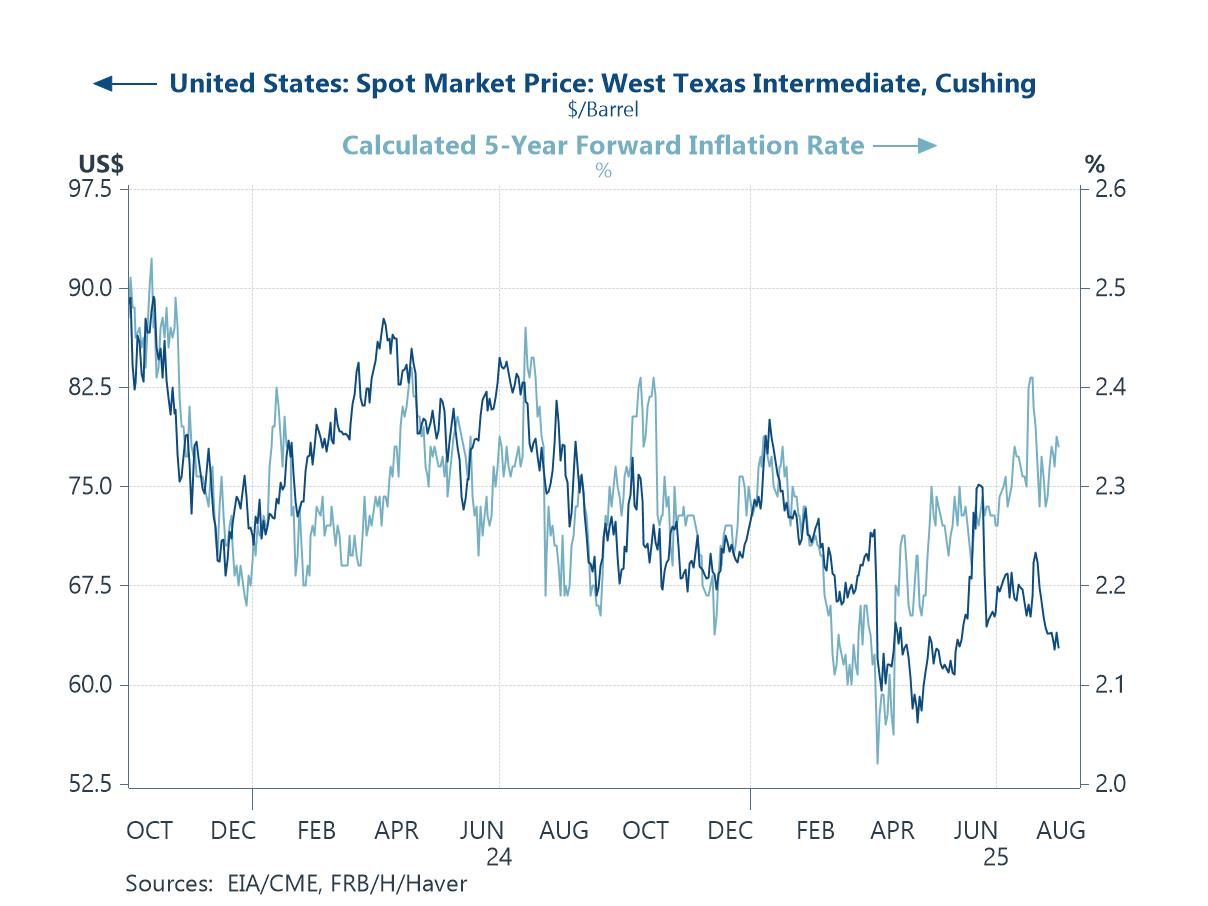
Inflation expectations and energy US medium-term inflation expectations have been unusually decoupling from oil prices in recent weeks. Normally, falling oil prices would help anchor breakevens, yet the 5-year forward inflation rate has edged higher of late even as WTI has slipped. This probably reflects US tariff policies that are shifting inflation dynamics away from energy and toward trade-related costs. At the same time, a weaker dollar has lifted imported prices, and the upward creep in expectations suggests markets may be more actively questioning whether the Fed’s “higher for longer” stance is sufficient to contain medium-term inflation risks.
Chart 4: The oil price versus US 5-year ahead inflation expectations
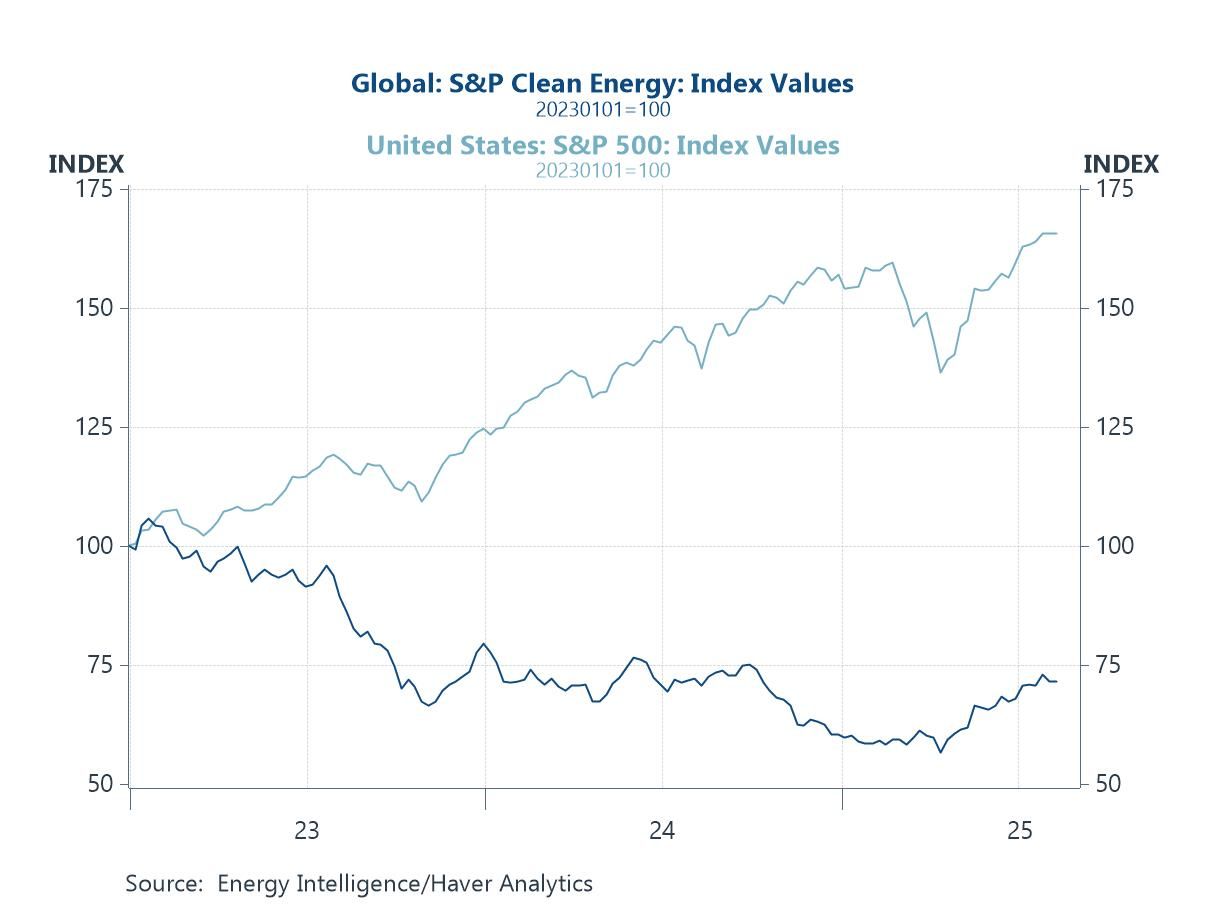
Clean energy Pivoting to more structural issues, the stark divergence between the global clean energy equity market index and the broader S&P 500 underlines the mounting challenges facing the renewables sector at present. While US equities have pushed to record highs, clean energy stocks have languished, weighed down by policy uncertainty, higher financing costs, and a more sceptical public mood. In the US, shifting political winds and uneven implementation of green subsidies have clouded the outlook for investment, while globally, resistance to renewables has grown as consumers and businesses grapple with high energy bills. Rising interest rates have further undermined the economics of capital-intensive clean energy projects, eroding returns and delaying investment pipelines. At the same time, bottlenecks in transmission infrastructure, permitting delays, and questions over the pace of the net-zero transition have all dented confidence. The result is a sector underperforming dramatically even as the urgency of the climate challenge grows.
Chart 5: Clean energy stock price performance versus US S&P 500 index
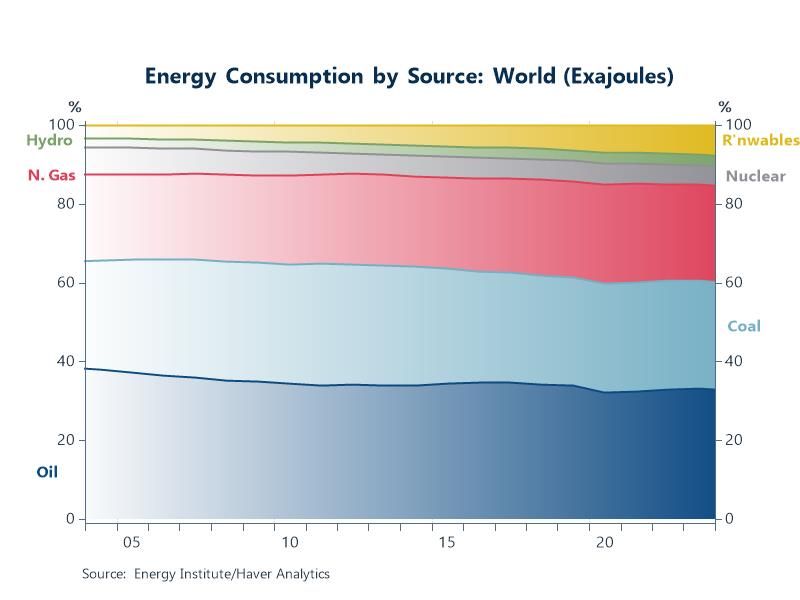
Renewables versus non-renewables Global energy consumption data show how limited—and in some respects, stalled—the transition away from fossil fuels has become. Oil, gas, and coal still dominate the energy mix, with shares that have proven remarkably resilient over the past several years. In fact, coal use has ticked higher of late as countries turned back to cheaper, more secure supplies amid energy price spikes and supply disruptions. While renewables have grown rapidly in percentage terms, their absolute contribution remains small compared with the scale of fossil fuel demand. Nuclear and hydro have also struggled to gain ground, leaving the overall mix looking more like a story of continuity than transformation. The result is a global transition that has not just slowed but, in key areas, has partially reversed—highlighting the gulf between climate ambitions and energy realities.
Chart 6: Global energy consumption by source

Andrew Cates
AuthorMore in Author Profile »Andy Cates joined Haver Analytics as a Senior Economist in 2020. Andy has more than 25 years of experience forecasting the global economic outlook and in assessing the implications for policy settings and financial markets. He has held various senior positions in London in a number of Investment Banks including as Head of Developed Markets Economics at Nomura and as Chief Eurozone Economist at RBS. These followed a spell of 21 years as Senior International Economist at UBS, 5 of which were spent in Singapore. Prior to his time in financial services Andy was a UK economist at HM Treasury in London holding positions in the domestic forecasting and macroeconomic modelling units. He has a BA in Economics from the University of York and an MSc in Economics and Econometrics from the University of Southampton.
More Economy in Brief


