U.S. New Home Sales & Prices Ease in July
by:Tom Moeller
|in:Economy in Brief
Summary
- Small decline in sales follows sharp increase.
- Sales are mixed throughout the country.
- Median sales price declines for second straight month.
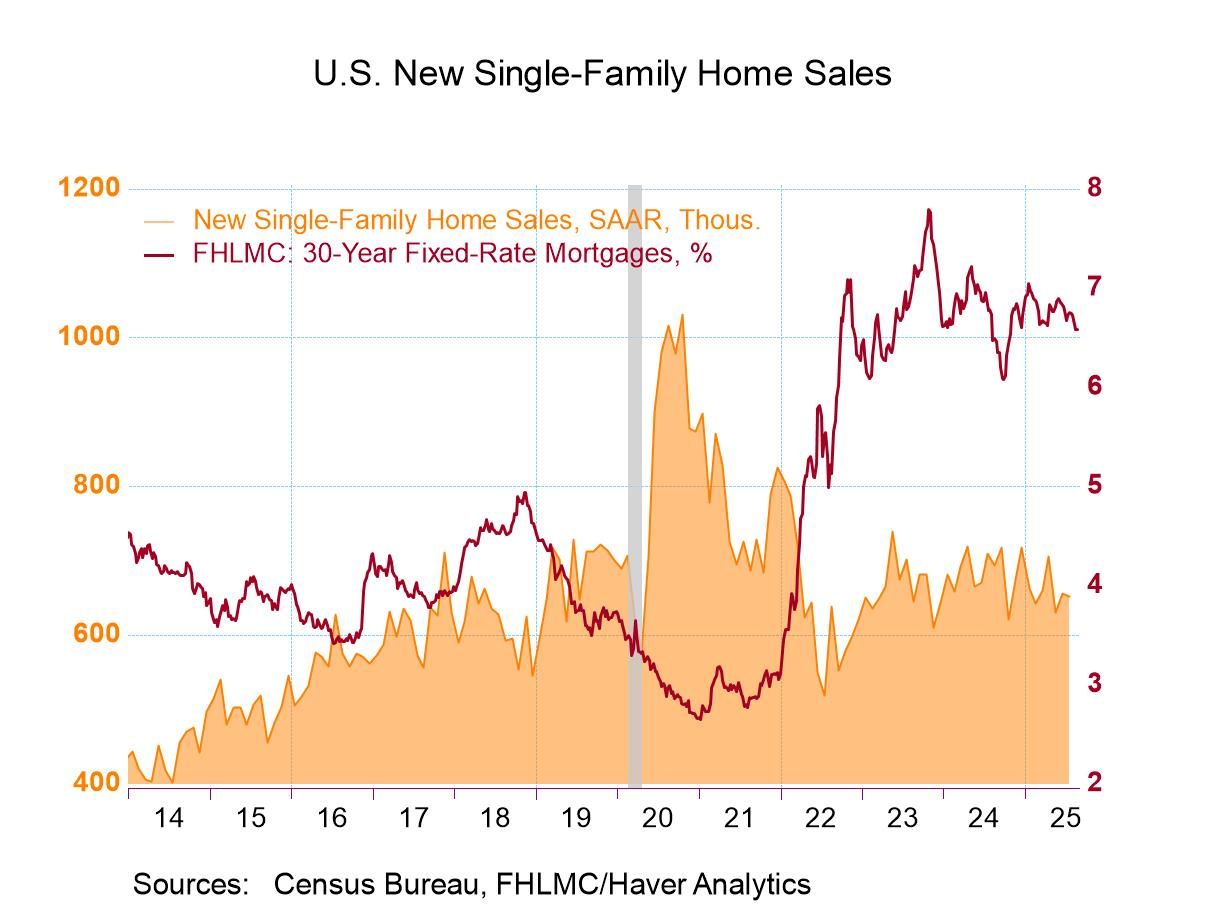
Sales of new single-family home sales fell 0.6% (-8.2% y/y) to 652,000 (SAAR) during July after increasing 4.1% in June to 656,000, revised from 627,000, and falling 10.8% in May to 630,000, revised from 623,000 according to the U.S. Census Bureau. The Action Economics Forecast Survey expected sales of 635,000 in July. The sales gain occurred as the average 30-year fixed-rate mortgage eased m/m to an average 6.72% in July from 6.82% in June, according to Freddie Mac.
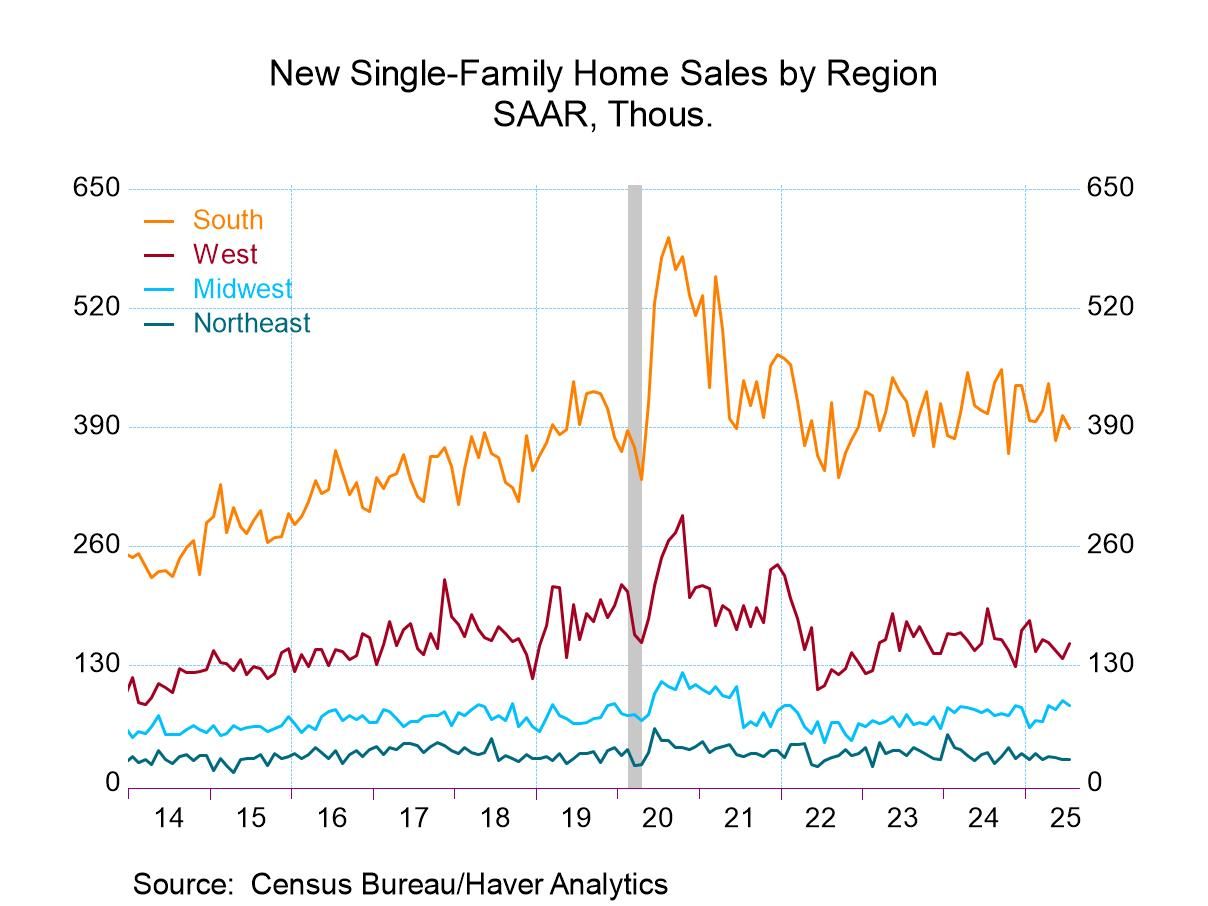
By region, new home sales varied across the country last month. Sales of new homes in the Midwest fell 6.6% (+4.9% y/y) to 85,000, after rising 12.3% during June. In the South, new home sales weakened 3.5% (-4.0% y/y) to 388,000, following a 7.2% Increase in June. Offsetting these declines, sales of new homes in the West rose 11.7% (-19.9% y/y) in July to 153,000, after three straight months of decline. Showing less weakness, new home sales in the Northeast held steady last month (-23.5% y/y) at 26,000, after declining 10.3% in June.
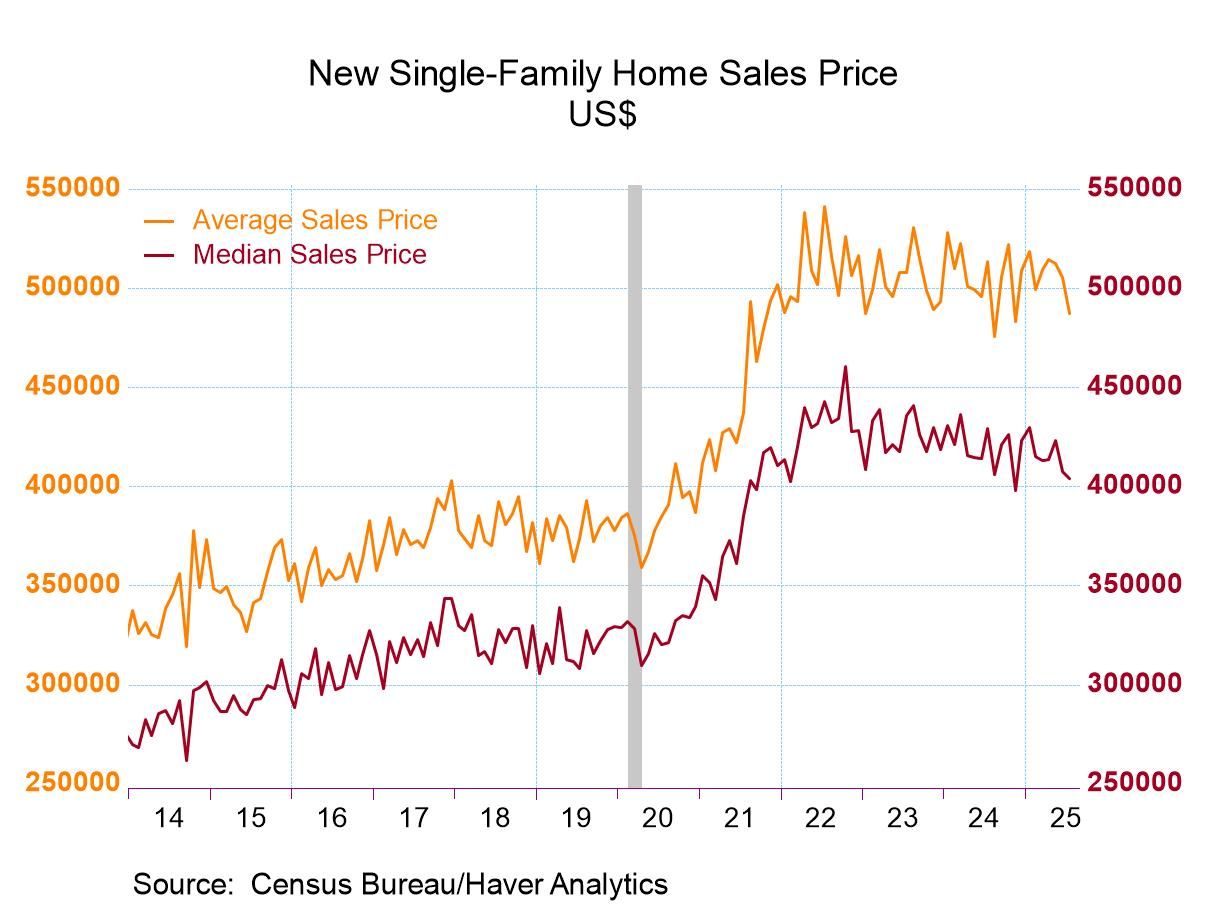
The median sales price of a new home declined 0.8% (-5.9% y/y) to $403,800 (NSA) in July after falling 3.8% to $407,200 in June. New home prices were 12.3% below the all-time peak of $460,300 in October 2022. The average sales price of a new home fell 3.6% (-5.0% y/y) to $487,300 in July, off for the third straight month. The average price was 10.0% below a high of $541,200 in July 2022. These sales price data are not seasonally adjusted.
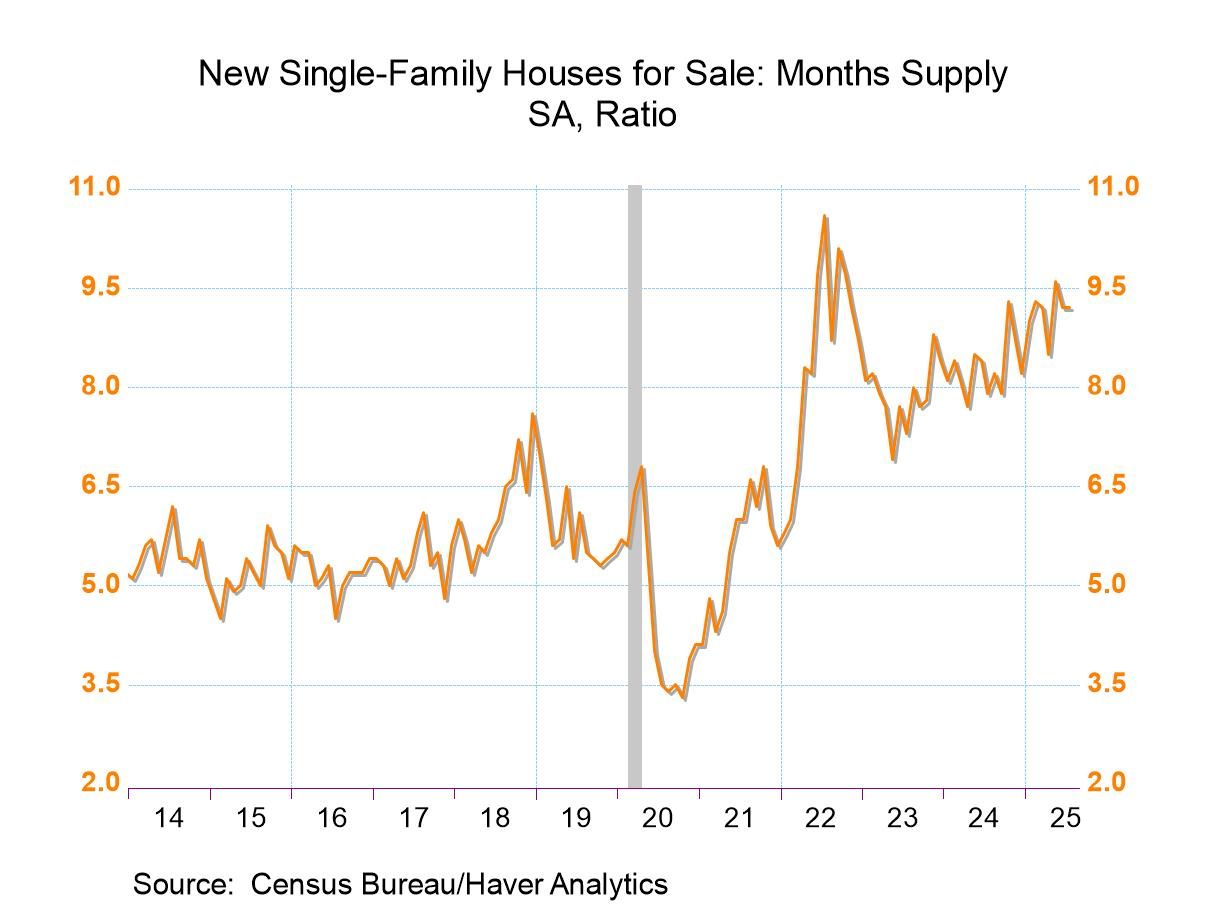
The number of unsold new homes on the market fell 0.6% (+7.3% y/y) to 499,000 (SA) in July, after easing 0.2% in June. The seasonally adjusted months' supply of new homes for sale held steady at 9.2 months in July, after falling from 9.6 months in May. The latest reading remained above a low of 6.9 months in May 2023.
The median number of months a new home stayed on the market increased to 2.9 months in July, remaining above a June 2024 low of 2.1 months. The latest number stood well above its record low of 1.5 months in both September and October of 2022, but remained below a high of 5.1 months in March 2021. These figures date back to January 1975.
New home sales are recorded when the sales contract is signed. New home sales activity and prices are available in Haver's USECON database. The consensus expectation figure from Action Economics is available in the AS1REPNA database.

Tom Moeller
AuthorMore in Author Profile »Prior to joining Haver Analytics in 2000, Mr. Moeller worked as the Economist at Chancellor Capital Management from 1985 to 1999. There, he developed comprehensive economic forecasts and interpreted economic data for equity and fixed income portfolio managers. Also at Chancellor, Mr. Moeller worked as an equity analyst and was responsible for researching and rating companies in the economically sensitive automobile and housing industries for investment in Chancellor’s equity portfolio. Prior to joining Chancellor, Mr. Moeller was an Economist at Citibank from 1979 to 1984. He also analyzed pricing behavior in the metals industry for the Council on Wage and Price Stability in Washington, D.C. In 1999, Mr. Moeller received the award for most accurate forecast from the Forecasters' Club of New York. From 1990 to 1992 he was President of the New York Association for Business Economists. Mr. Moeller earned an M.B.A. in Finance from Fordham University, where he graduated in 1987. He holds a Bachelor of Arts in Economics from George Washington University.
More Economy in Brief


 Global