Haver Analytics
Haver Analytics

Economy in Brief

Jump to:
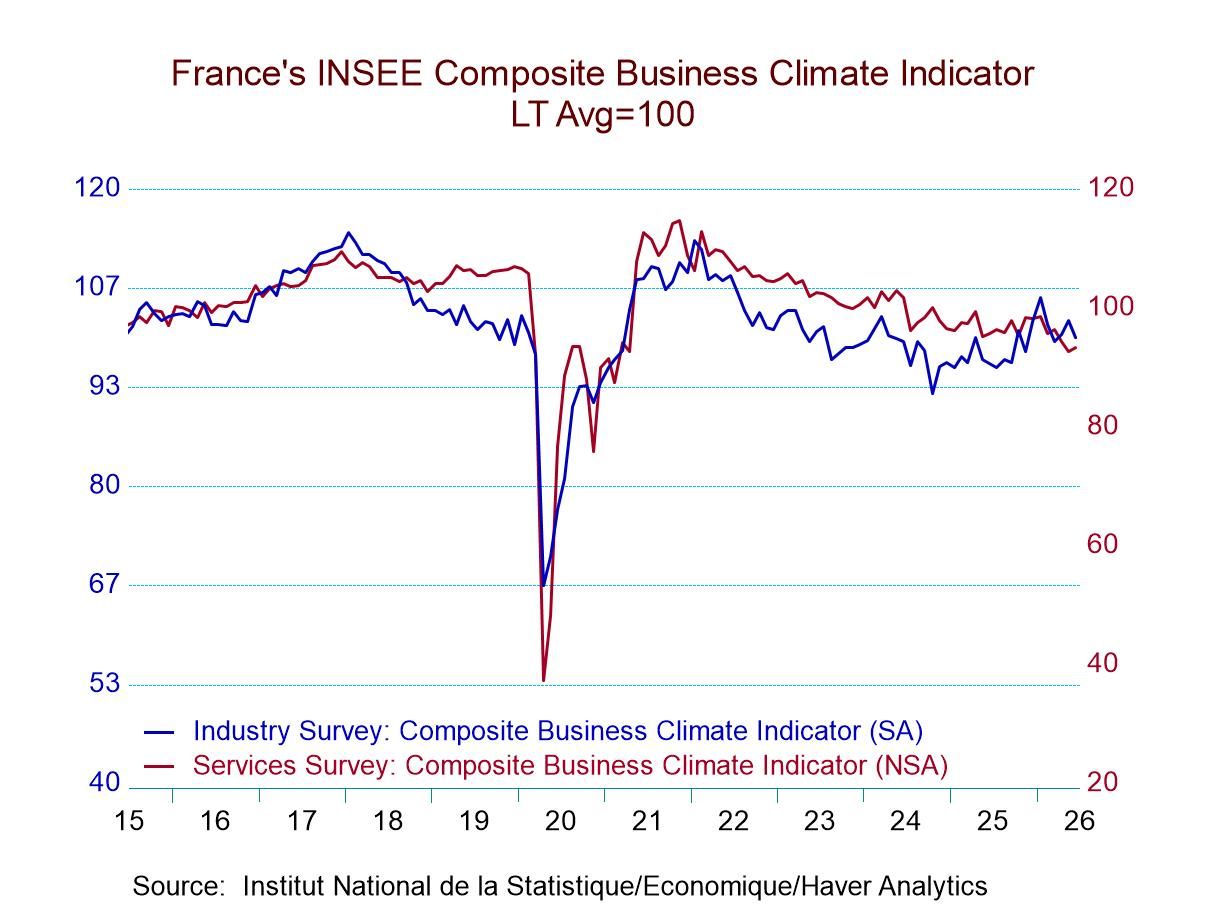
  • In June, there's a slight divergence in the performance of industry climate and service sector climate, although broadly the two sectors have seen their composite indexes moving in more or less the same direction. Since 2024, the industry survey has moved up slightly after falling faster than the services gauge. The services survey has been locked in a slow trend of deterioration, largely since it reached a peak in 2021 in the wake of COVID.

    The industry climate gauge has a 30.8 percentile standing, but the recent production trend, while declining, logs a more substantial 42.8 percentile standing. Contributing survey members find their own industry ‘likely trend’ much weaker, at a 21.2 percentile standing. Demand overall, however, has standings above the 50th percentile, putting overall and foreign orders & demand each above their respective medians for this period of ranking back to 2001. Inventories have a strong 81-percentile ranking. Prices are extremely strong, with 87-percentile and 86-percentile standings for respondents for their personal industry trend for prices as well as for the overarching manufacturing sector estimate of prices. Higher prices seem to be the one thing that everyone can agree on by a large margin.

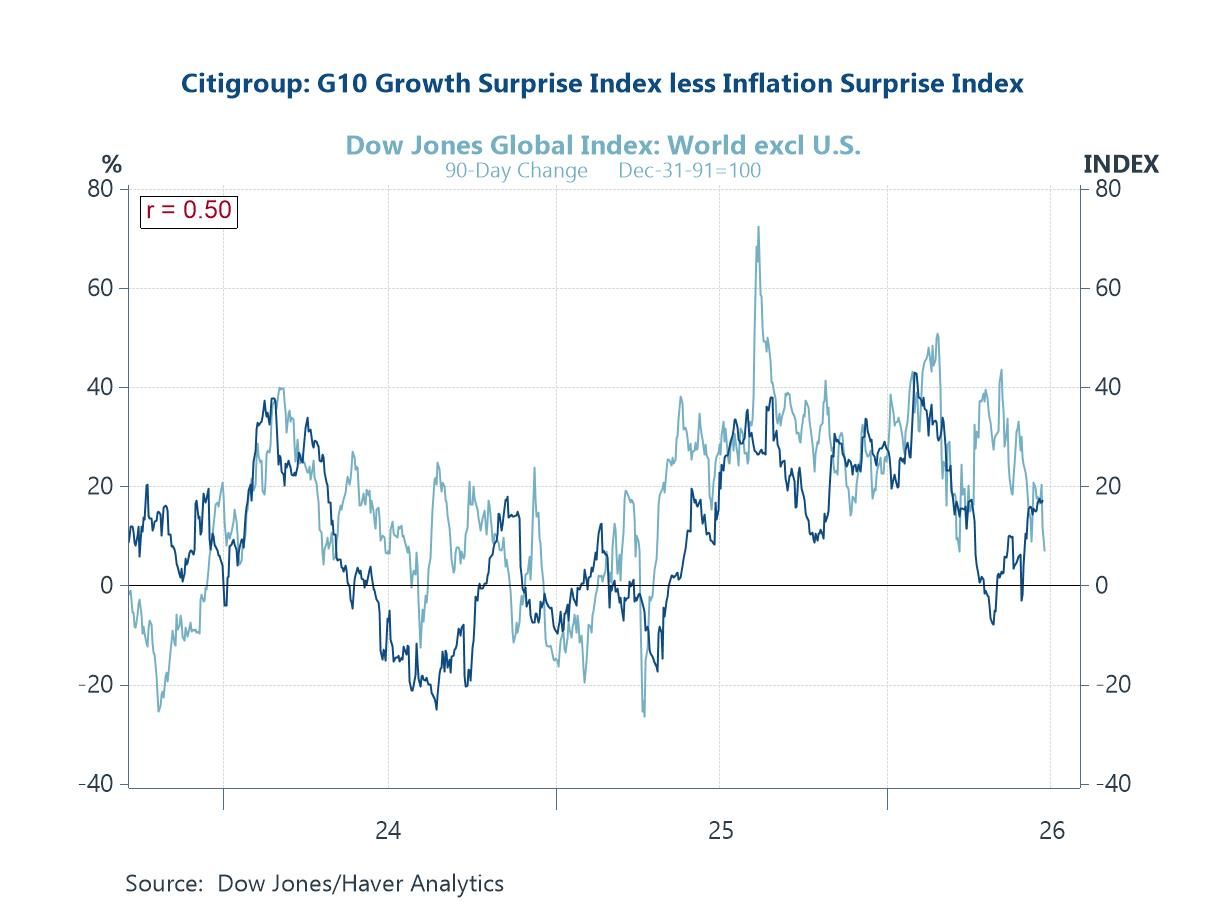
  • The mood in global financial markets this week is more settled, though “settled” should not be confused with resolved. The US-Iran memorandum of understanding, signed last week, has continued to do its work: oil prices have fallen further, Strait of Hormuz shipping traffic has picked up measurably, and the risk premium that had been embedded in energy markets since the conflict escalated in March is now visibly unwinding. That is a material development for the inflation outlook, and central bankers will be watching carefully. Yet the picture is not without its complications. Technology stocks — the most conspicuous beneficiary of the prevailing low-rate, high-growth narrative — have been subject to renewed jitters this week, as investors grow more attentive to stretched valuations and the implications of a Federal Reserve that, under new chair Kevin Warsh, is no longer signalling the easing cycle previously priced into markets. Against this backdrop, this week’s charts draw on the latest data to assess where the global economic cycle stands. Equity momentum outside the United States has tracked closely with global growth and inflation surprises, a correlation that tells us something important about how activity is being perceived (chart 1). Meanwhile, the breakdown of the previously tight relationship between oil prices and US two-year yields is arguably one of the more telling market signals of recent weeks (chart 2). June’s flash PMI surveys point to easing supply chain stress and softer output price inflation in manufacturing — a finding that chimes naturally with lower crude prices and the resumption of Hormuz flows (chart 3). The Strait of Hormuz itself deserves a closer look: traffic data and the mechanics of the oil price pullback are telling a coherent story that supports the PMI picture (chart 4). South Korea’s trade data, including semiconductors, offer a slightly softer read on global demand momentum at the margin (chart 5). And looming on the horizon, one new risk is drawing the attention of meteorological authorities: a Super El Niño event whose probability has been rising, with potentially significant implications for food commodity prices and Asian agriculture (chart 6).

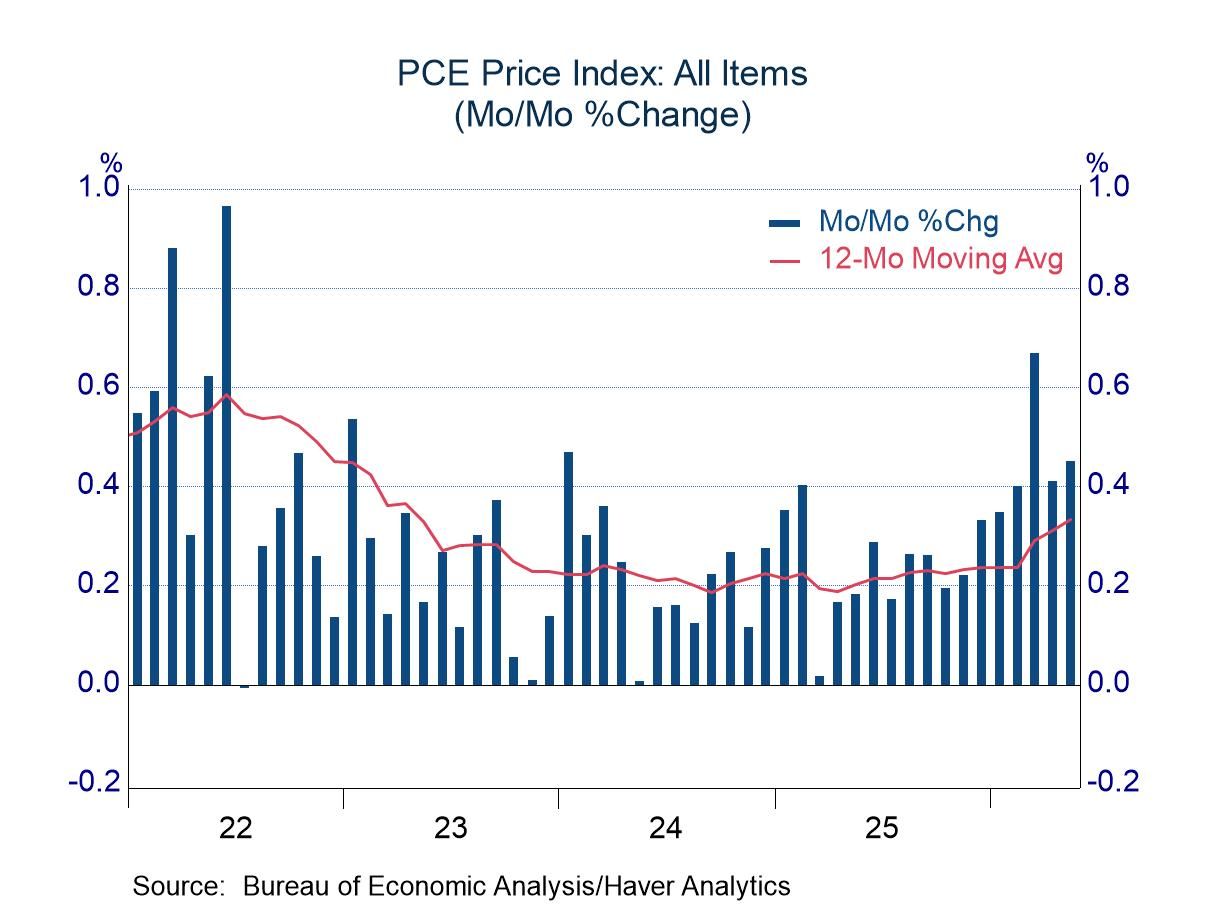
    • Energy prices rose sharply for the third consecutive month; core prices were unsettling as well.
    • A jump in nominal income translated to a modest advance in real terms, allowing consumers to remain reasonably active.
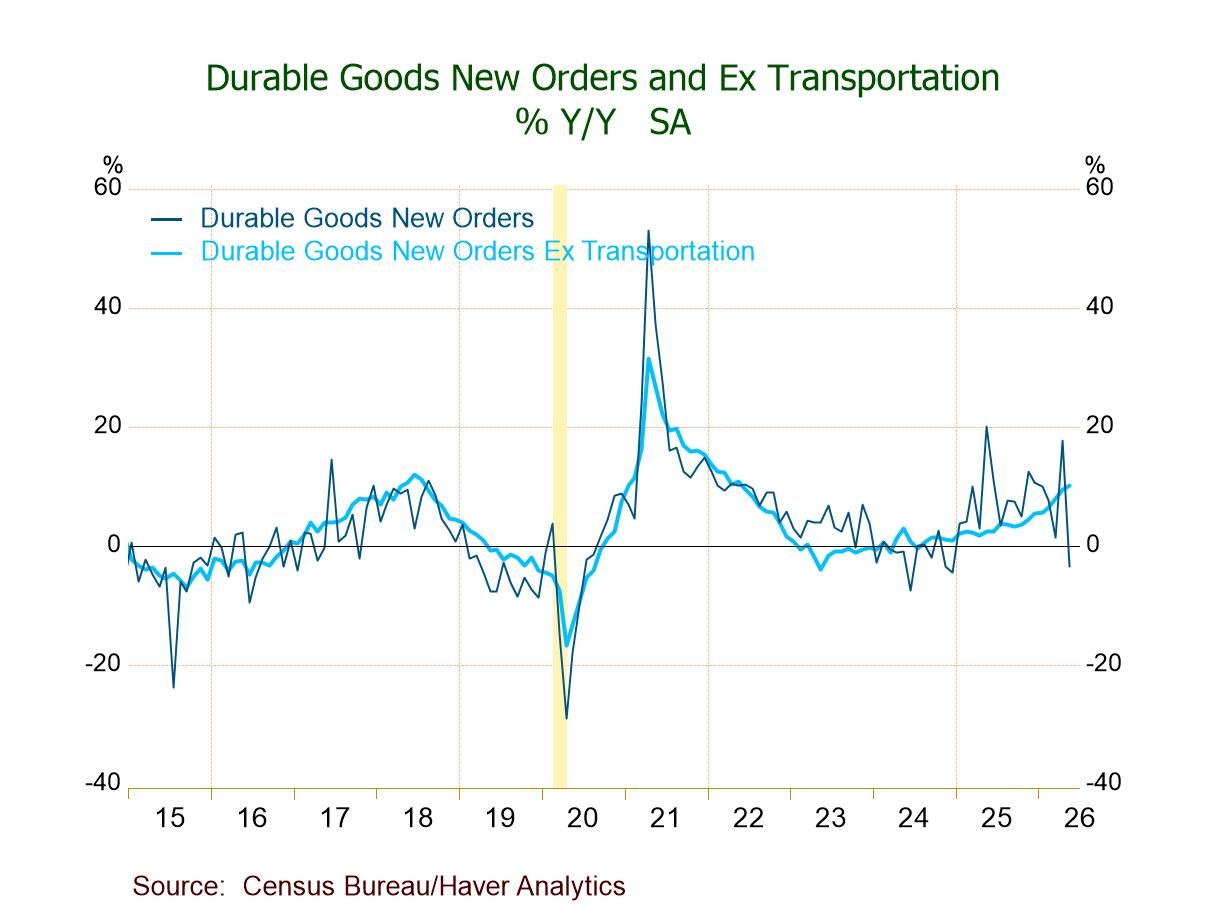
    • May headline orders -4.5% m/m, first fall in three mths.; -3.5% y/y, first negative reading since Dec. ’24.
    • Nondefense aircraft & parts -51.8% m/m vs. April’s +167.4%.
    • Transportation orders -14.0%, first m/m drop since Feb.; orders ex transp. +1.3%, 13th straight m/m rise.
    • Core capital goods shipments +0.3%, eighth gain in nine mths., pointing to a moderate contribution to Q2’26 GDP from business equipt. spending.
    • Durable goods shipments +1.0%; unfilled orders +0.6%; inventories +0.2%.
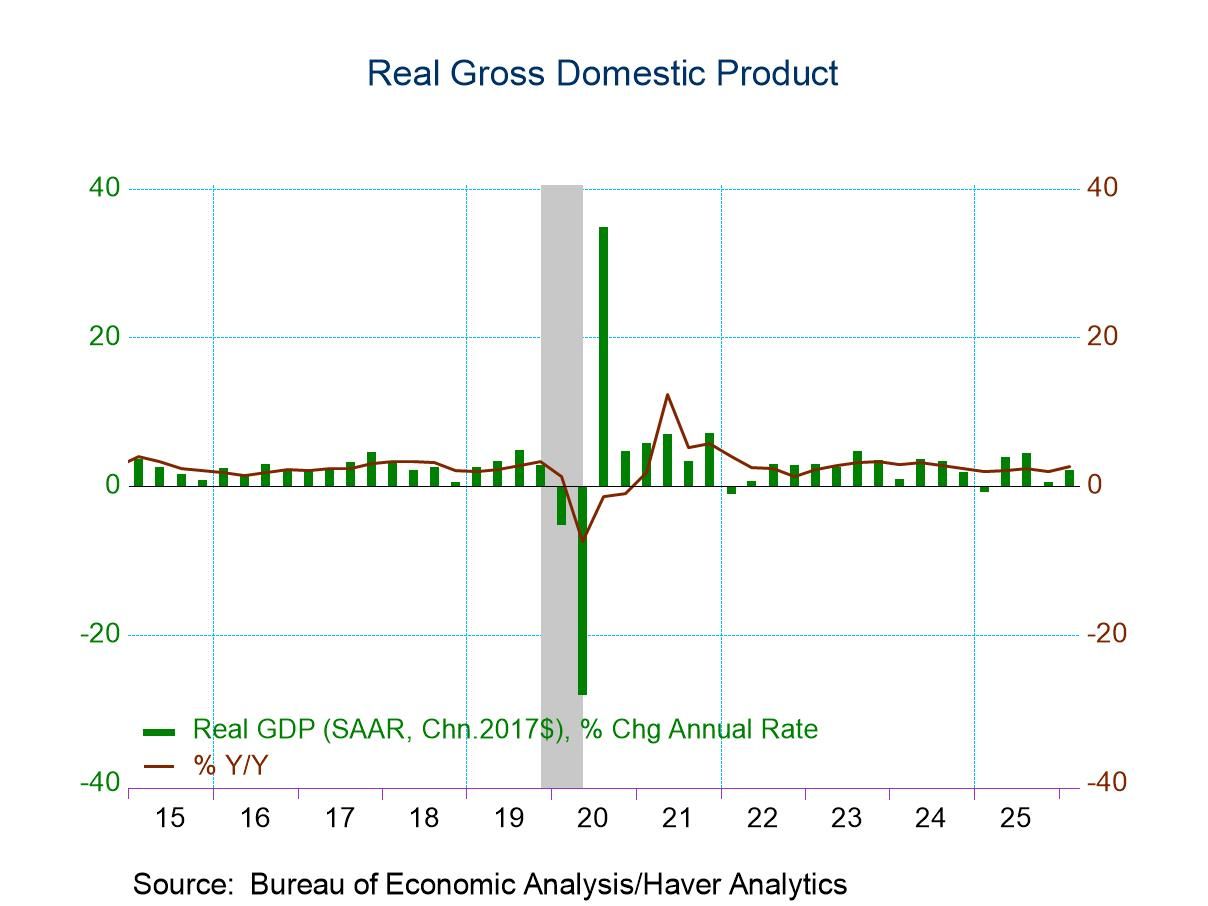
    • Q1 GDP growth was unexpectedly revised up to 2.1% q/q saar in the third estimate, up from 1.6% in the second estimate and inching past the 2.0% advance estimate.
    • A meaningful downward revision to imports was the primary factor behind the upward revision, leading to a much smaller subtraction from net exports.
    • Personal consumption expenditures growth was revised down to 0.5% q/q saar, the slowest pace since Q1 2022, due mostly to a downward revision to household spending on financial services and insurance.
    • With the downward revision to import demand and PCE, domestic demand growth was revised down meaningfully to 1.7% q/q from 2.4%.
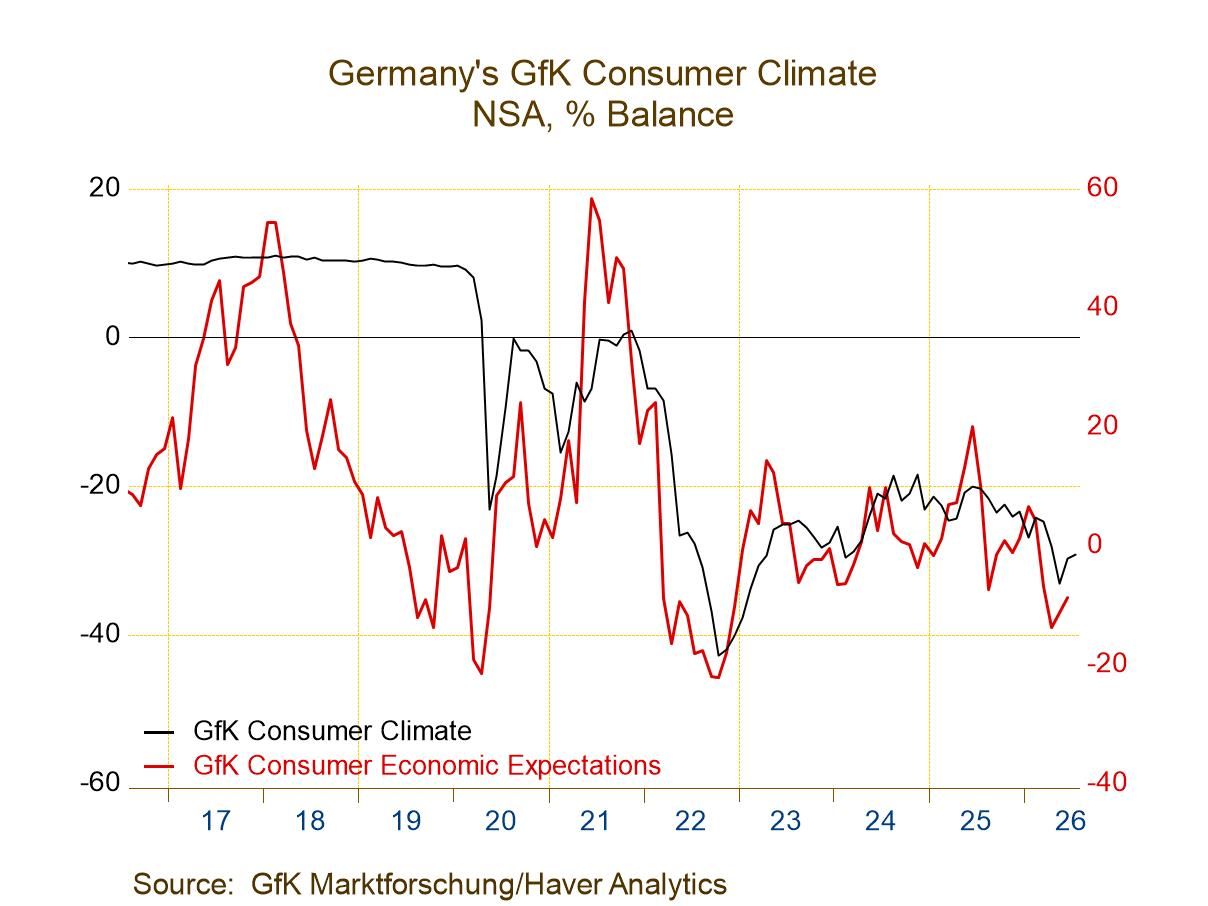
  • German consumer climate, as measured by the GfK survey for the month ahead of July, posted a reading of -29.2, a slight improvement from -29.7 in June. This is the second consecutive monthly improvement, slight though it may be, in the reading for climate. The ranking of this reading on data back to 2002 finds that it has been weaker only about 4% of the time on this timeline. The reading for climate remains extremely weak in Germany, despite the slight up-creep over the past couple of months.

    The components for the climate index are up to date only through June. On that basis, there was a small increase in economic expectations, a small increase in income expectations, and a smaller decline in the rating for the propensity to buy, a consumer spending metric. The reading for economic expectations in June has a 22.4 percentile standing, the reading for income has a 14.6 percentile standing, and the reading for the propensity to buy has a 23.8 percentile standing. All three of these metrics have readings that are in the lower quartile of their range of readings back to 2002. The headline reading is substantially weaker in its ranking than the three components; however, these are for different timelines—the headline is for July, while the components are for June. The weaker climate standing may simply reflect the confluence of the weak readings for these three components, marking that as a more unusual event than the stand-alone rankings of each one by itself. In any event, there is little in the German survey to give much confidence that conditions in Germany are significantly improving, let alone getting better.

    The table also includes consumer confidence readings for other EU members, specifically Italy and France, as well as for the nonaligned United Kingdom. Italy's reading is up to date as of May, while the French and U.K. readings are up to date as of June. The recent Italian reading ticked up slightly, from 90.8 in April to 93.4 in May. The May reading for Italy has a 60.3 percentile standing, much better than the readings for the German headline, France, or the U.K. The French reading, at 84, is improved from 82.4 in June but still has only a 6.8 percentile standing, an extremely weak standing comparable to the headline standing for German climate. The U.K. reading is stuck at -23 for two months in a row, which produces a 26.9 percentile standing, another weak reading and a near 25-percentile low reading for the U.K.

    These various readings span months ending in May, June, or July; the signals they emit are consistent that consumer confidence is quite weak in Europe—extremely weak in Germany and France, quite weak in the U.K., and only Italy produces a number where the ranking is above its 50th percentile, putting it above its historic mean of readings over data back to the year 2002. Italian consumer confidence readings have tended to be more resilient than those of other countries recently.


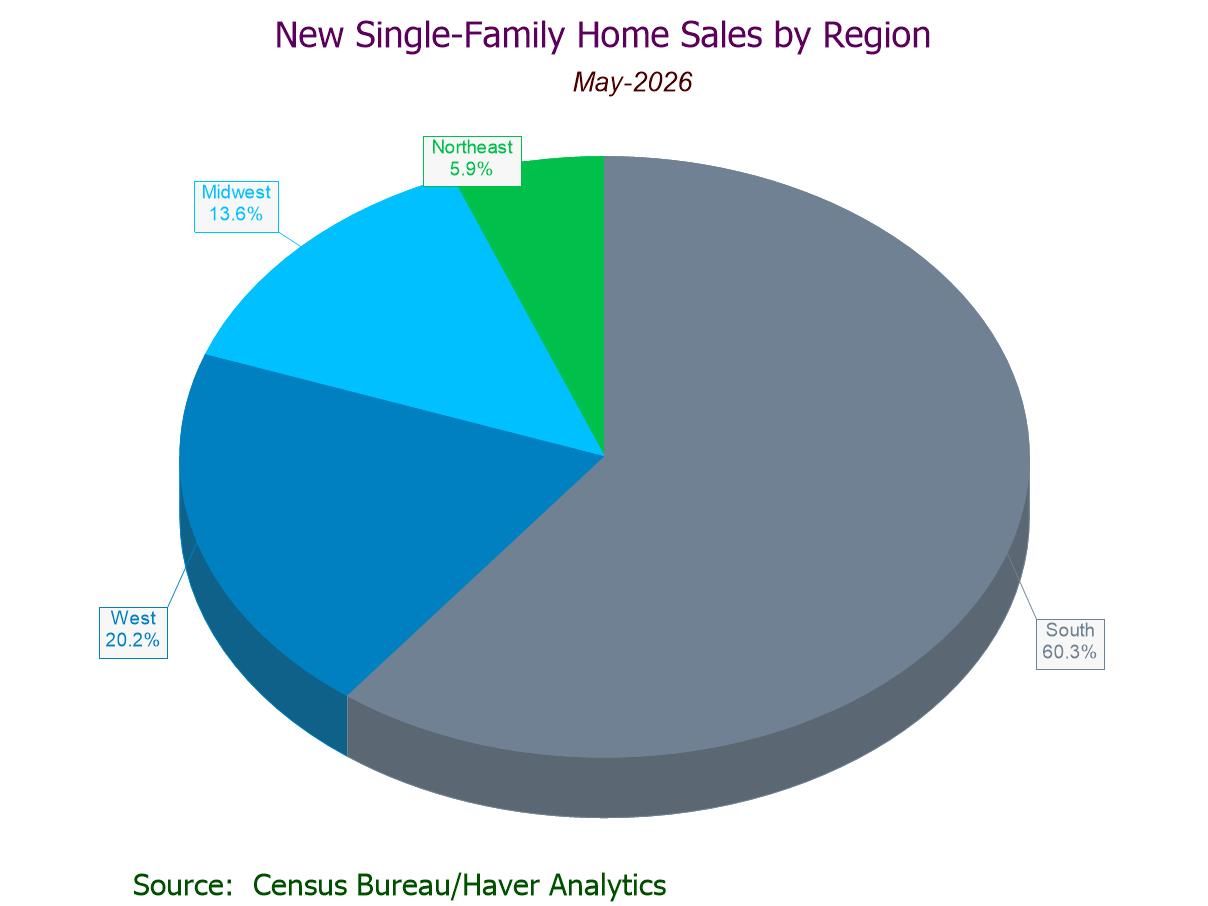
    • Sales -7.3% m/m (-6.8% y/y) to 580,000 in May; down 23.4% from a November high.
    • Sales m/m down in the West (-26.9%) and South (-4.1%); up in the Midwest (+16.2%) and Northeast (+3.0%).
    • Sales y/y down in all regions except the Northeast (+17.2%).
    • Median sales price +2.0% m/m to $424,900, a 5-month high; avg. price +7.8% m/m to $540,600, highest since July ’22.
    • Months' supply up to 10.3 mths., highest since July ’22.
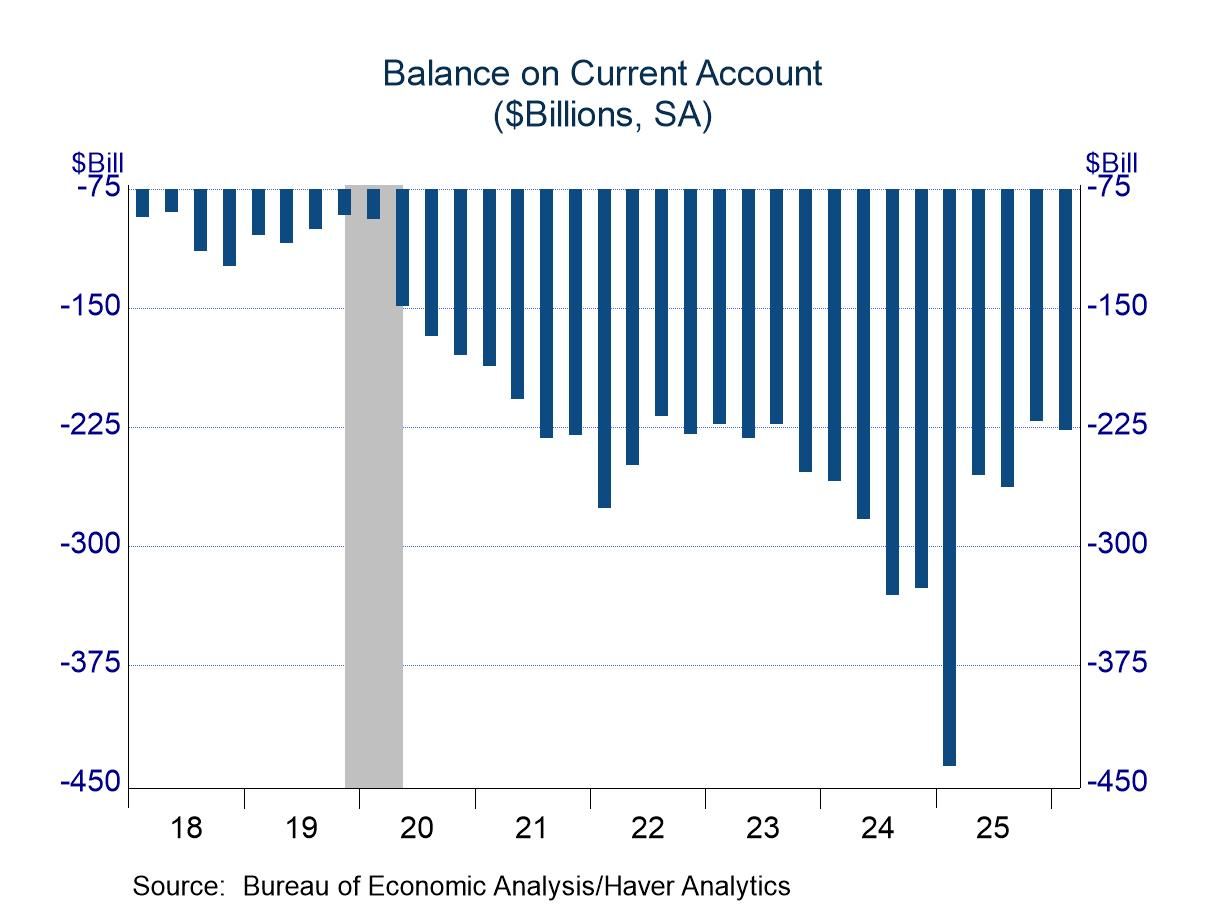
    • Improvement in the trade balance offset by weaker net investment income.
    • Annual revision showed wider deficit in 2025.