 Global| Jun 25 2026
Charts of the Week: Calmer Waters, New Currents
by:Andrew Cates
|in:Economy in Brief
Summary
The mood in global financial markets this week is more settled, though “settled” should not be confused with resolved. The US-Iran memorandum of understanding, signed last week, has continued to do its work: oil prices have fallen further, Strait of Hormuz shipping traffic has picked up measurably, and the risk premium that had been embedded in energy markets since the conflict escalated in March is now visibly unwinding. That is a material development for the inflation outlook, and central bankers will be watching carefully. Yet the picture is not without its complications. Technology stocks — the most conspicuous beneficiary of the prevailing low-rate, high-growth narrative — have been subject to renewed jitters this week, as investors grow more attentive to stretched valuations and the implications of a Federal Reserve that, under new chair Kevin Warsh, is no longer signalling the easing cycle previously priced into markets. Against this backdrop, this week’s charts draw on the latest data to assess where the global economic cycle stands. Equity momentum outside the United States has tracked closely with global growth and inflation surprises, a correlation that tells us something important about how activity is being perceived (chart 1). Meanwhile, the breakdown of the previously tight relationship between oil prices and US two-year yields is arguably one of the more telling market signals of recent weeks (chart 2). June’s flash PMI surveys point to easing supply chain stress and softer output price inflation in manufacturing — a finding that chimes naturally with lower crude prices and the resumption of Hormuz flows (chart 3). The Strait of Hormuz itself deserves a closer look: traffic data and the mechanics of the oil price pullback are telling a coherent story that supports the PMI picture (chart 4). South Korea’s trade data, including semiconductors, offer a slightly softer read on global demand momentum at the margin (chart 5). And looming on the horizon, one new risk is drawing the attention of meteorological authorities: a Super El Niño event whose probability has been rising, with potentially significant implications for food commodity prices and Asian agriculture (chart 6).
Equity Momentum and Global Surprises — Still Moving Together One of the more telling features of global equity markets in 2026 has been the persistence of the correlation between non-US equity momentum and global growth and inflation surprise indices. Equity markets outside the United States have generally prospered when economic data have beaten consensus expectations and when inflation surprises have been negative — a combination that has historically been associated with stronger corporate earnings and a more benign policy backdrop in economies other than the US. That correlation has held reasonably well through the turbulence of the past few months, even as the Middle East conflict introduced significant noise into both the economic data and the financial market signal. What the chart reveals this week is a picture of moderate but not alarming deterioration: global growth surprises have softened at the margin, consistent with the energy cost headwinds that have weighed on European and Asian activity, but the relationship between equity momentum and the broader data pulse remains intact. It is a signal that market participants continue to track economic fundamentals rather than purely geopolitical newsflow — a modestly reassuring sign that the underlying framework for assessing the global cycle has not broken down.
Chart 1: Non-US Equity Momentum vs Global Growth and Inflation Surprises

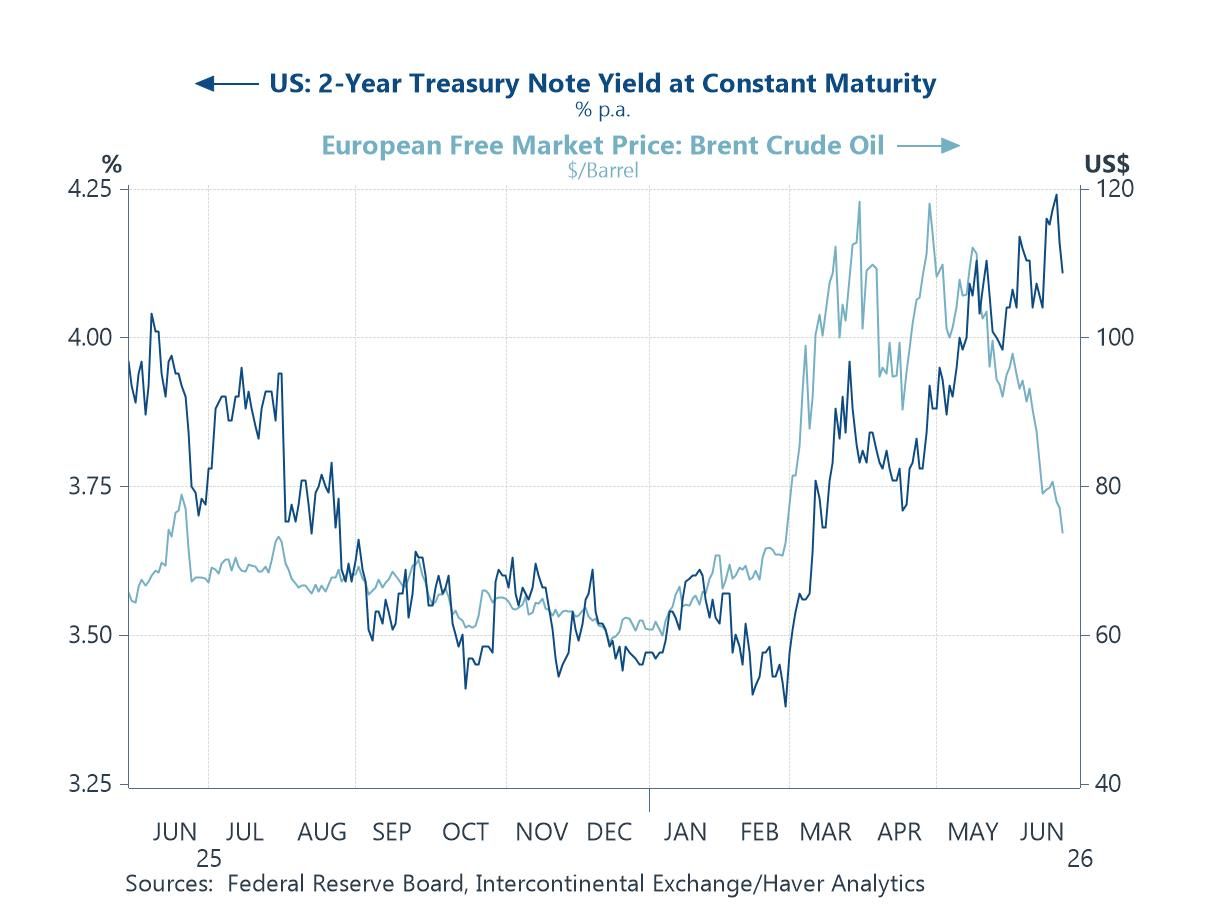
The Fed Decouples: Why Oil and US Two-Year Yields Have Parted Ways For much of 2026, oil prices and US two-year Treasury yields moved in close alignment. The logic was straightforward: higher oil prices raised inflation expectations, which in turn pushed market participants to anticipate a more hawkish Federal Reserve, lifting short-dated yields in the process. That relationship held with notable consistency through the March escalation and the months that followed, as energy market shocks and monetary policy expectations fed off each other. What this week’s chart captures is a striking breakdown in that correlation. As oil prices have fallen on the back of the US-Iran memorandum of understanding and the associated unwinding of the geopolitical risk premium, US two-year yields have not followed them lower. The reason is last week’s Federal Reserve meeting. Under new chair Kevin Warsh, the Fed delivered a hawkish dot plot that shifted the median year-end projection to a hike, making clear that the easing cycle previously priced by some market participants is no longer the central scenario. The message is important: the deflationary impulse from lower oil prices is being offset — at least in the Fed’s framing — by persistent underlying inflation pressures and a commitment to keeping policy tight.
Chart 2: Oil Prices and US Two-Year Treasury Yields — A Correlation That Has Broken Down
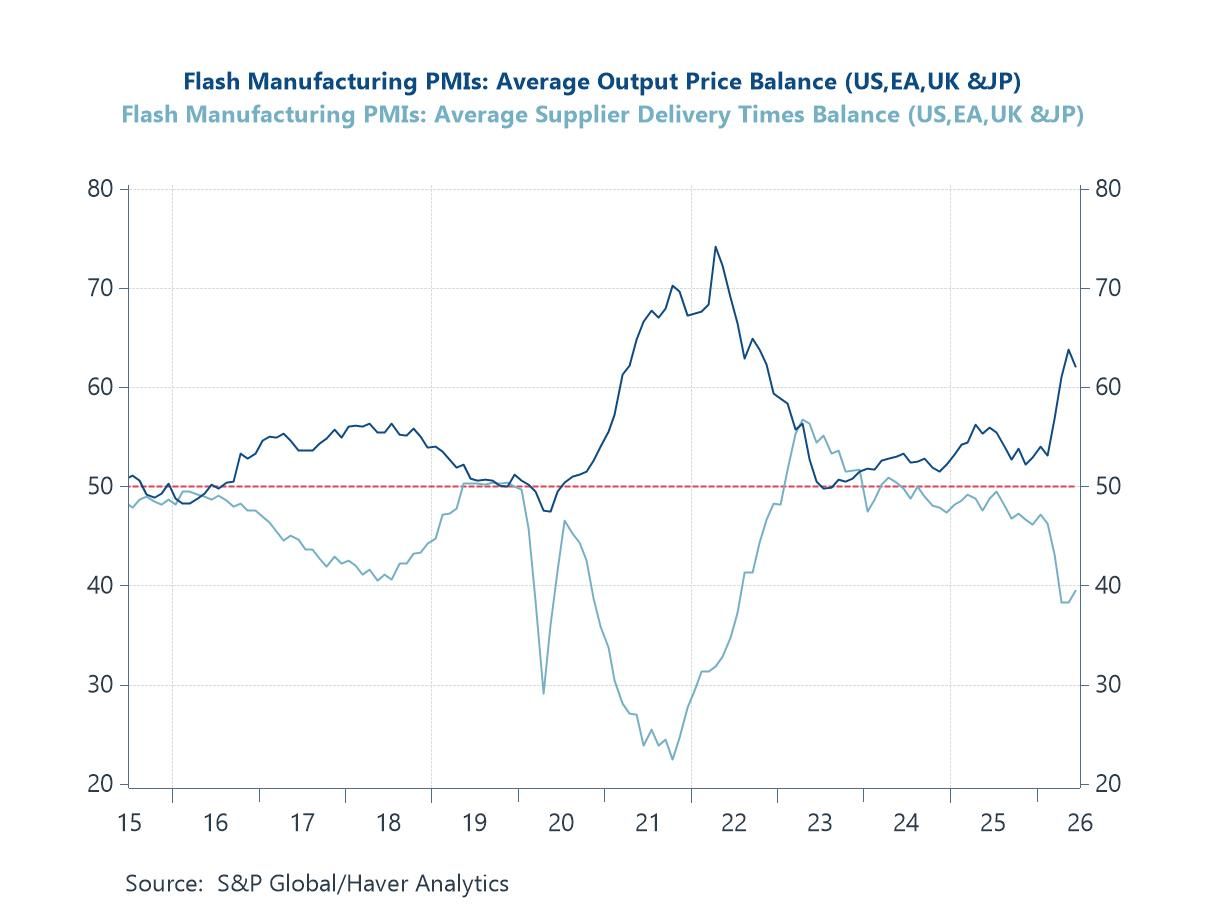
Flash PMIs Signal Easing Supply Chain Stress and Softer Price Pressures June’s flash PMI surveys, released this week across the major advanced economies, provide a timely read on how the global manufacturing and services sectors are absorbing the shifting macro backdrop. Two findings stand out. First, supplier delivery times have improved (or not lengthened as much as they had in the prior two months). This finding coheres naturally with the broader narrative: lower oil prices reduce transport and energy input costs, while the resumption of Strait of Hormuz shipping flows — examined in more detail in chart 4 — is beginning to reduce the freight disruption and re-routing costs that had been building since the conflict escalated. Second, output price inflation in manufacturing has softened, suggesting that some of the pipeline pressure from earlier energy cost spikes is beginning to fade.
Chart 3: Flash PMI Supply Chain and Output Price Sub-Indices — Early Signs of Easing
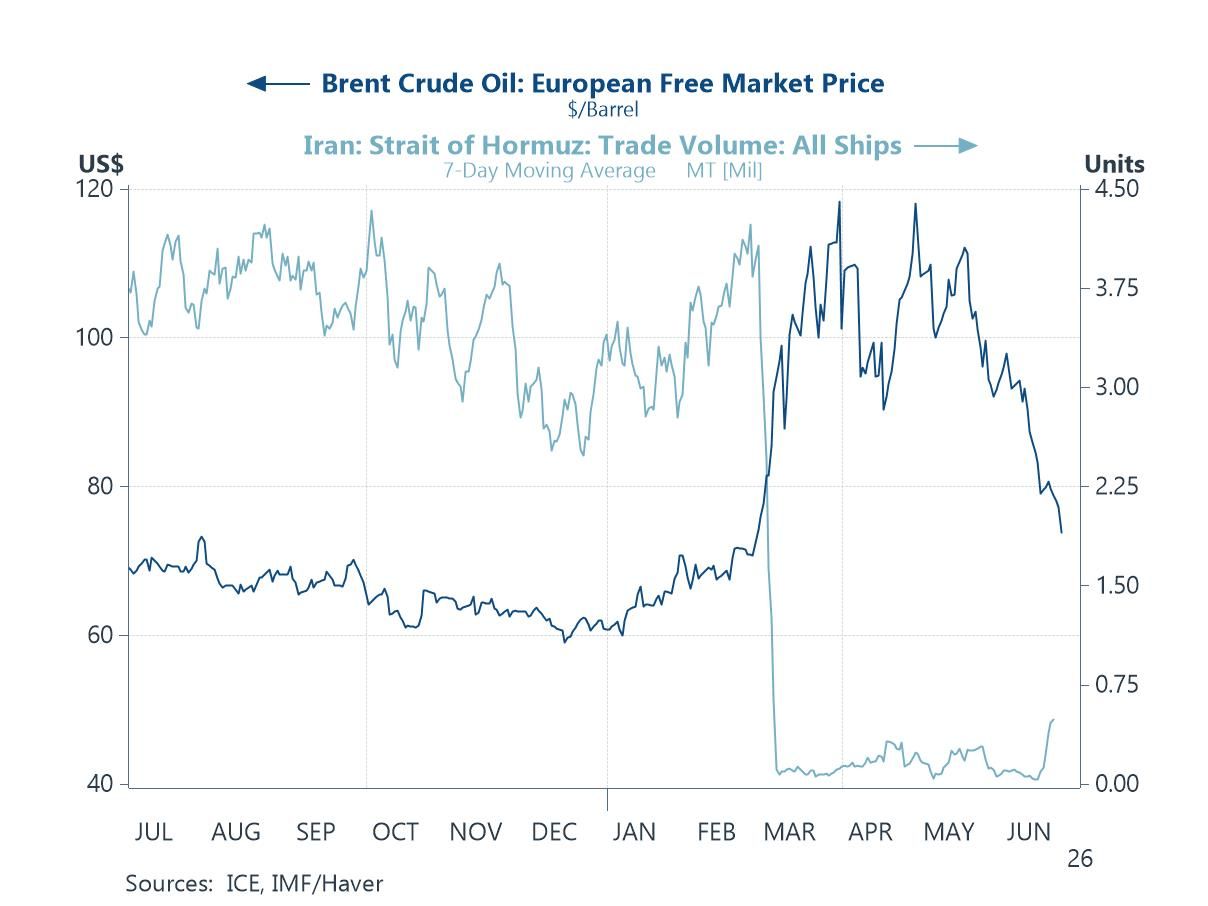
Hormuz Traffic and Oil: A Coherent Story of Tentative Normalisation The recent US-Iran memorandum of understanding to work towards a final deal, though not without subsequent flare-ups, has already brought relief to markets, most visibly in crude oil prices. This should go a long way towards unwinding the inflation-related concerns that previously elevated oil prices had stoked. While the pullback has owed much to anticipation of the glut of pent-up supply expected to follow, certain trackers of shipping volume through the Strait of Hormuz, such as the IMF’s, already point to a marked pickup in traffic, even if it remains well below pre-conflict levels. Should this normalisation of shipping flows persist, it would lend continued justification to a corresponding easing in oil prices, energy-related inflation and, by extension, headline inflation — a welcome development for central banks grappling with the delicate balancing act of reining in price pressures without dampening growth too sharply.
Chart 4: Strait of Hormuz Shipping Traffic and Brent Crude Oil Price
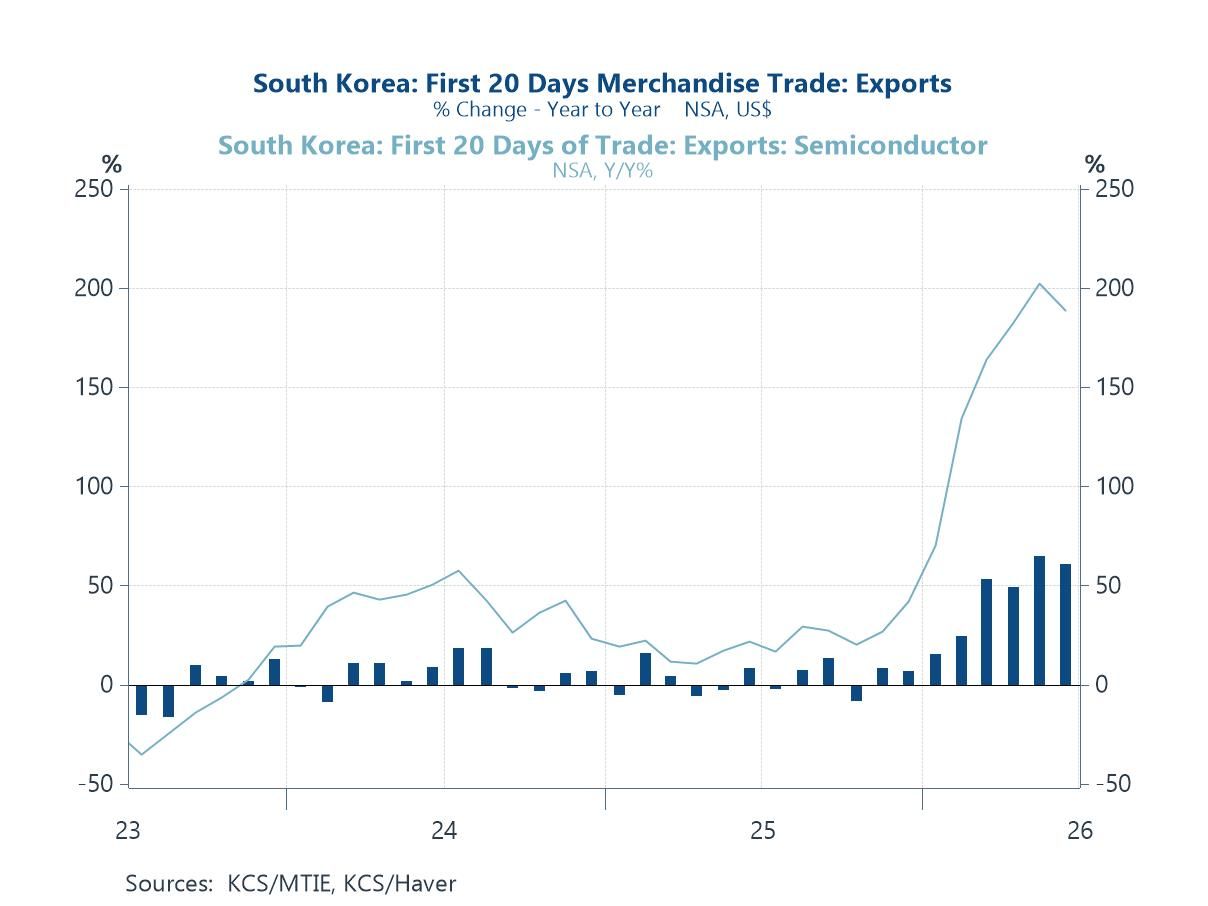
South Korea’s Trade Data Flag a Modest Softening in Global Demand South Korea’s trade data serve as one of the global economy’s most useful early warning systems. As one of the world’s most open economies, with exports spanning semiconductors, petrochemicals, steel, automobiles and consumer electronics, South Korea’s monthly trade figures provide a timely and broad-based read on the state of global demand. This week’s data show a slightly softer picture than the strong prints that characterised much of the first quarter. Headline export growth has moderated at the margin, and crucially, semiconductor exports — which had been the most dynamic component of the trade data, propelled by AI-related chip demand — have also come in a touch below the exceptional run rates seen earlier in the year. This is not, in itself, alarming: some moderation from peak rates was always to be expected, and the semiconductor cycle remains structurally supported by the scale of AI infrastructure investment globally.
Chart 5: South Korea Exports — Total and Semiconductors
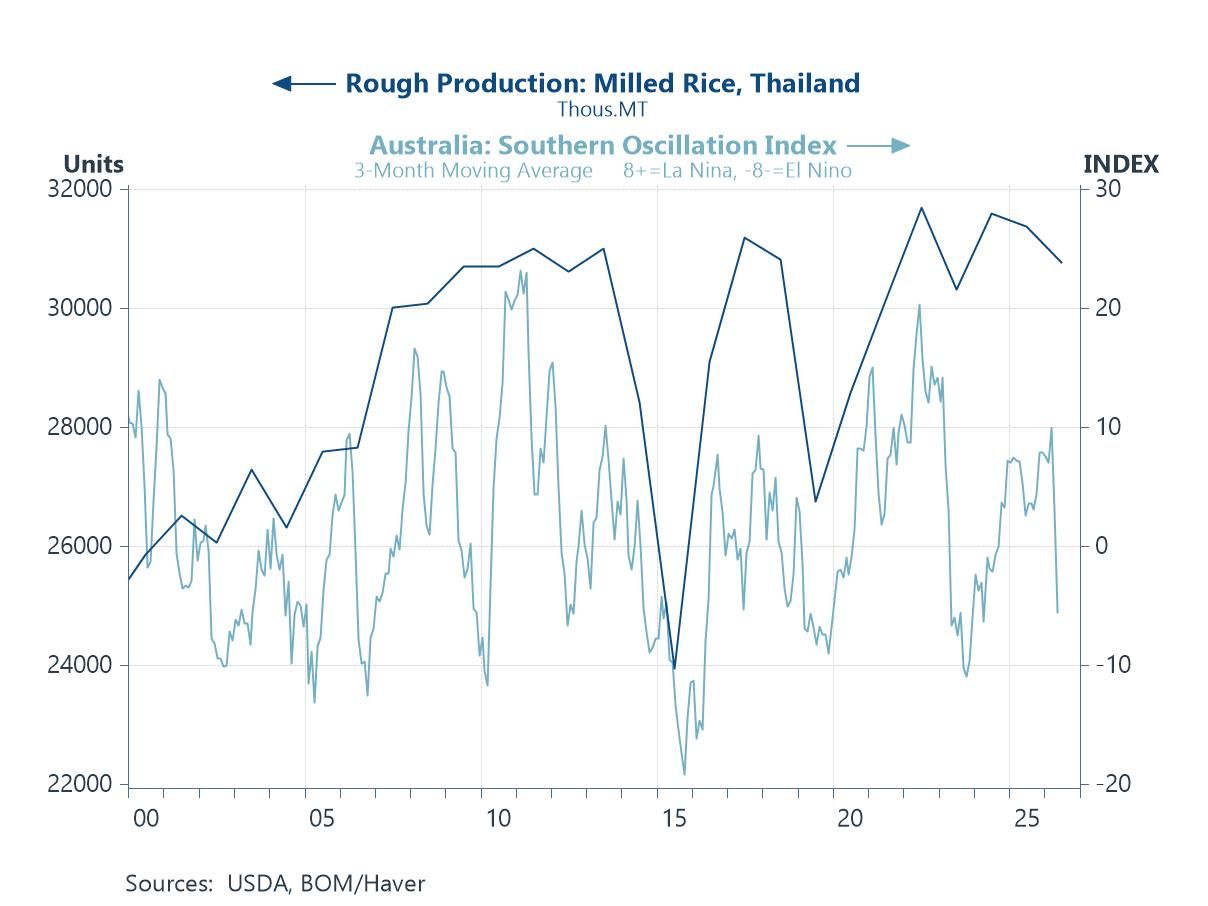
A Super El Niño on the Horizon — The Next Inflation Risk With that said, while one driver of price pressures seems to be ebbing for now — albeit not without the risk of future flare-ups — another potential inflationary risk looms on the horizon. The chart illustrates the transmission mechanism. It plots Thailand’s milled rice production (left axis) against Australia’s Southern Oscillation Index (right axis), a well-established barometer of El Niño and La Niña conditions. The convention is straightforward: SOI readings persistently above +8 indicate La Niña, associated with above-average rainfall across Southeast Asia and broadly supportive crop conditions; readings persistently below -8 signal El Niño, which brings drought stress and reduced water availability across the region. The historical relationship is striking. The sharp negative SOI troughs around 2002–03, 2009–10 and most dramatically around 2015 all coincide with visible falls in Thai milled rice output. The severe El Niño of 2014–16 produced both the deepest SOI trough in the series and the sharpest single drop in rice production, to below 24,000 thousand tonnes. As meteorological authorities have been warning for some time, the world appears to be facing an imminent Super El Niño event, with the SOI already drifting back towards negative territory in recent months. Were a significant El Niño to materialise in the second half of this year, the implications for Thai rice output — and by extension for Asian food price inflation — could be substantial. Central bankers, in other words, may find themselves having to wrestle with a new inflationary impulse just as they had begun to hope the worst was behind them.
Chart 6: Thailand Milled Rice Production vs Australia’s Southern Oscillation Index

Andrew Cates
AuthorMore in Author Profile »Andy Cates joined Haver Analytics as a Senior Economist in 2020. Andy has more than 25 years of experience forecasting the global economic outlook and in assessing the implications for policy settings and financial markets. He has held various senior positions in London in a number of Investment Banks including as Head of Developed Markets Economics at Nomura and as Chief Eurozone Economist at RBS. These followed a spell of 21 years as Senior International Economist at UBS, 5 of which were spent in Singapore. Prior to his time in financial services Andy was a UK economist at HM Treasury in London holding positions in the domestic forecasting and macroeconomic modelling units. He has a BA in Economics from the University of York and an MSc in Economics and Econometrics from the University of Southampton.


