U.S. NFIB Small Business Optimism Climbs in July to an 11-Month High
Summary
- NFIB Small Business Optimism Idx up 2.4 pts. to 99.8 in July, above its 52-year avg. of 98.0.
- Uncertainty Idx up 2 pts. to 91, well above the historical avg. of 68.
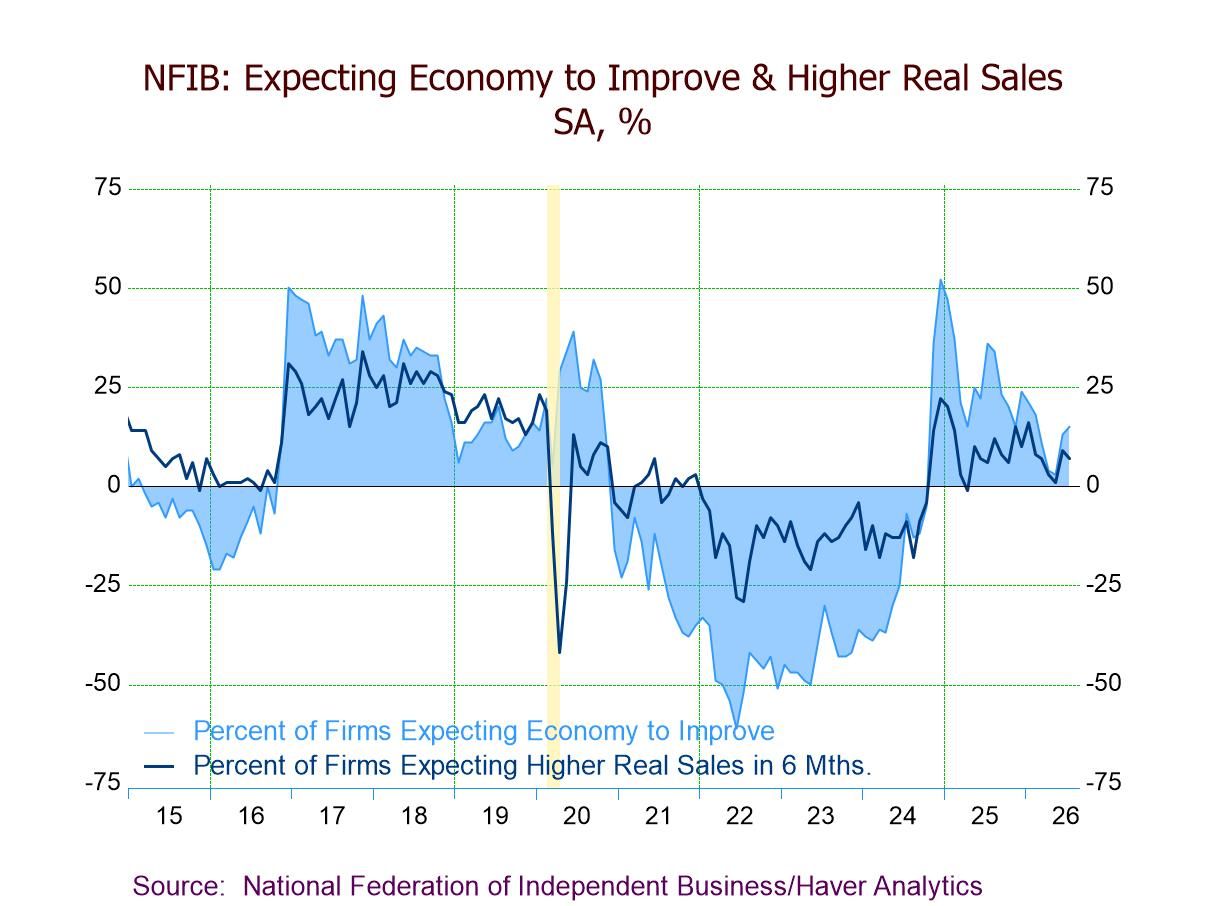
- Expectations for economy up 2 pts. to 15%, highest since Feb.
- Expected real sales down 2 pts. to 7% from June’s five-month high.
- Plans to expand business up 4 pts. to 12%, a five-month high.
- Hiring plans up 9 pts. to 20%, highest since Oct. ’22.
- Firms raising avg. selling prices down 7 pts. to 31%, a three-month low.
- Top three business concerns: labor quality (27%), taxes (16%), and inflation (14%).
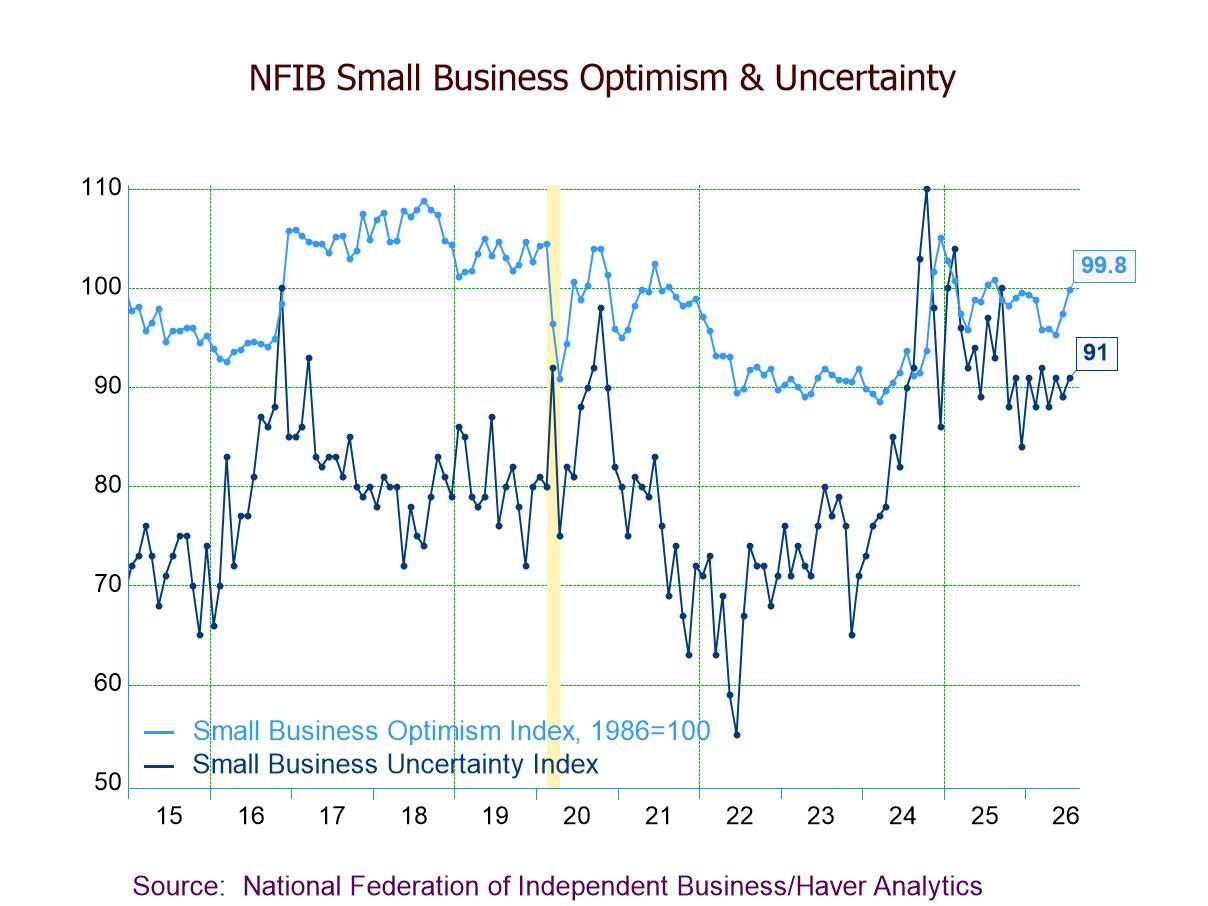
The NFIB Small Business Optimism Index rose to 99.8 in July after a 2.1-point rebound to 97.4 in June, according to the Small Business Economic Trends survey from the National Federation of Independent Business, indicating small business sentiment improved to the highest level since August 2025. The index was above its 52-year average of 98.0 for the first time since February and above a low of 88.5 in March 2024, albeit below 100.3 in July 2025 and a peak of 105.1 in December 2024. Eight of the 10 index components rose, while two fell. The NFIB Small Business Uncertainty Index improved to 91 in July following a two-point decline to 89 in June, remaining well above its historical average of 68. The index was up from its recent low of 84 in December 2025 and a low of 65 in November 2023, while below its record high of 110 in October 2024.
The outlook for business conditions in the next six months remained positive for the 21st straight month in the latest survey. The net balance of respondents expecting the economy to improve increased to 15% in July, a five-month high, following a 10-point recovery to 13% in June; these readings were far below a high of 52% in December 2024 but significantly above a record low of -61% in June 2022. Expected real sales declined to a net 7% in July from a five-month high of 9% in June; the latest figure was below a high of 22% in December 2024 but above a low of -18% in August 2024. A net -4% of respondents reported higher nominal sales in the past three months, unchanged from June; the latest result remained above a low of -20% in October 2024 but below the recent positive reading of 1% in February and a peak of 9% in June 2021.
Plans to expand the business advanced to 12% in July, a five-month high, from 8% in June; the latest figure was down from a high of 20% in December 2024 but up from a low of 2% in March 2023. Plans to make capital outlays rose to 25% in July, the highest reading since December 2024, from 20% in June; these numbers were still below a high of 28% in November 2024 and a peak of 31% in October 2021. Expected credit conditions edged up to -4% in July from -5% in June; this result was slightly below a high of -2% in December 2024 but above a low of -11% in November 2023. Meanwhile, a net -2% of respondents viewed current inventory stocks as “too low” in July, down from 0% in June (matching the highest reading since August 2025); the positive reading of 1% was recorded in May 2025.
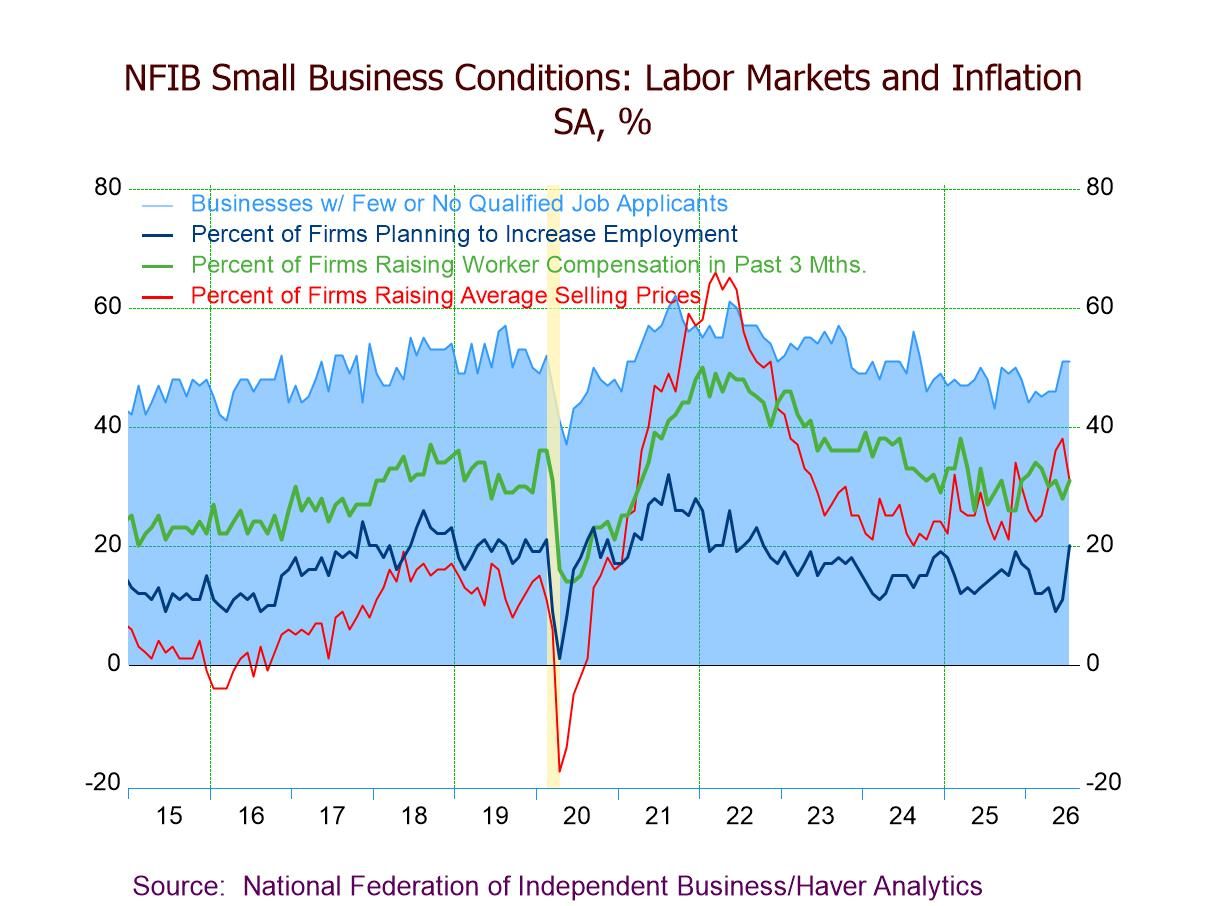
On the labor front, 51% of respondents reported that qualified workers to fill job openings were hard to find in July, unchanged from June and registering the highest level since September 2024. These numbers were above a low of 43% in August 2025 but below a high of 56% in August 2024 and a peak of 62% in September 2021. A net 20% planned to increase employment in July, up from 11% in June and matching the highest level since October 2022; it remained above a low of 11% in March 2024 but below a peak of 32% in August 2021. Notably, 36% reported positions not able to be filled in July, up from 32% in June and matching the highest reading since June 2025; these figures remained below a high of 51% in May 2022.
Overall earnings trends had remained in negative territory since December 2019. The measure increased to -16% in July following a five-point decline to -20% in June. These readings were below the most recent high of -14% in February and a high of -5% in June 2021 but above a low of -37% in August 2024.
On the pricing front, actual and expected selling prices remained at an inflationary level, indicating continued inflationary pressures, albeit at slower rising paces. The net percent of firms raising their average selling prices fell to a still-elevated 31% in July, the lowest level since April and the first m/m decline since February, after a two-point increase to 38% in June. The latest reading was up from a low of 20% in August 2024 but well below a peak of 66% in March 2022. The percentage planning to raise prices eased to 28% in July, a three-month low, following a two-point decline to 32% in June; these readings remained above a low of 21% in April 2023.
Wage inflation remained relatively high in the July survey. A net 31% of respondents raised compensation during the last three months, up from 28% in June and equaling May’s reading. It was above a low of 26% in November 2025 but below a high of 46% in February 2023 and a peak of 50% in January 2022. A net 19% of firms planned to raise worker compensation in the next three months, up from 17% in June and registering the highest level since February; this remained below highs of 28% in November 2024, 30% in November 2023, and 32% in October 2022.
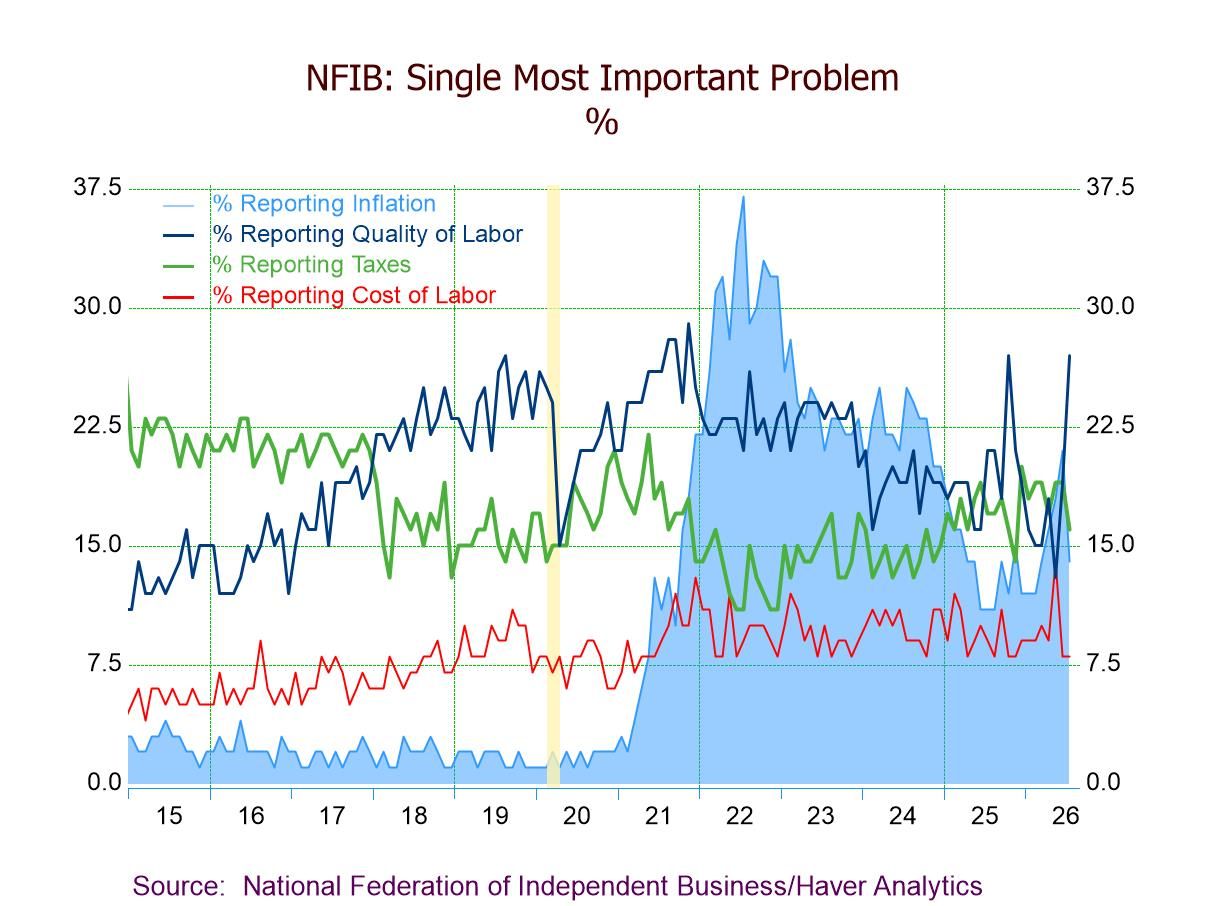
Labor quality was cited as the single most important problem facing small businesses, as reported by 27% of NFIB members in July, up from 19% in June and matching the highest since October 2025. Taxes ranked second as the next most important problem, as reported by 16% of respondents in July, down from 19% in June and May and representing the lowest since November 2025. Inflation also remained a key challenge for small businesses, as reported by 14% of respondents in July, matching the lowest since March, compared to 21% in May (the highest since October 2024); these readings were well below a peak of 37% in July 2022. Other concerns (in July vs. June) included labor costs (8% vs. 8%), insurance cost/availability (8% vs. 8%), poor sales (8% vs. 7%), government requirements (7% vs. 8%), and competition from large businesses (7% vs. 5%).
According to the Small Business Administration, there are 33 million small businesses in the United States, which employ 62 million workers. The NFIB surveys anywhere from 500 to 2000 respondents each month and the typical firm employs 10 people and reports gross sales of about $500,000 a year. The NFIB figures can be found in Haver’s SURVEYS database.

Winnie Tapasanun
AuthorMore in Author Profile »Winnie Tapasanun has been working for Haver Analytics since 2013. She has 20+ years of working in the financial services industry. As Vice President and Economic Analyst at Globicus International, Inc., a New York-based company specializing in macroeconomics and financial markets, Winnie oversaw the company’s business operations, managed financial and economic data, and wrote daily reports on macroeconomics and financial markets. Prior to working at Globicus, she was Investment Promotion Officer at the New York Office of the Thailand Board of Investment (BOI) where she wrote monthly reports on the U.S. economic outlook, wrote reports on the outlook of key U.S. industries, and assisted investors on doing business and investment in Thailand. Prior to joining the BOI, she was Adjunct Professor teaching International Political Economy/International Relations at the City College of New York. Prior to her teaching experience at the CCNY, Winnie successfully completed internships at the United Nations. Winnie holds an MA Degree from Long Island University, New York. She also did graduate studies at Columbia University in the City of New York and doctoral requirements at the Graduate Center of the City University of New York. Her areas of specialization are international political economy, macroeconomics, financial markets, political economy, international relations, and business development/business strategy. Her regional specialization includes, but not limited to, Southeast Asia and East Asia. Winnie is bilingual in English and Thai with competency in French. She loves to travel (~30 countries) to better understand each country’s unique economy, fascinating culture and people as well as the global economy as a whole.
More Economy in Brief
 Global