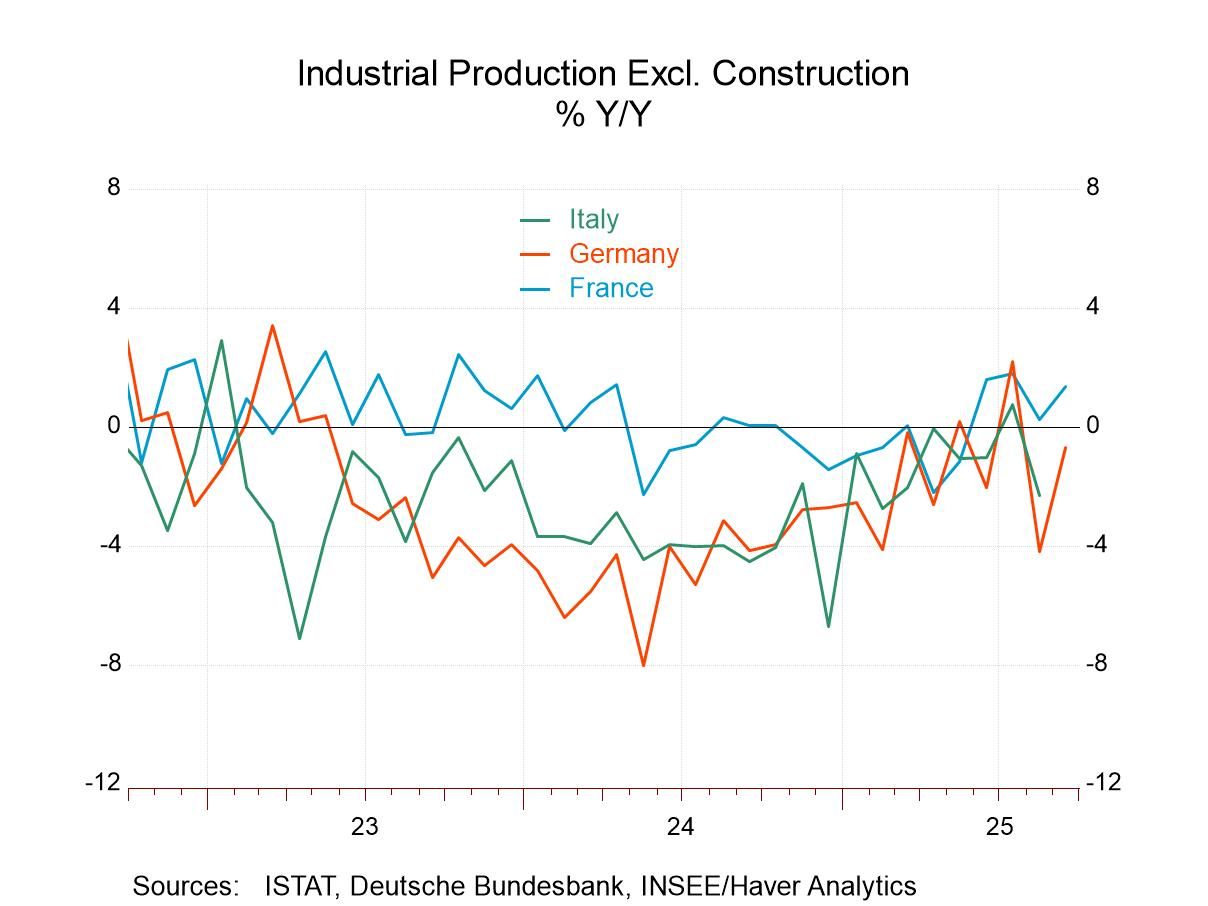
Industrial output in the European Monetary Union in September advanced by 0.2% after falling by 1.1% in August and rising by 0.7% in July. Output of consumer goods fell in the month with overall consumer goods output falling by 2.5% and a 0.5% reduction in consumer durables output and a 2.6% reduction in the output of consumer nondurable goods. However, intermediate goods output grew by 0.3% and capital goods output rose by 0.3% in September. Output fell broadly across each of these sectors and subsectors in August but then it rose in all of them in July. Output metrics have been through a bit of turbulence over the last three months.
Sequential Growth Performance Sequential calculations showing annual rates of growth over 12 months, six months and three months reveal some weakening in output and then some diminishing of that trend. Overall output rises by 1.4% over 12 months. Then output falls at a 4.9% annual rate over six months and that reduction in its cut to -0.8% over three months. Manufacturing follows that same pattern. Consumer goods output also follows that pattern, but durables and nondurables output of consumer goods are on the same wavelength with the only difference that consumer durables output also falls over 12 months. Intermediate goods output rises by 0.3% over 12 months, falls at a 3.3% rate over six months, and then rises at a 2.3% annual rate over three months. Capital goods output is up by 1.5% over 12 months, falls at a 2.9% annual rate for six months, and then is flat over three months. The sector results show a good deal of chaos in terms of trying to pin down a trend.
Quarter-to-Date Quarter-to-date that now show results for the full third quarter on this preliminary note, reveal output eroding by 0.1% at an annual rate; manufacturing output falling at a 0.4% annual rate, with an increase in consumer goods at a 1% annual rate, created totally by an increase of 1.5% consumer nondurable goods output. Intermediate goods and capital goods both show output declines in the just-ended quarter.
Rankings/Standings The percentile standings show that consumer durable goods output is below its median at a 39.9 percentile standing. Intermediate and capital goods output also are both below their medians (below 50%) but a 45-percentile standing for intermediate goods and a 46.8 percentile standing for capital goods prevail. However, these are not tremendously weak values; they're just slightly below their median rates of increase since the median rate of increase occurs at a ranking of 50%.
Country Performance for Manufacturing We're revisiting the country data much of which has already been released. Out of 13 monetary union members in the table only 5 show output declines in September and none of the four largest economies log a decline in output in September. However, seven countries had logged declines in August, and six had logged declines in July.
Countries Sequentially Turning to sequential data annual growth rates over 12 months, six months, and three months, there are declines in six countries over three months, in seven countries over six months but in only four countries over 12 months. The country's logging output declines over 12 months include Germany, Finland, Luxembourg, and Malta.
Quarter-to-Date On a quarter-to-date to date basis, there are five countries that log output declines in the third quarter. They are Germany, Finland, Portugal, Luxembourg, and Malta.
Country Standings The queue percentile standings show five countries with output increasing at a pace below its median pace since 2007. The average of the median standings across countries is a reading of 63.8% and that's the same as the standing for output in the whole euro area. While the performance of output is still somewhat irregular, conditions appear to be solidifying and risks to the downside appear to be diminishing. Conditions remain somewhat touch and go. The European Central Bank is in a waiting mode; it has not turned off its easing cycle. In the United States, it's unclear whether the Fed is going to continue the easing cycle or not. The government shutdown in the U.S. makes U.S. policy options more complicated although the outlook for growth in the United States in 2026 with new fiscal provisions in force and a rebound out of the government shutdown appear to be quite good. However, globally inflation is still largely excessive and central banks are definitely running out of room to become more stimulative.
 Global