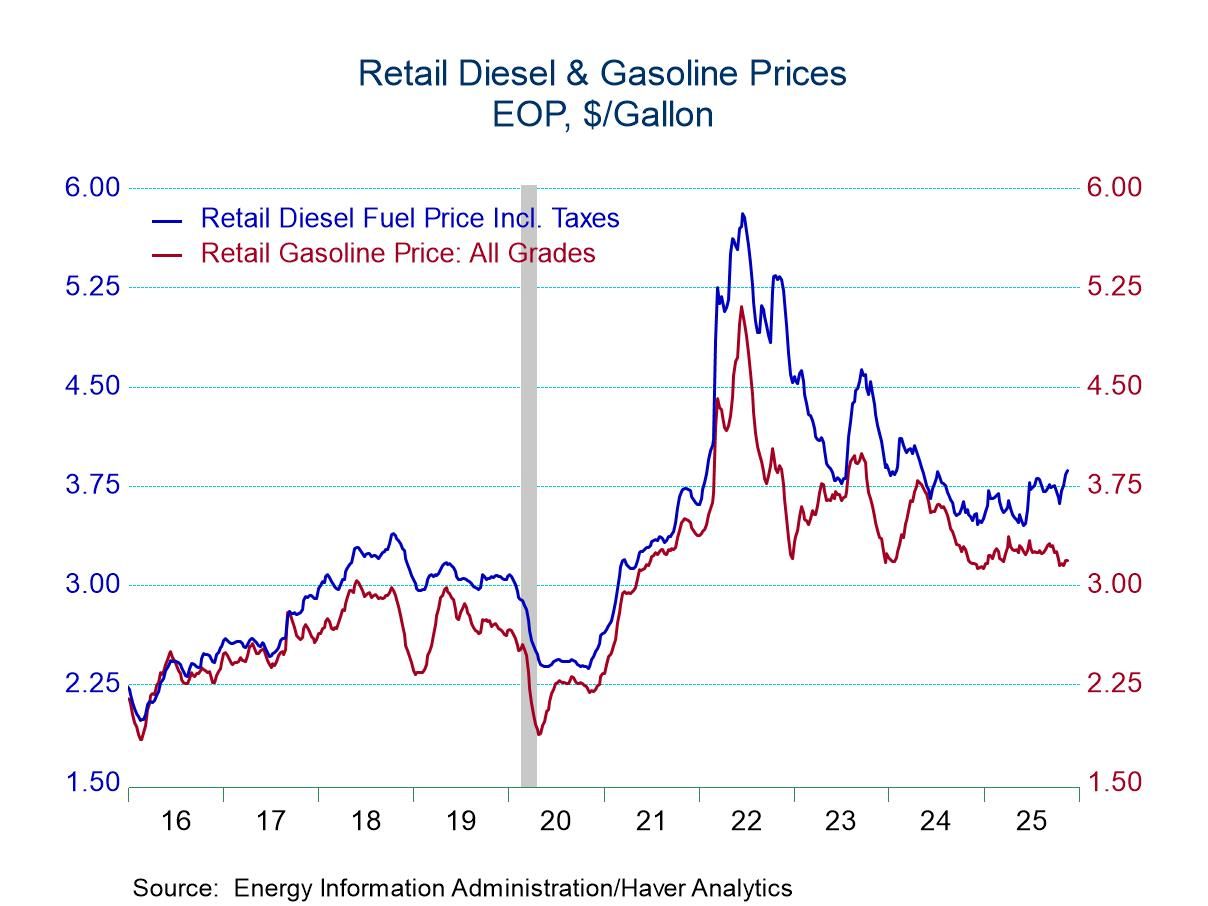
- Gasoline prices hold steady week-to-week.
- Crude oil prices decline.
- Natural gas prices move to highest level since April.
- Demand for gasoline & all petroleum products declines.
 USA| Nov 18 2025
U.S. Energy Prices Remain Mixed in Latest Week
by:Tom Moeller
|in:Economy in Brief
 USA| Nov 18 2025
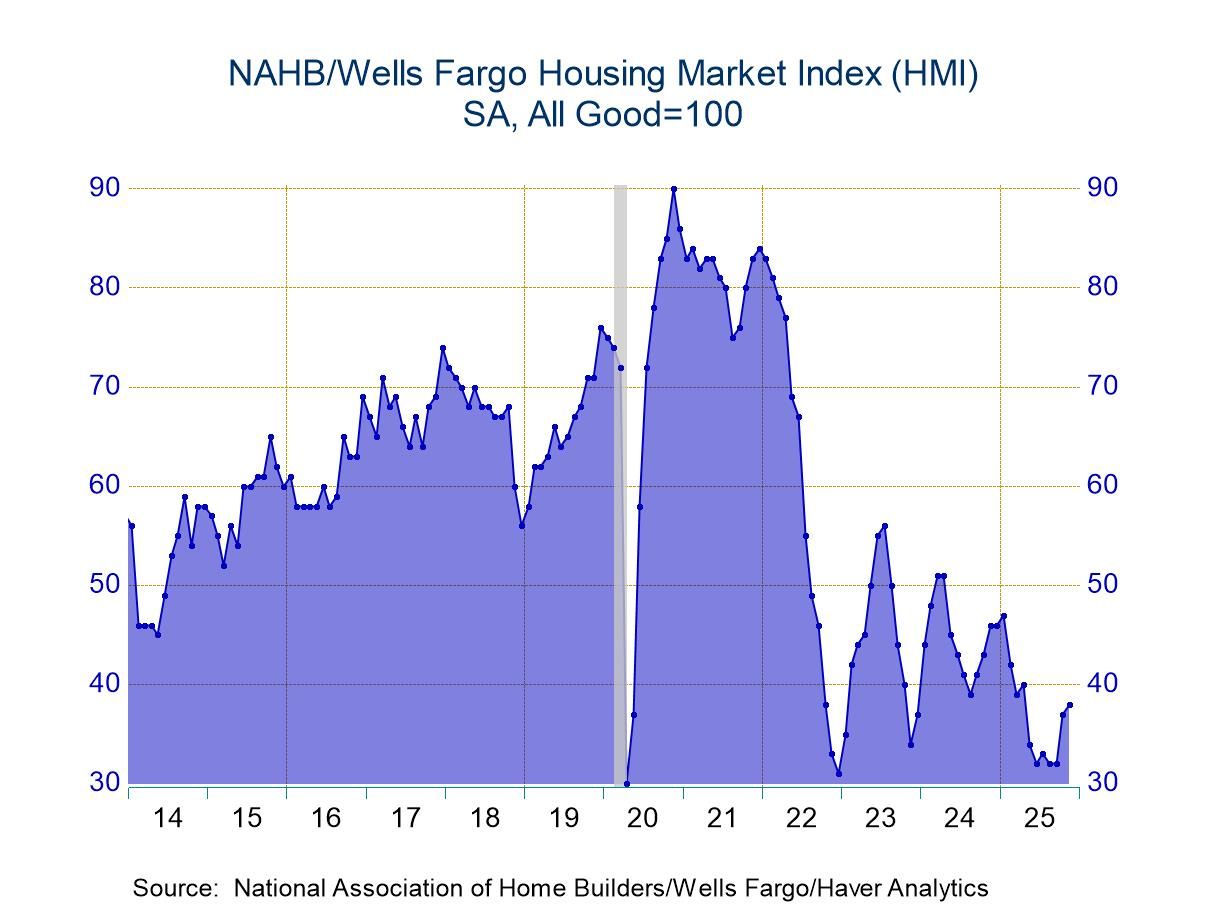
U.S. Home Builders Index Edges Higher in November
- Overall reading is highest in six months.
- Current sales traffic improves; prospective sales backpedal.
- Index is mixed throughout the country.
by:Tom Moeller
|in:Economy in Brief
 Canada| Nov 17 2025
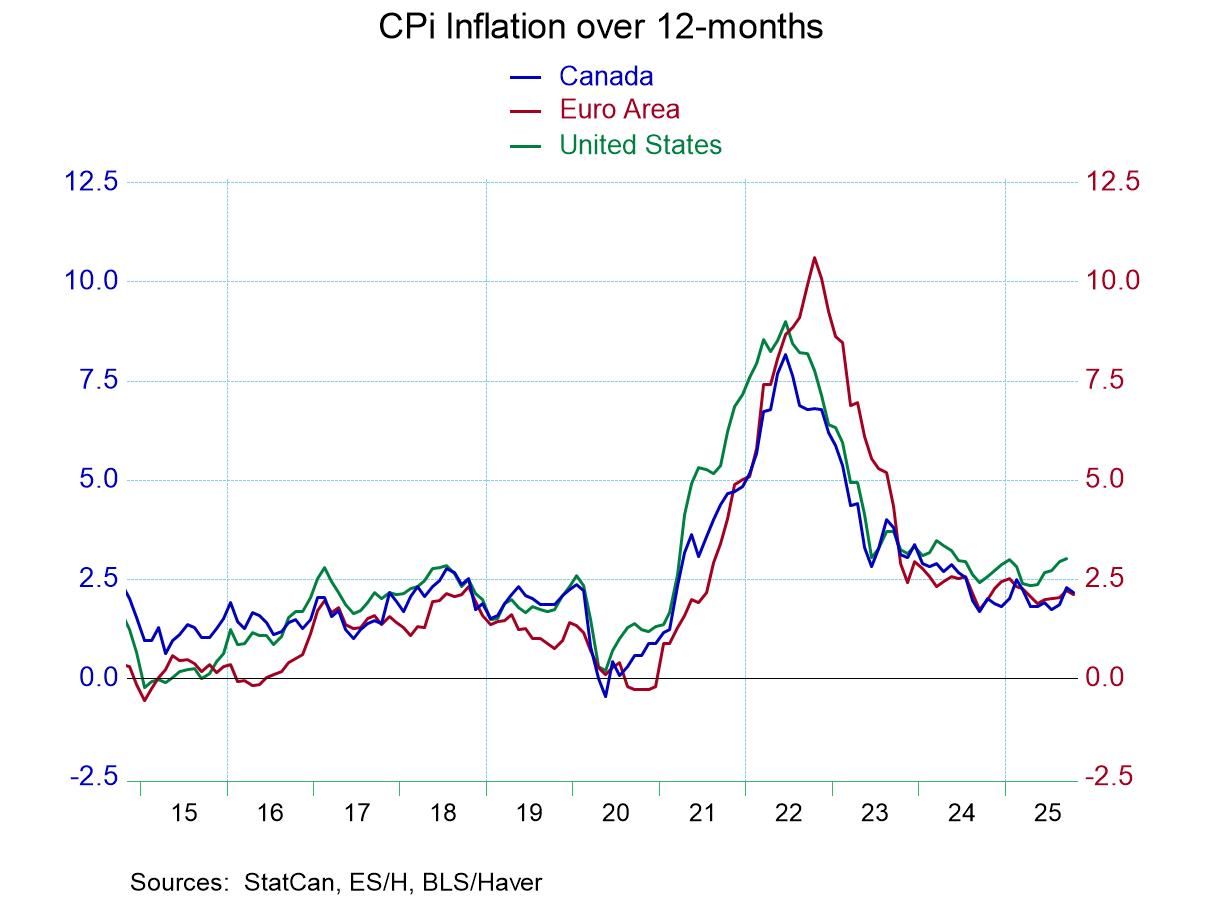
Canadian CPI Trends Show Little Change
Inflation around the world appears to be rather similarly behaved Canada is a very close trading partner of the United States and so we might expect that there would be a little more connection between the prices in Canada and in the US and possibly we can learn something about the upcoming US CPI report by looking at the just-released Canadian CPI report.
Canadian inflation is highly correlated with inflation in the US. The US and Canadian CPI's have a correlation of 0.97 on annual percentage changes. Canada's CPIx measure has a correlation with the US headline CPI of 0.94 and the Canadian core inflation rate has the correlation with US core inflation rate of 0.94. All of these measured against year over year inflation. Clearly with a good deal of trade and a long common border prices in the US and Canada have a chance to mix it up and affect one another and create some degree of homogeneity. However, none of that is really perfect. Despite the strong correlation between headline inflation and core inflation between the US and Canada, Canada's core CPI and the US core CPI have a correlation based on month-to-month changes of less than 0.2 Using an R-squared metric.
Well, it might be somewhat comforting to look at Canadian inflation, and I think it's giving some guidance for the US. That would only be true over a long period of time, but it probably doesn't provide much guidance for us in terms of what we can expect from the month-to-month changes.
While Canada's correlation with US inflation is high it's correlation with inflation in Japan it's only 0.33: only 1/3 of the variants in these two indicators is in common. In terms of the Euro-Area the correlation is less than -0.1, which tells us the correlation is negative and extremely small and of course not statistically significant.
The Canadian CPIx measure shows inflation pretty flat at around 2.6% over 3 months and over 12 months. Canada's 6-mo CPI measure accelerates from 2.2% over 12-months to a 2.6% annual rate over 6-months to a 3% pace over three months. US inflation on these horizons essentially replicates what's presented by Canada's CPI X based on existing data. However, the R-squared association between the three month annualized percent change in the Canadian CPI versus the US CPI shows that they share about half of the same variation with an R-squared of about 0.5. And on this comparison Canada’s and US’ recent inflation trends appear to be highly similar.
The Bank of Canada looks at inflation using several different metrics and it also looks at inflation relative to a range unlike the US, leading to a much more measured discussion of what inflation is and how it's performing.
The decision by the Fed in the US to stick with a simple point forecast at this point is something that probably cannot be changed, at least not until the central bank is able to show that it can hit that target consistently. Even so, the Fed has not showed a great appetite for trying to express inflation in terms of a target band. However, when the Fed changed its framework agreement it did adopt something called flexible average inflation targeting (FAIT) which never really described for us or explained what it was and it has a set that approach aside I think to the pleasure of most economists.
There continues to be buzzing and differences of opinion over what the inflation target should be in the US. However, the international standard has been set at 2 per cent and at this point adopting a number different than that doesn't seem to make a lot of sense. Adopting 2% with some flexibility might make some sense but, of course, the Fed is already doing that as it's allowed a 4 1/2-year overshoot of its inflation target as it continues to cut rates. This decision, however, does not amount to a change in the Fed’s inflation targeting but rather to a set of decisions that appears to be losing the Federal Reserve credibility. Meanwhile, the Bank of Canada, operating with the range and having had much the same kind of access that the Fed has had in hitting and missing its inflation target midpoint, has emerged from this period with its credibility largely intact.
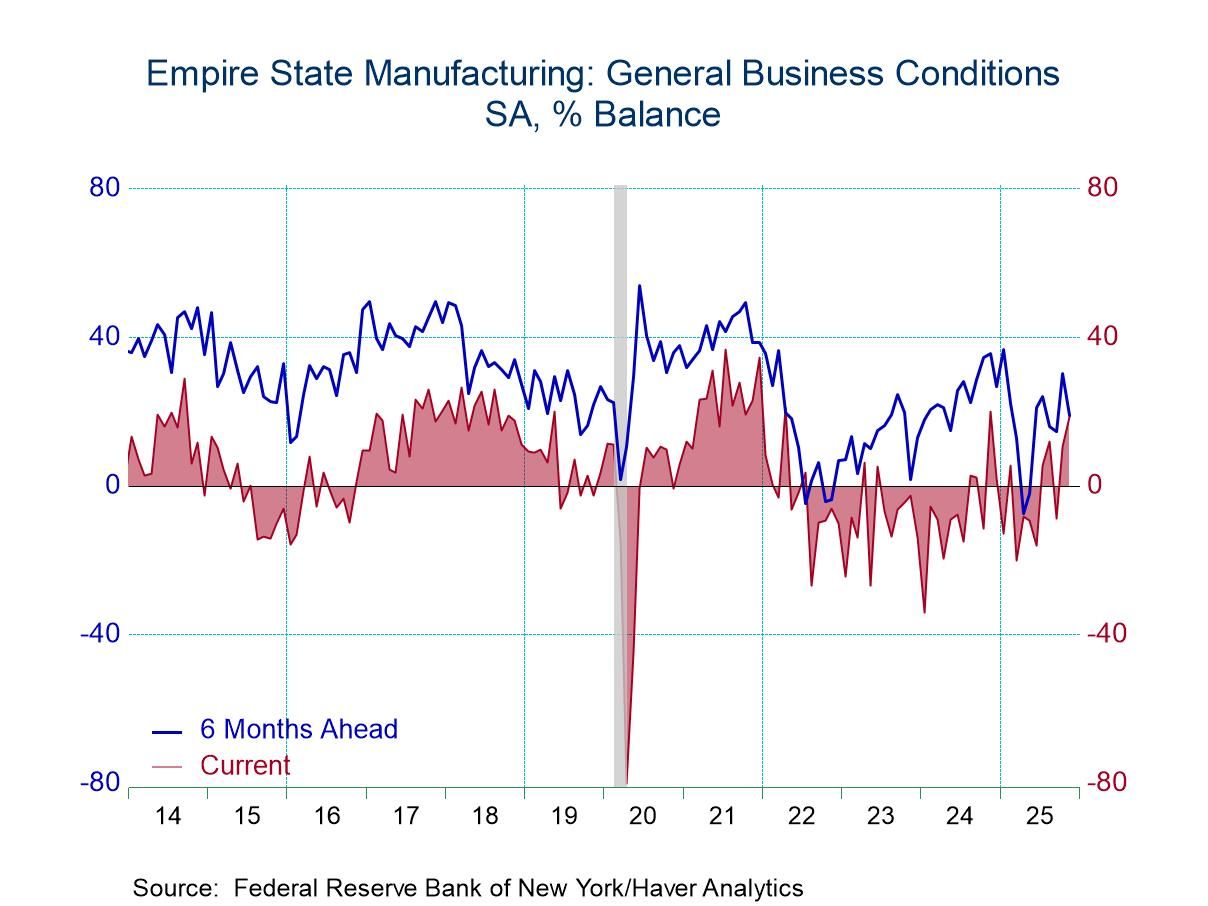
- New orders, shipments, employment & hours rise.
- Prices paid & received decline.
- Six-month outlook deteriorates.
by:Tom Moeller
|in:Economy in Brief
 USA| Nov 14 2025
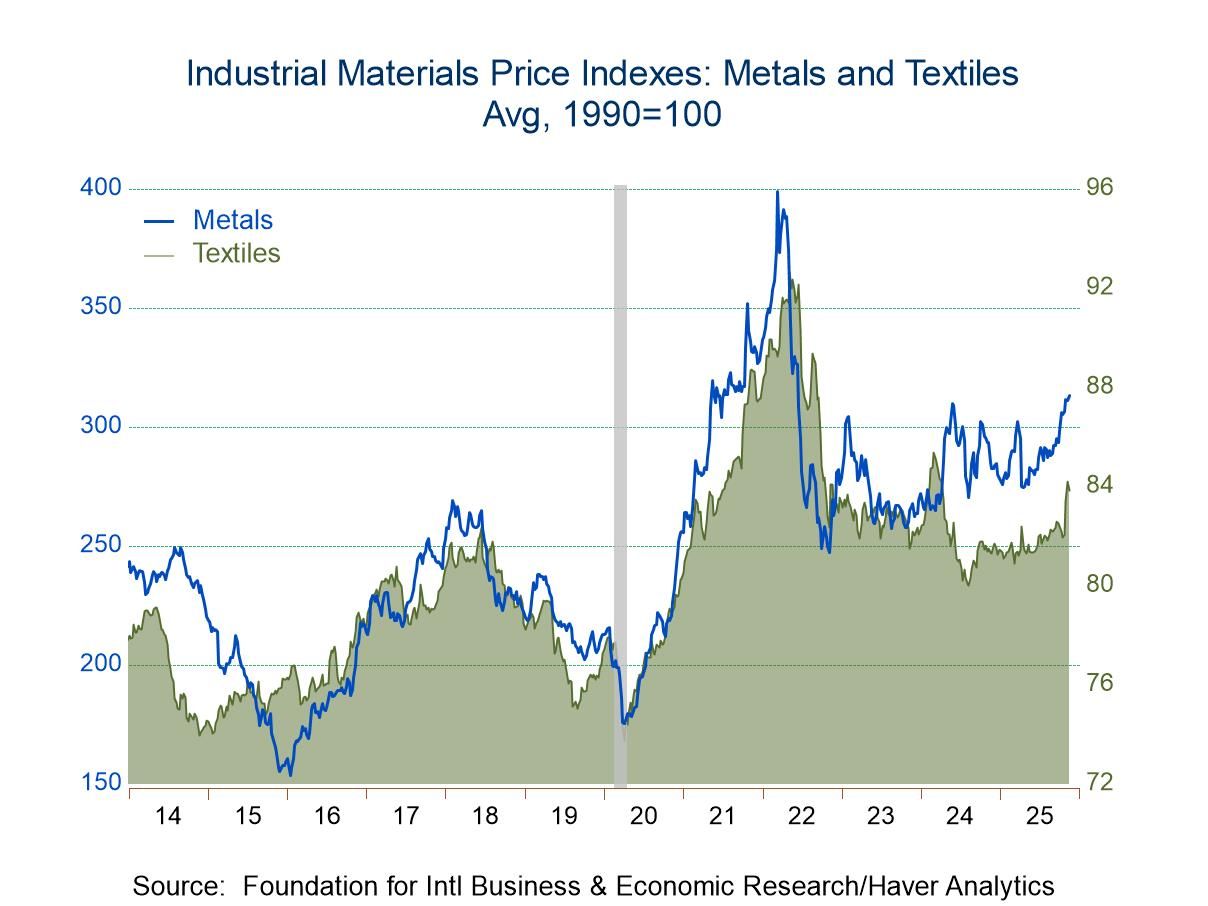
FIBER: Industrial Commodity Prices Increase in Latest Four Weeks
- Textile and metals prices continue to strengthen.
- Crude oil prices increase.
- Framing lumber costs decline again.
by:Tom Moeller
|in:Economy in Brief
 Europe| Nov 14 2025
EMU GDP Ticks High a Bit Faster
The European Monetary Union released an uneventful GDP report with GDP rising by 0.2% quarter-to-quarter in 2025 Q3 compared to an increase of 0.1% quarter-to-quarter in the second quarter of 2015.
At an annual rate, overall GDP rises at a 0.9% pace in the third quarter, up from 0.5% in the second quarter; that acceleration masks a deceleration in the year-over-year growth as Q3 growth is at 1.4% year-over-year compared to an increase of 1.5% year-over-year in the second quarter.
The table shows eight early-reporting monetary union members and among these eight only two of them show GDP slowing in the third quarter compared to the second quarter on quarter-to-quarter changes. Ireland slows to -0.4% after gaining by 0.9% in the second quarter. Spain’s annual rate in the third quarter falls to 2.6% compared to a 3% pace in the second quarter.
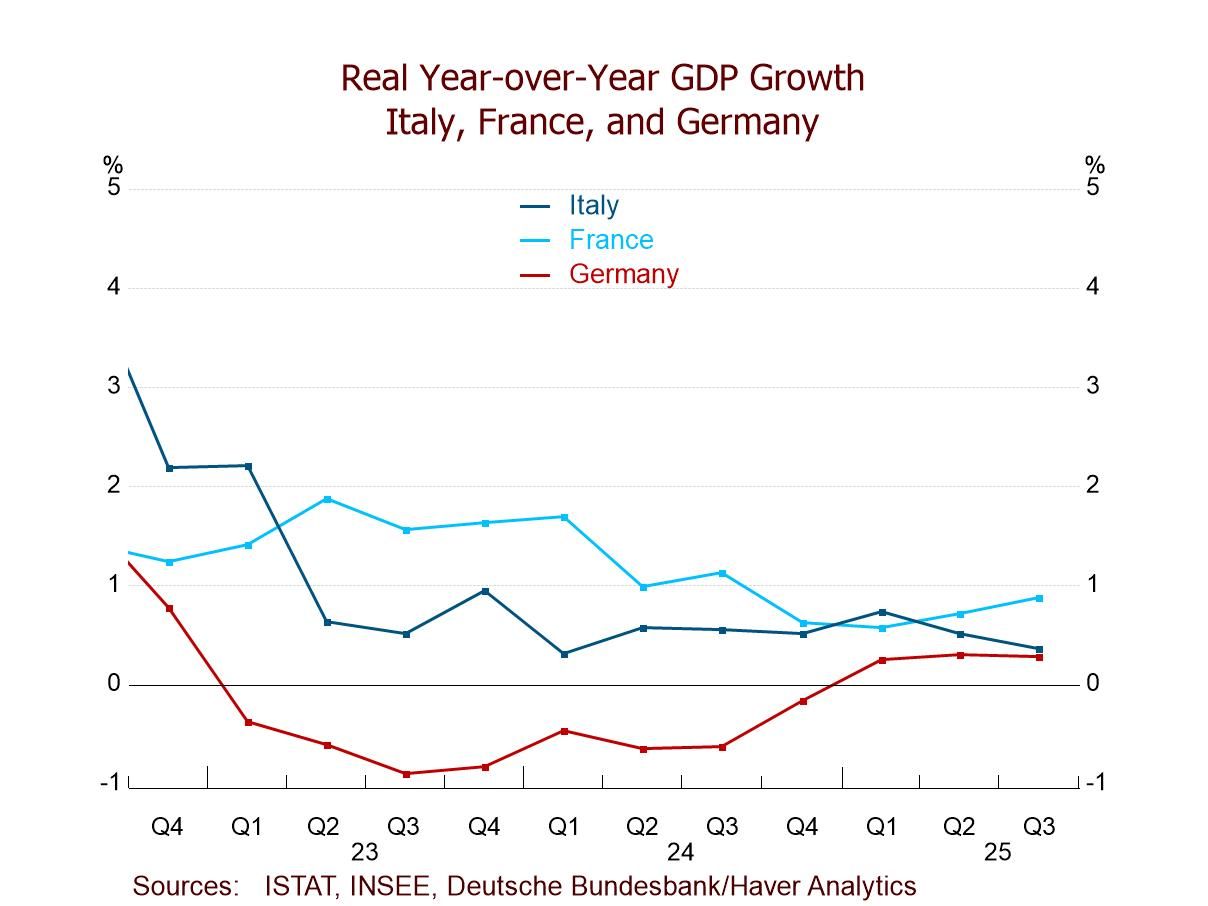
Looking at year-over-year growth rates, there are decelerations that are much more common. In fact, there are accelerations in only three of the countries: Belgium, France, and Portugal. Belgium’s GDP growth in the third quarter moves up to 1.1% from 1% in the second quarter, growth in France is at 0.9% in the third quarter compared to 0.7% in the second, while Portugal logs an increase of 2.4% compared to 1.8% year-over-year gain in the second quarter.
Looking at growth in terms of the four largest EMU economies versus the rest, large economy growth notched 0.9% in the third quarter in terms of quarter-to-quarter changes compared to 0.4% in the second quarter. Euro area growth for the large economies was unchanged 0.8% in the third quarter; in fact, it has grown by 0.8% year-over-year in the first quarter, second quarter, and third quarter of 2025. The rest of the monetary union shows growth accelerating in the third quarter to 1.1% from 0.7% in the second quarter. However, the year-over-year growth rate for the rest of the monetary union drops down to 2.8% in the third quarter from 3.4% in the second quarter and that compares to 3.8% in the first quarter.
The median growth rate, which is the growth rate among these eight countries and is unweighted, rises to 1.4% in the third quarter from 1% in the second quarter while the year-over-year growth rate has a median of 1.1% compared to 1.3% in the second quarter.
The quarter-to-quarter growth rates favor slightly the smaller countries in terms of the growth rate being logged although both large and small countries show a stepup in growth from the second quarter to the third quarter. Year-over-year growth rates also show much stronger growth in the rest of the monetary union compared to the four largest EMU economies on a consistent basis in fact for each of the four quarterly year-over-year growth rates in the table.
The rankings of growth give us some idea why we face these statistics, since three of the four largest monetary union economies log growth rates that are below their respective median growth rates since the late 1990s. Only three countries have growth rates above their medians on this timeline; those are Ireland, Portugal, and Spain. Germany, the largest monetary union economy, has a 30.4 percentile ranking for its year-on-year growth rate, France has a 28.3 percentile ranking, and Italy has a 35.9 percentile ranking.
The numbers posted today are in line with preliminary results and what markets had expected. Growth in the euro area continues to be positive and to move ahead. The signs in this report are that there's more progress than regress quarter-to-quarter although the progress remains slow, it's also relatively broad. This is a positive report but not a glowing report.
 Global| Nov 13 2025
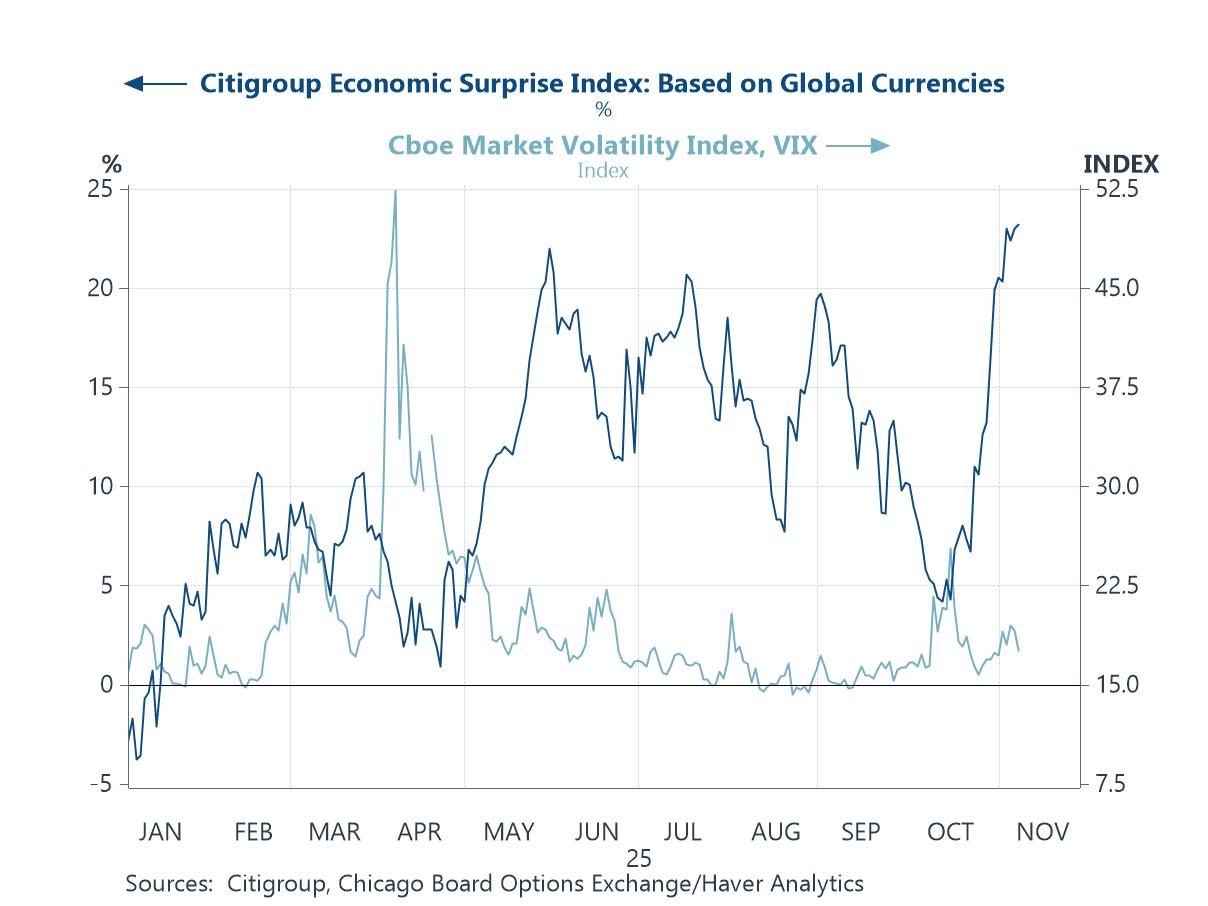
Charts of the Week: The Year in Review
The global economic story of 2025 has been one of resilience amid disruption. Despite a succession of shocks — from a renewed U.S.–China trade confrontation and elevated geopolitical risks, to a sharp rise in fiscal activism and the energy-intensive AI investment boom — the world economy has held up better than many feared. Activity data have consistently surprised on the upside, supporting buoyant equity markets and keeping volatility contained. Meanwhile, inflation has continued to ease and central banks have cautiously shifted toward easier policy, even as large government deficits have kept longer-term real yields elevated. At the same time, US tariff policies have re-emerged as a defining force in global trade, with steep new duties on Chinese, Canadian, and Mexican goods disrupting supply chains and prompting renewed fragmentation in world commerce. These measures have cooled bilateral trade flows and added another layer of uncertainty to an already unsettled policy environment. Yet uncertainty itself remains the dominant feature of 2025 — geopolitical tension, technological exuberance, and diverging fiscal and monetary paths have left investors navigating a world where optimism and fragility coexist.
by:Andrew Cates
|in:Economy in Brief
 USA| Nov 13 2025
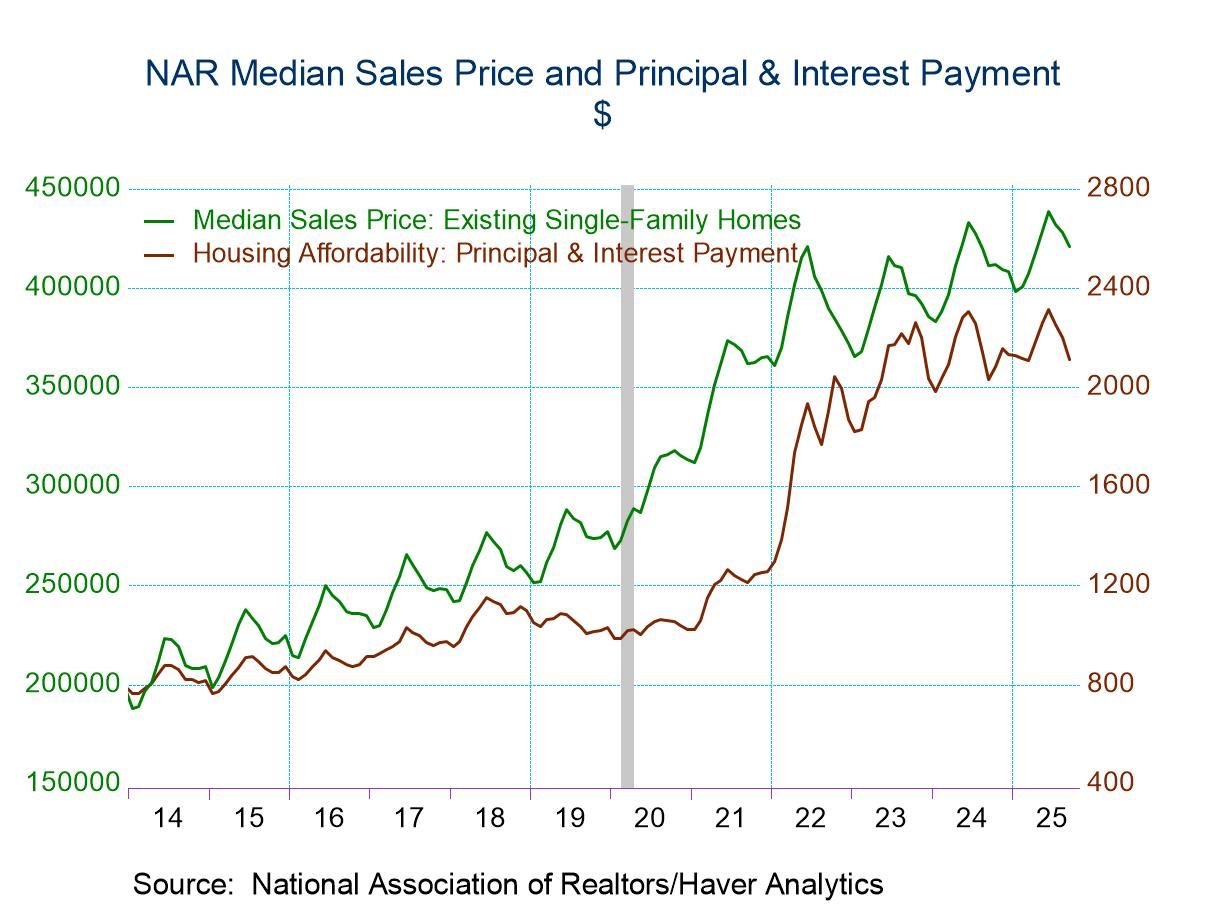
U.S. Housing Affordability Increases in September
- Home prices & mortgage rates continue to decline.
- Median income edges lower.
- Affordability increases across country.
by:Tom Moeller
|in:Economy in Brief
- of103Go to 11 page