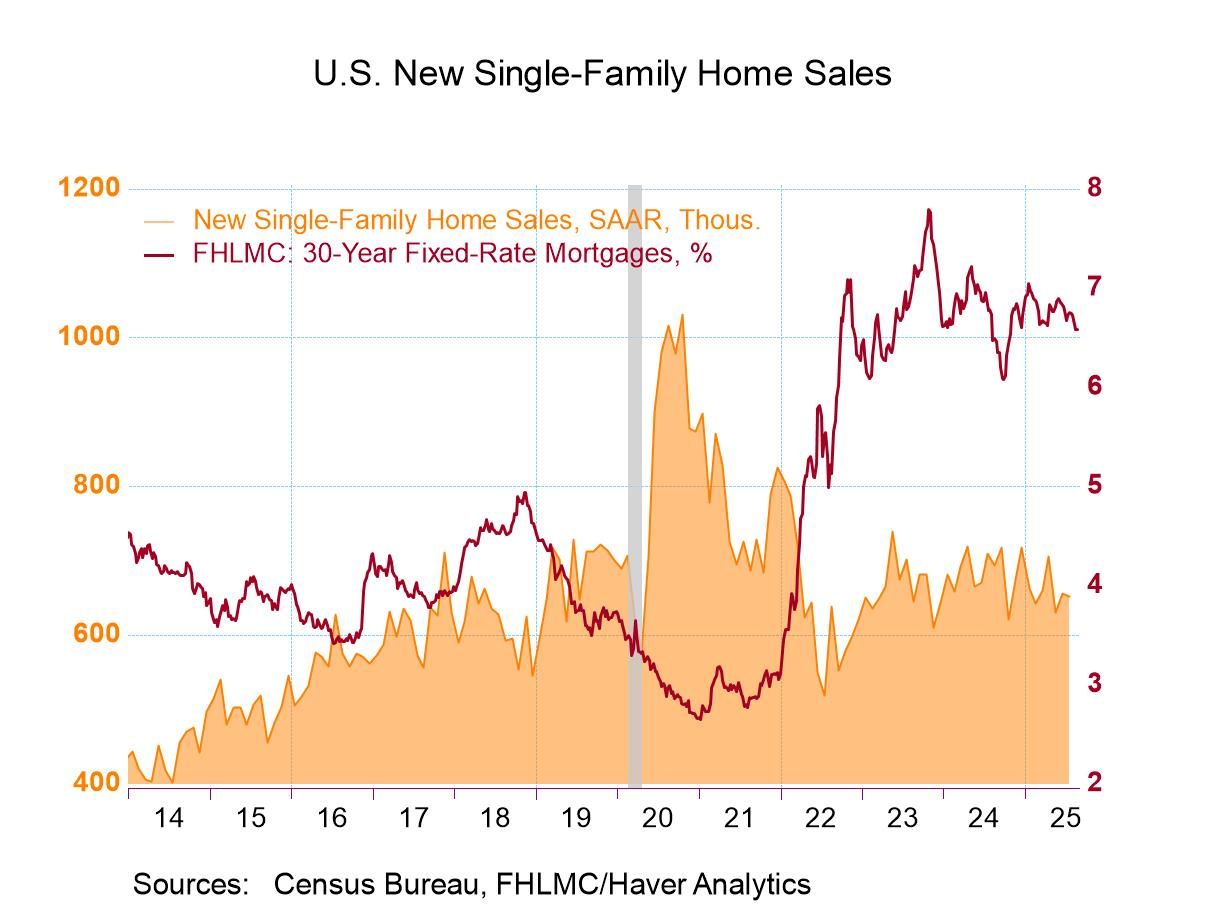
- Small decline in sales follows sharp increase.
- Sales are mixed throughout the country.
- Median sales price declines for second straight month.
 USA| Aug 25 2025
U.S. New Home Sales & Prices Ease in July
by:Tom Moeller
|in:Economy in Brief
 USA| Aug 25 2025
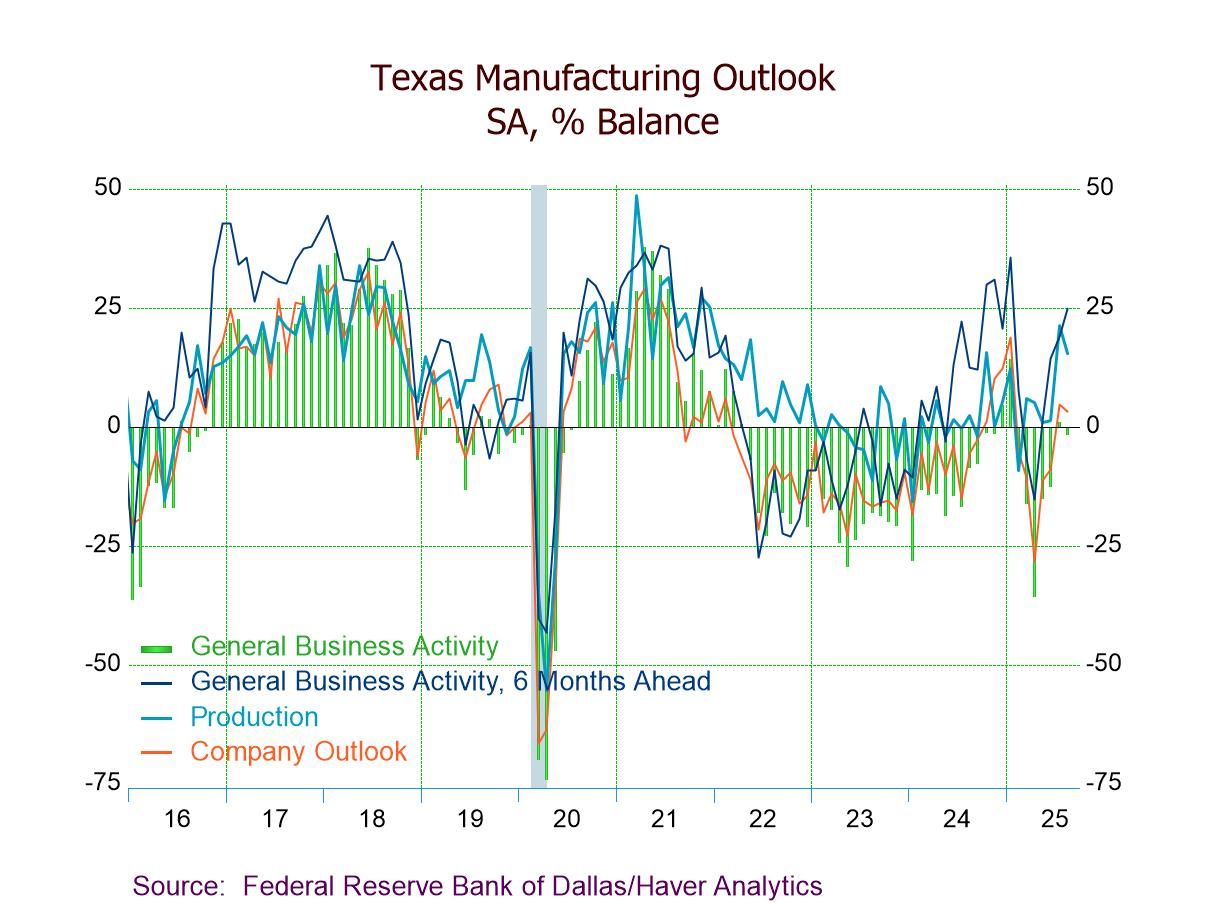
Texas General Business Activity Turns Slightly Negative in August, But Expectations Remain Positive
- General business activity -1.8 in Aug. vs. +0.9 in July.
- Company outlook (3.3) positive for the second straight mth.; production (15.3) still above historical avg.
- New orders growth (2.6) and new orders (5.8) up; both positive for the first time since Jan.
- Employment (8.8) rises, the fourth consecutive expansion and the highest since Sept. ’23.
- Prices received index up 4 pts. to 15.1; prices paid index up to a 4-month-high 43.7.
- Future general business activity up to 24.8, the highest since Jan.
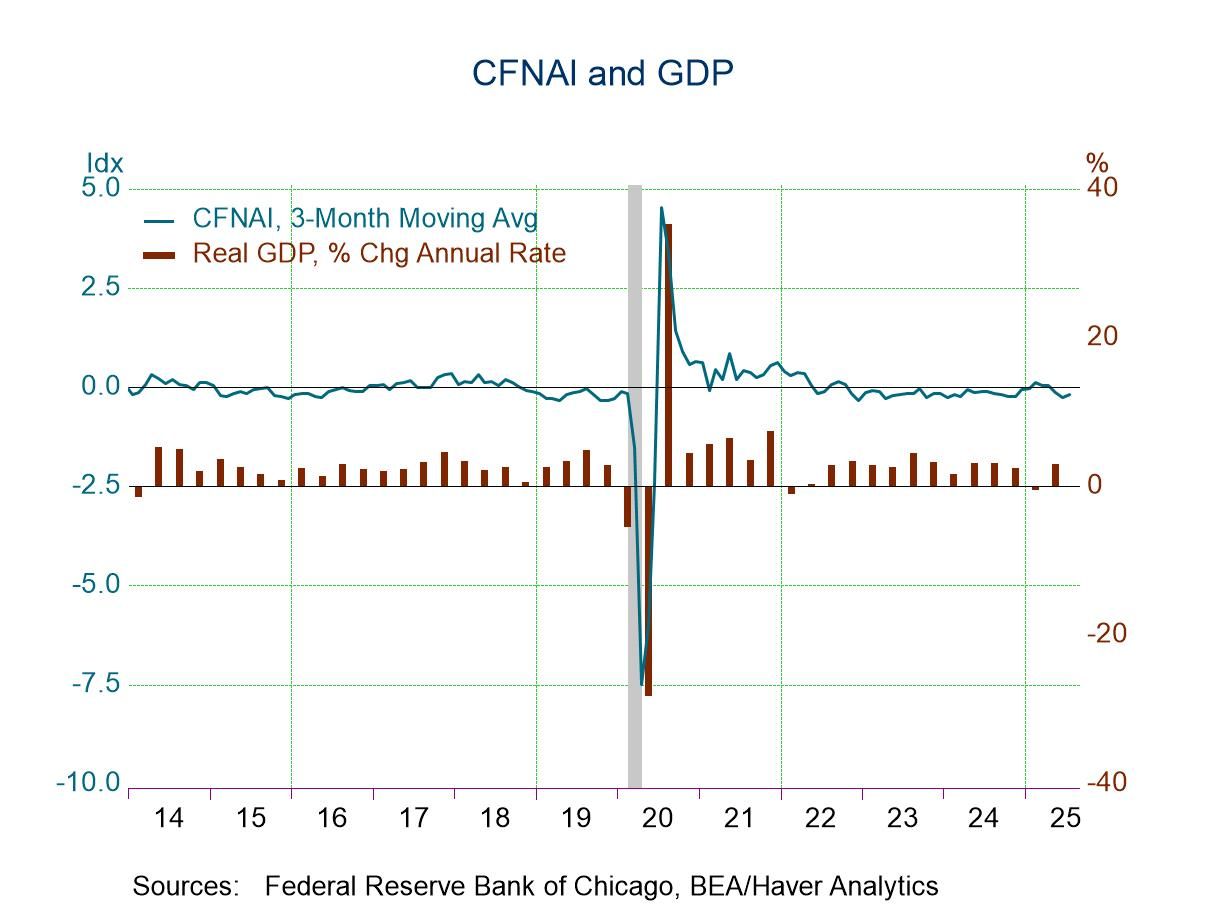
- Three of four components make negative contributions.
- Production & employment lead downturn.
- Three-month trend improves.
by:Tom Moeller
|in:Economy in Brief
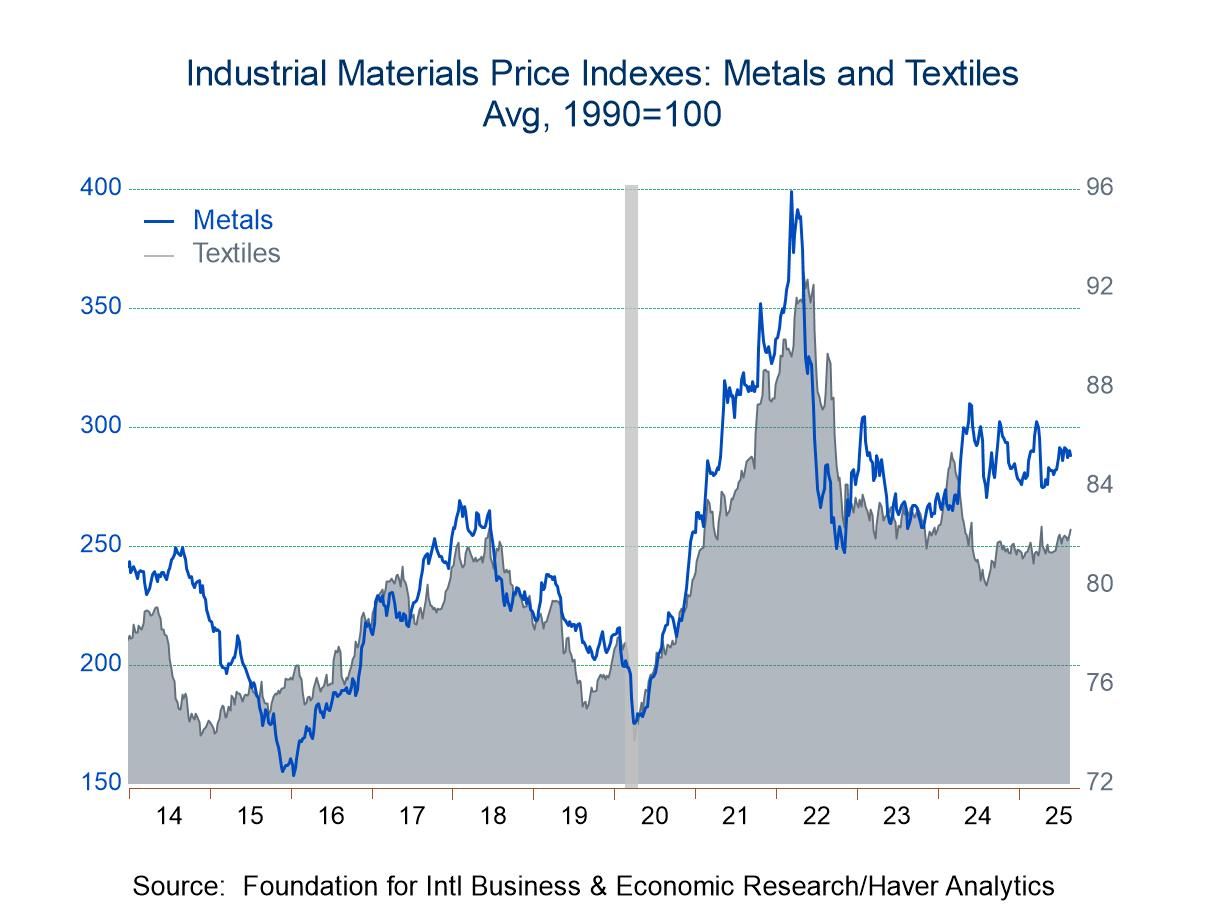
- Decline reverses earlier strength.
- Crude oil costs lead the weakening.
- Lumber & metals prices follow, but textile costs rise.
by:Tom Moeller
|in:Economy in Brief
 Global| Aug 21 2025
Charts of the Week: Cracks Beneath The Shine
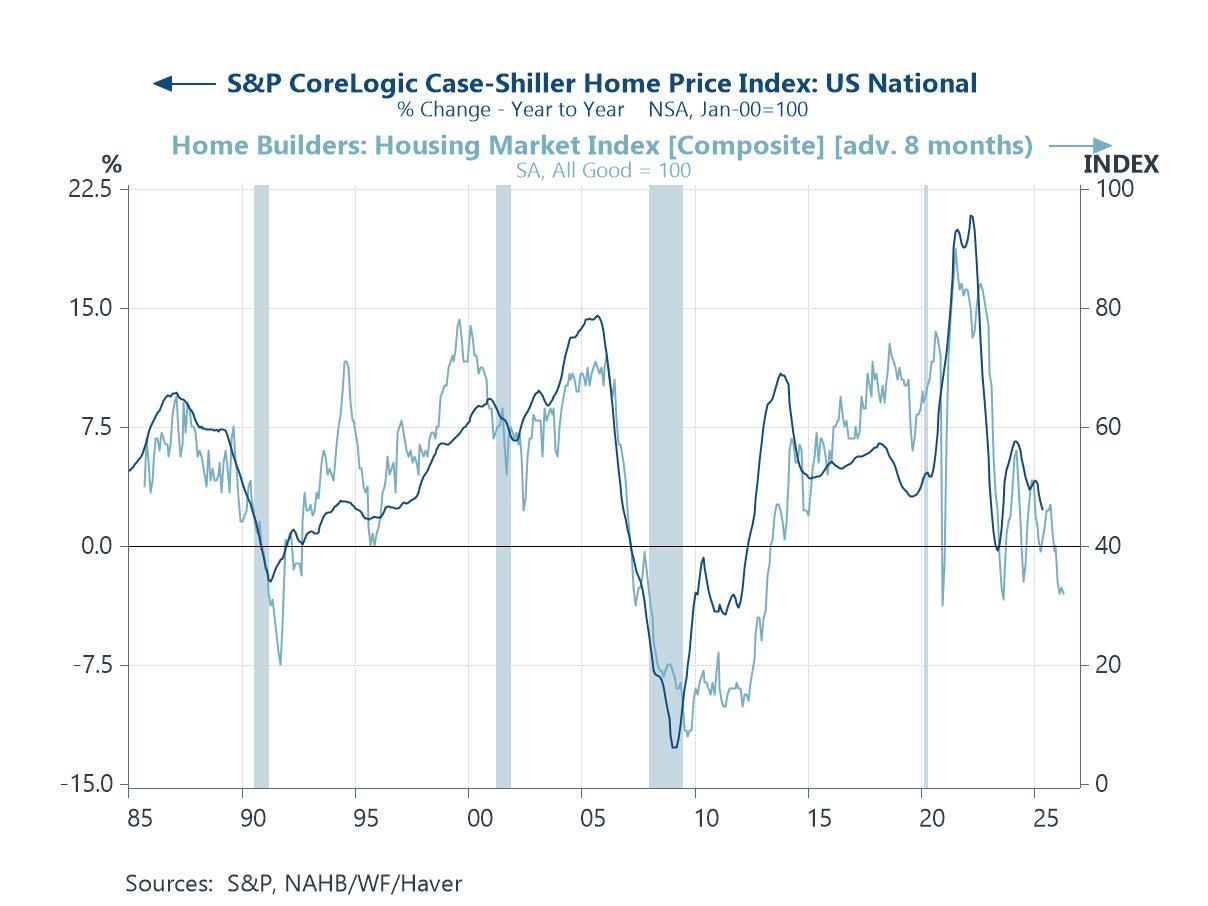
Recent financial market gains have been underpinned by resilient global data, AI-fuelled optimism, and hopes that most central banks will continue to loosen monetary policy. Yet beneath the surface, a more complicated picture may be emerging. In the US, housing indicators are flashing warnings about household balance sheets and credit channels (chart 1), while China’s latest data—covering retail sales, industrial output, and property—underscore persistent weakness (chart 2). In the UK, this week’s data showing sticky services inflation is complicating the Bank of England’s easing path (chat 3), while back in the US, medium-term inflation expectations have been rising despite softer oil prices (chart 4), hinting at a more disruptive role for trade policy. Against this cyclical backdrop sit deeper structural challenges: global energy consumption remains overwhelmingly dependent on fossil fuels, the clean energy sector has lost momentum amid high costs and policy uncertainty, and equity markets have punished renewables even as climate imperatives intensify (charts 5 and 6). Together, these dynamics suggest that while markets continue to trade on optimism, the mix of weak housing signals, patchy Chinese demand, sticky inflation, and an uneven energy transition potentially leaves the global outlook more fragile than headline performance implies.
by:Andrew Cates
|in:Economy in Brief
- Home sales remain below recent high in December.
- Sales are slightly higher m/m in most of country.
- Median sales price slips from record high.
by:Tom Moeller
|in:Economy in Brief
 USA| Aug 21 2025
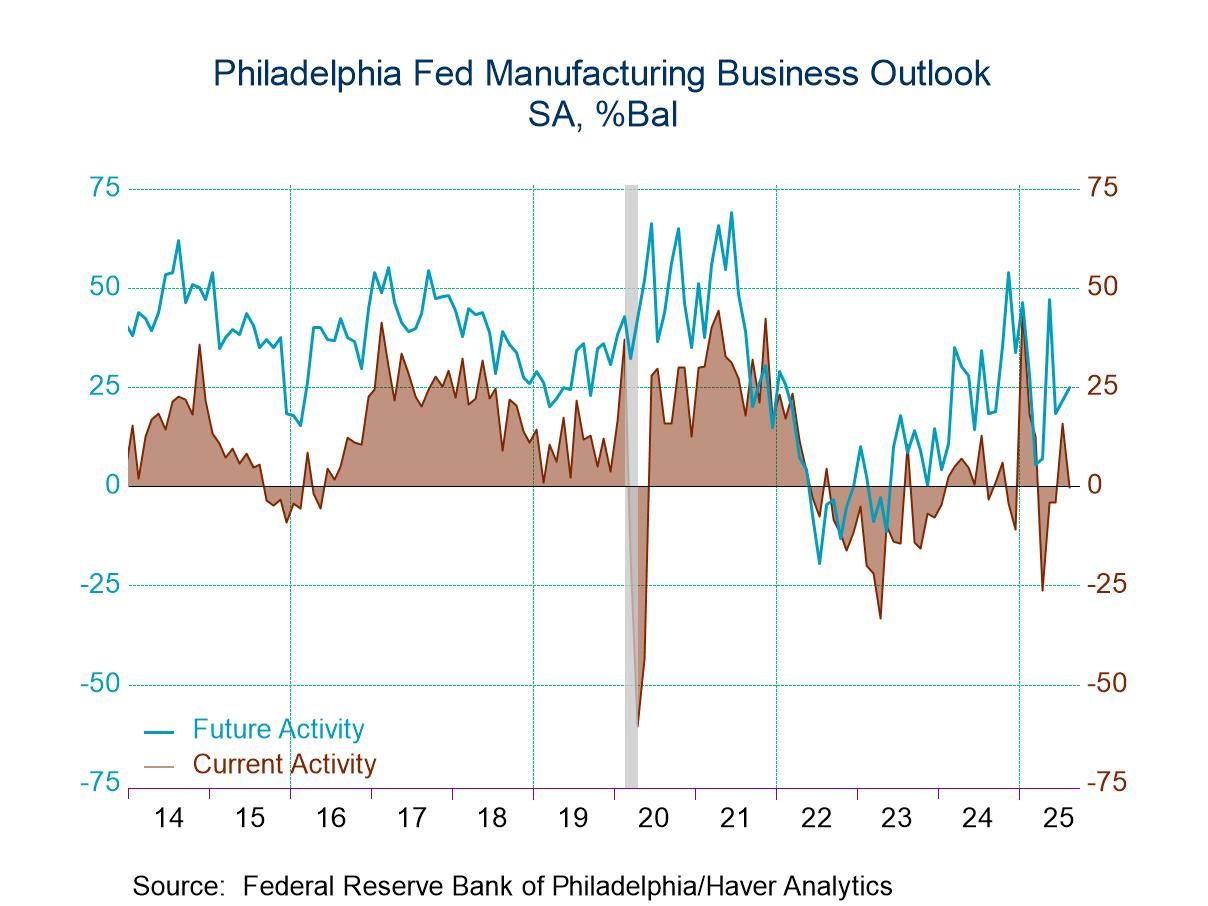
U.S. Philly Fed Manufacturing Index Dipped Below Zero in August
- The headline index fell more than 16 points to -0.3, led by outsized declines in both new orders and shipments.
- The ISM-adjusted composite fell below the critical 50 level for the first time in four months, also pointing to a decline in activity.
- Delivery times shortened further while both prices paid and prices received indexes posted gains.
by:Sandy Batten
|in:Economy in Brief
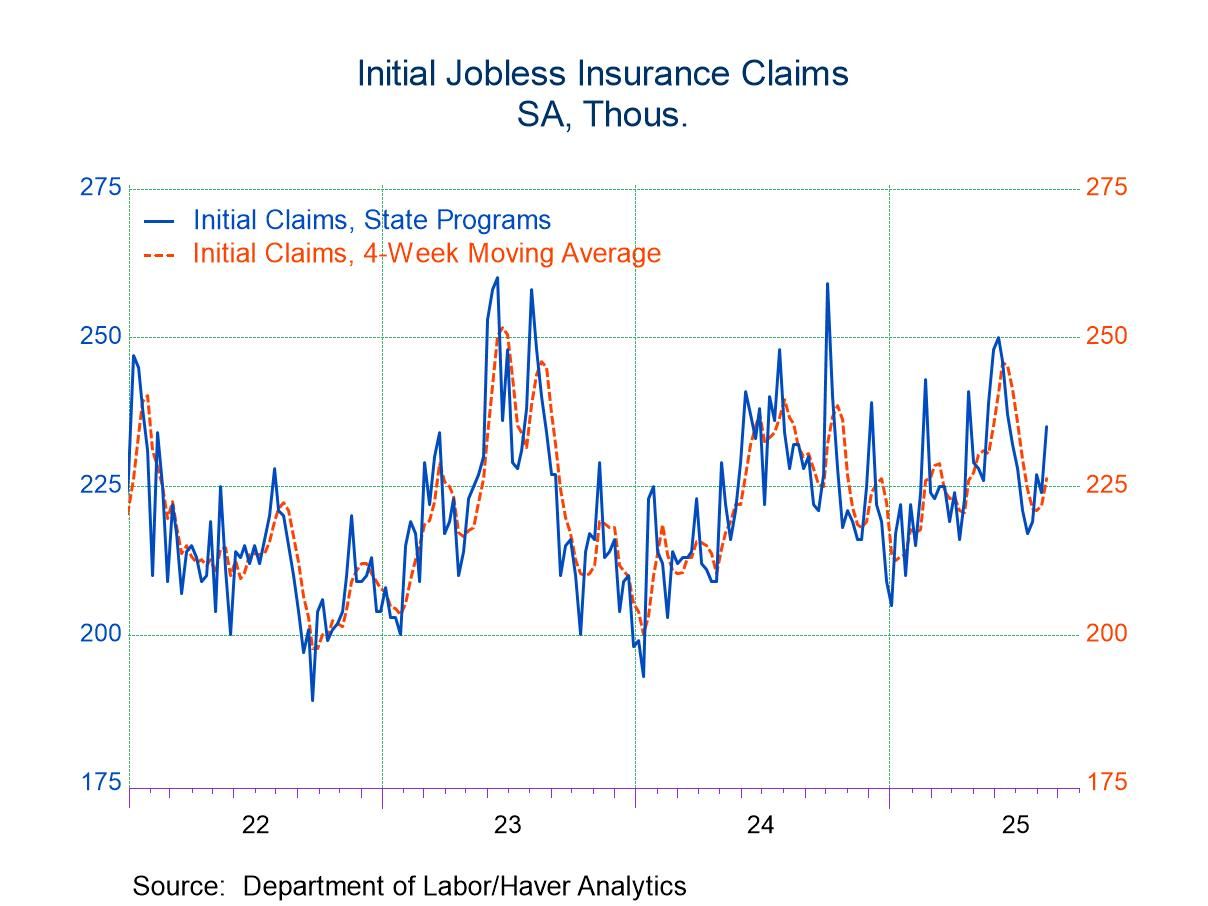
- Initial claims surge to highest level in eight weeks.
- Continuing claims extend upward trend.
- Insured unemployment rate holds steady.
by:Tom Moeller
|in:Economy in Brief
- of2725Go to 74 page