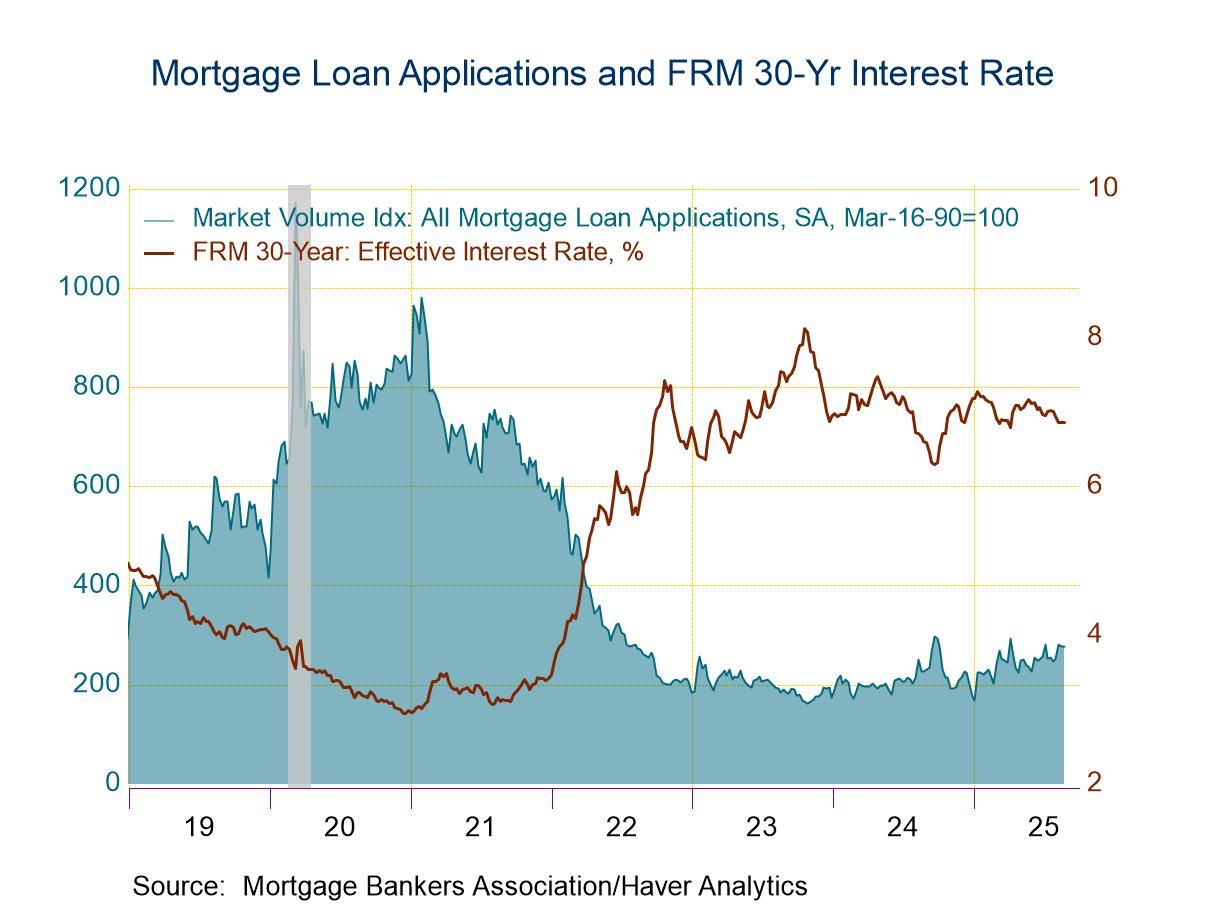
- Purchase applications increase while loan refinancing eases.
- Fixed-interest rate on 30-year loan holds at four-month low.
- Average loan size declines again.
by:Tom Moeller
|in:Economy in Brief
 Germany| Aug 27 2025
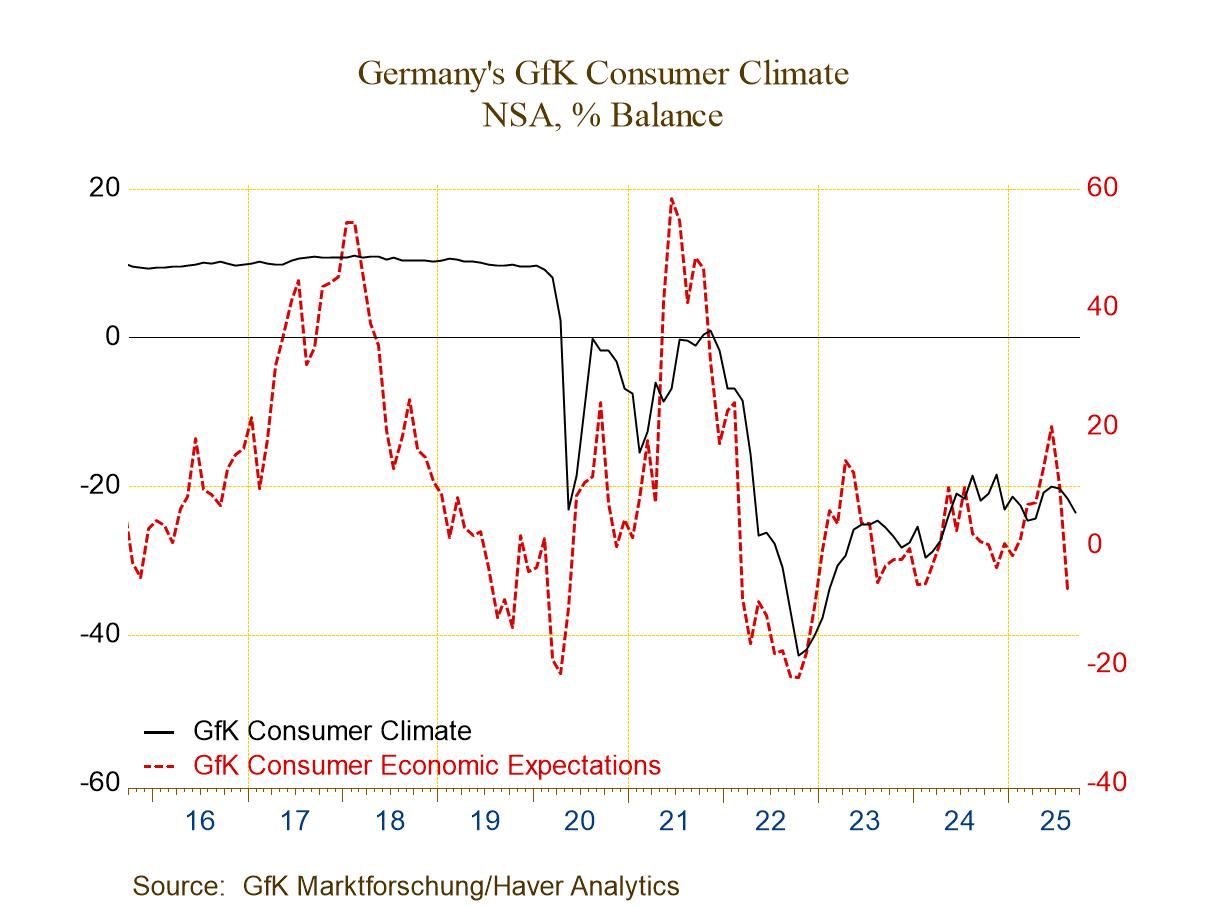
German Climate Stabilizes But Eco-expectations Plunge
The GfK consumer climate indicator for Germany slipped in September to -23.6 from -21.7 in August. The slippage brings the index to its weakest level since April 2025 and in fact it's the weakest reading since May 2024 with only two-monthly exceptions.
The components for the GfK index are up to date through August. The economic index in August fell to -7.4, its weakest reading since December 2022. The decline in August was both sharp and deep. Income expectations backed-off; after a reading of 15.2 in July, the index fell to 4.1 in August and was last weaker in March 2025. The propensity to buy index weakened again for the second month in a row to -10.1 in August from -9.2 in July; it's the weakest reading since February 2025.
Percentile standings The percentile standing for the climate index and its components show climate is still very weak at a 9.7 percentile standing among data back to mid-2002. Economic expectations have a 23.7 percentile standing, the propensity to buy has a 28.8 percentile standing, while income expectations have a 38.8 percentile standing. These count percentiles or queue percentiles however you like to think of them, are all quite weak. The median in terms of this sort of gauge occurs at the 50th percentile reading, so all of these readings are well below their historic medians and data back to mid-2002.
Consumer confidence – selected other Europe Other European confidence measures are up to date through August in France where the INSEE confidence measure slipped to 87 from 88.3 while in the United Kingdom the confidence measure improved to -17 in August from -19 in July. Italy's confidence reading is up to date only through July, and on that timeline, it showed a one-month improvement to 97.2, up from June’s 96.1. Italian confidence has the strongest standing at a 76.8 percentile standing, the U.K. has a 40.3 percentile standing, while France has a 19.8 percentile standing. There's a good deal of variation in how consumers perceive current circumstances. Based on these standings, Germany has the lowest assessment in the its lower 10 percentile, while Italy sees a top 25 percentile standing, the U.K. sees an assessment that's about 10 percentile points below its median, while France is at its 20th percentile closer to the German metric in standing. It's a substantial variation especially since three of these countries are in the European Monetary Union.
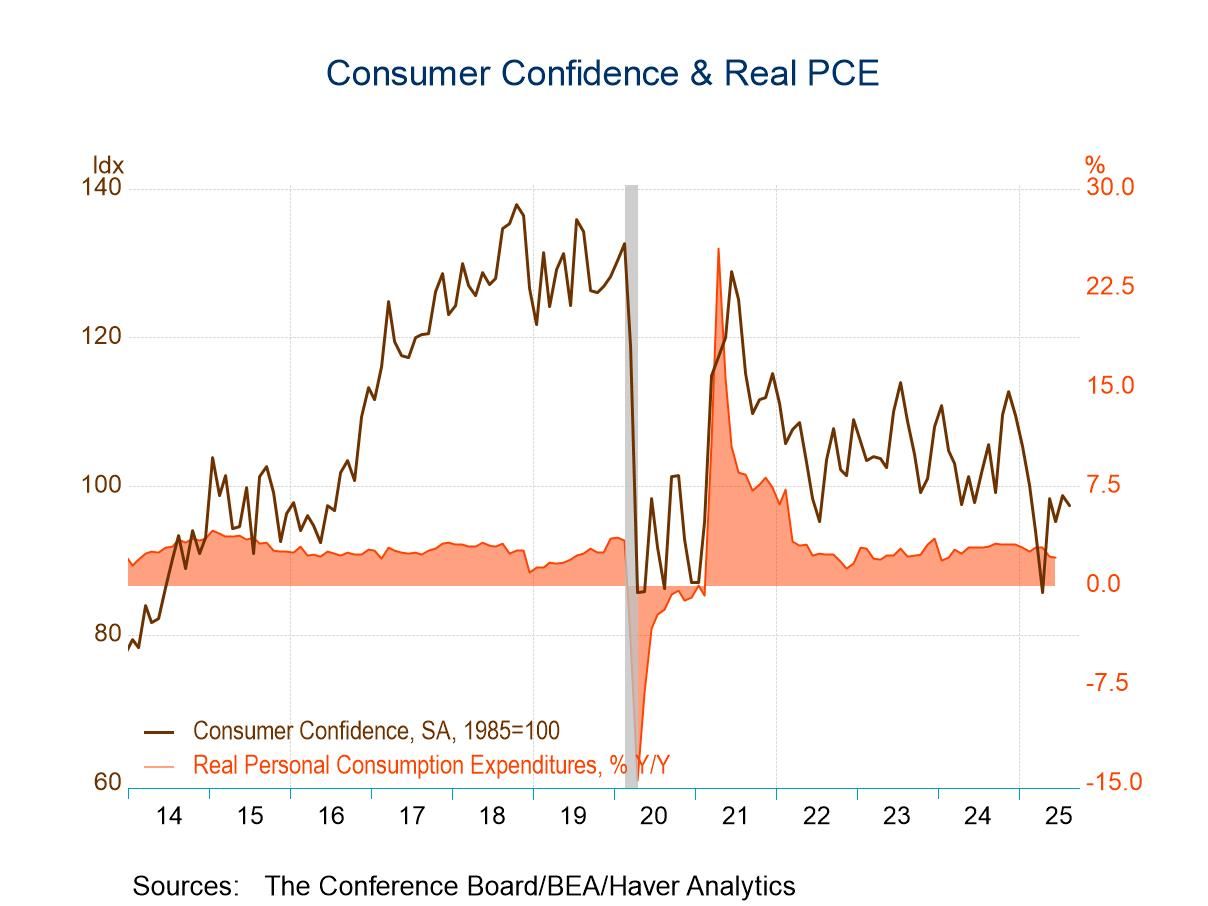
- Monthly decline is slight, level remains up sharply from April low.
- Expectations and present situation readings decline.
- Inflation expectations rise after falling for two months.
by:Tom Moeller
|in:Economy in Brief
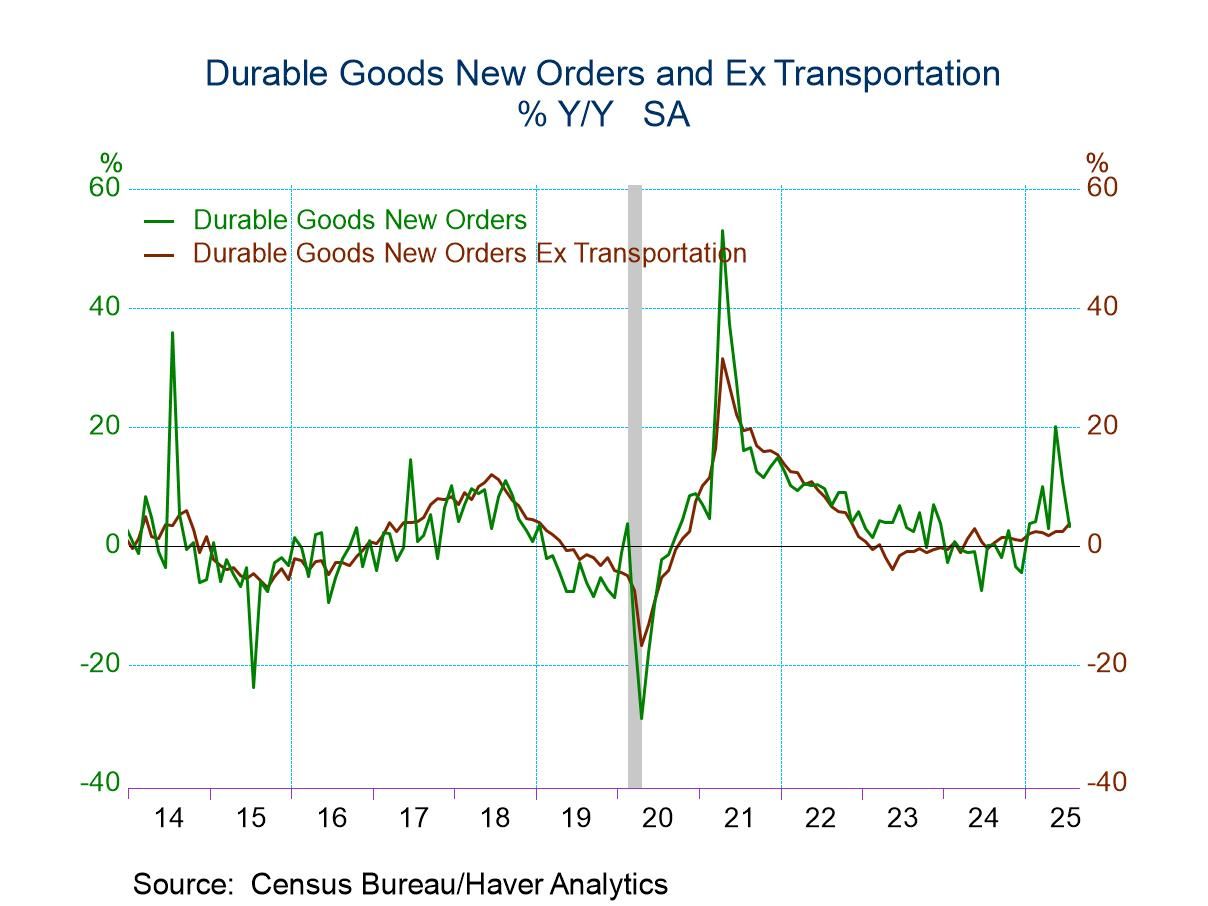
- Durable goods orders fell 2.8% m/m in July on top of a 9.4% monthly drop in June.
- Once again, weak nondefense aircraft orders were the key factor; nondefense aircraft orders plunged 33% m/m in July on top of a 53% m/m decline in June.
- In contrast, orders excluding transportation rose a solid 1.1% m/m in July, their largest monthly gain since September 2024.
- Core capital goods orders rebounded, and shipments posted a solid gain.
by:Sandy Batten
|in:Economy in Brief
 USA| Aug 26 2025
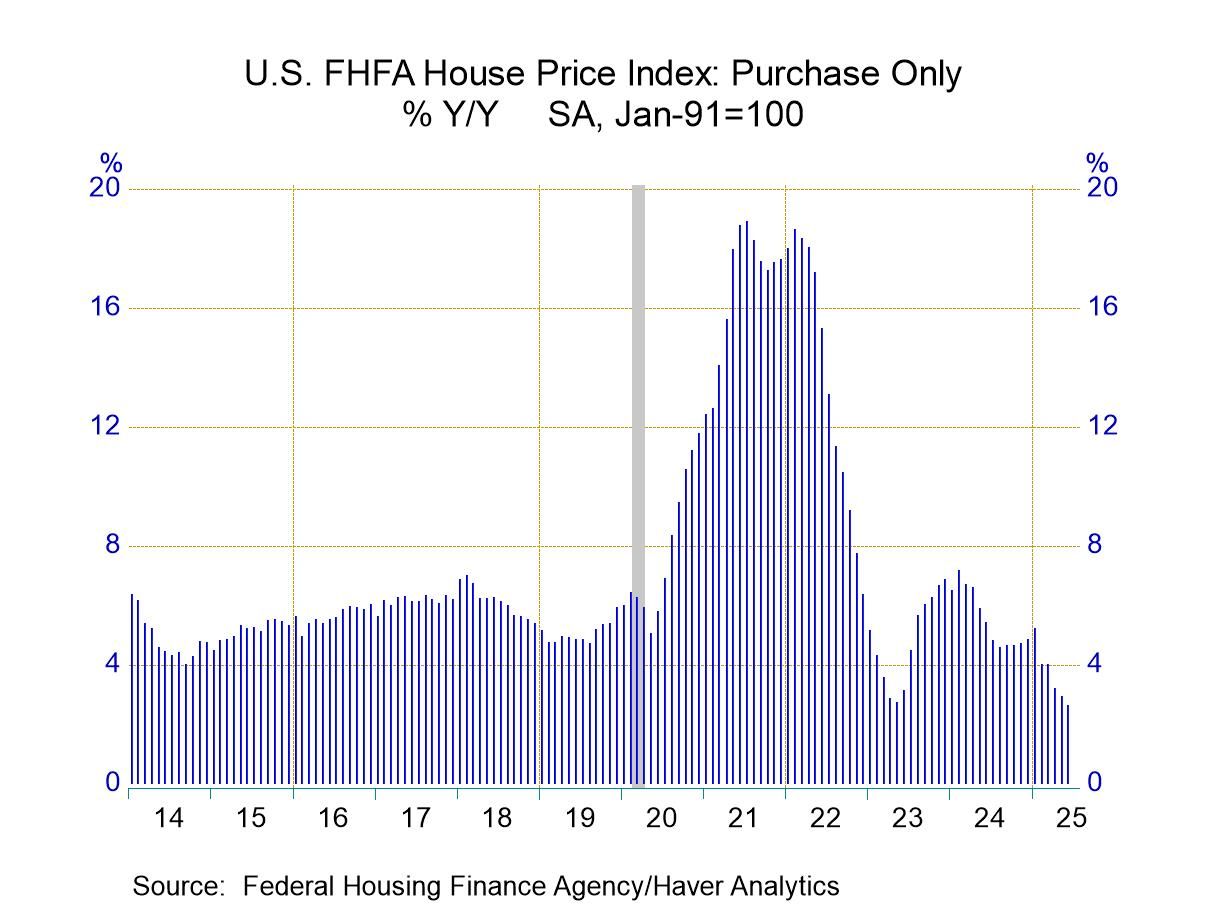
U.S. FHFA House Prices Continue to Decline in June
- Prices edge lower for third straight month.
- Annual increase is near two-year low.
- Price changes are uneven amongst regions.
by:Tom Moeller
|in:Economy in Brief
 USA| Aug 26 2025
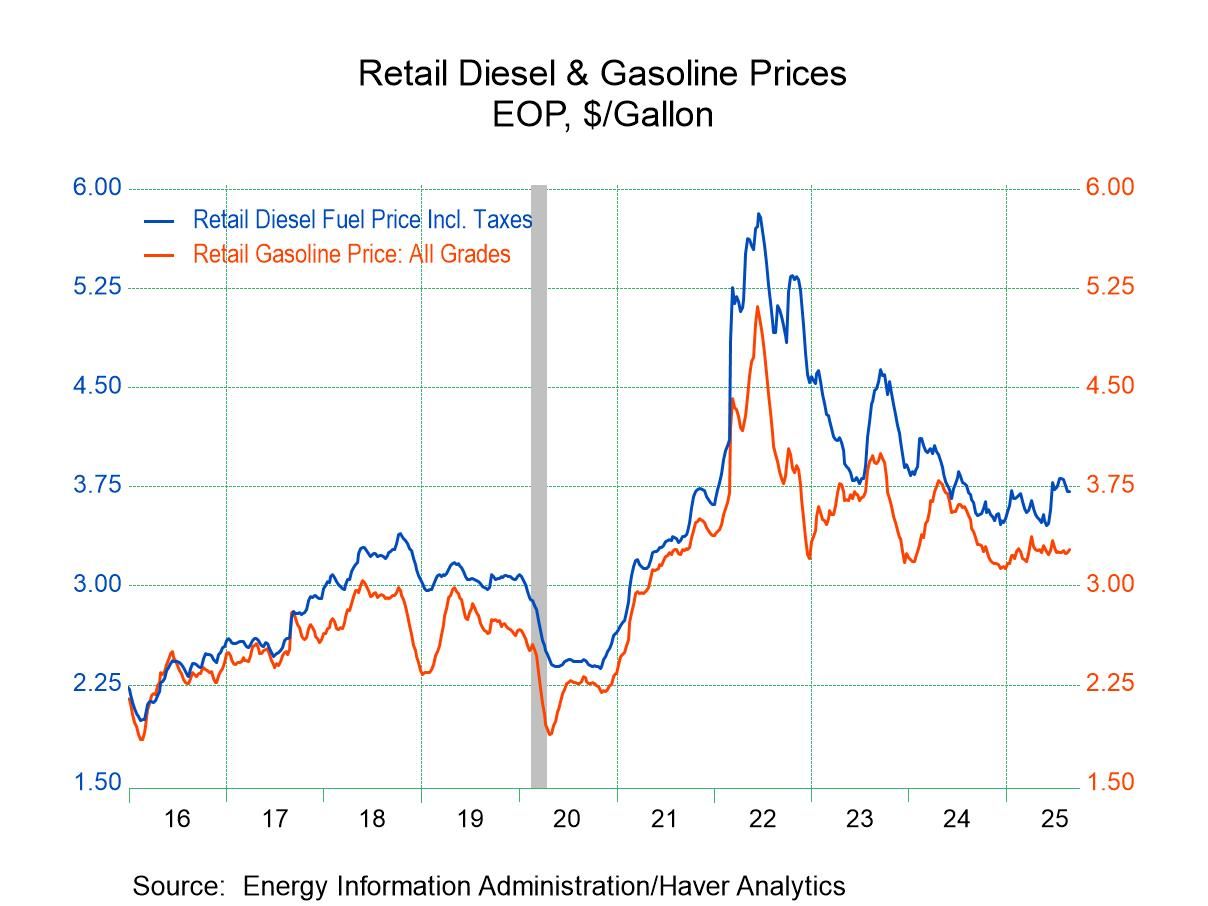
U.S. Energy Prices Are Mixed in Latest Week
- Gasoline prices rise.
- Crude oil prices ease.
- Natural gas prices decline.
by:Tom Moeller
|in:Economy in Brief
 France| Aug 26 2025
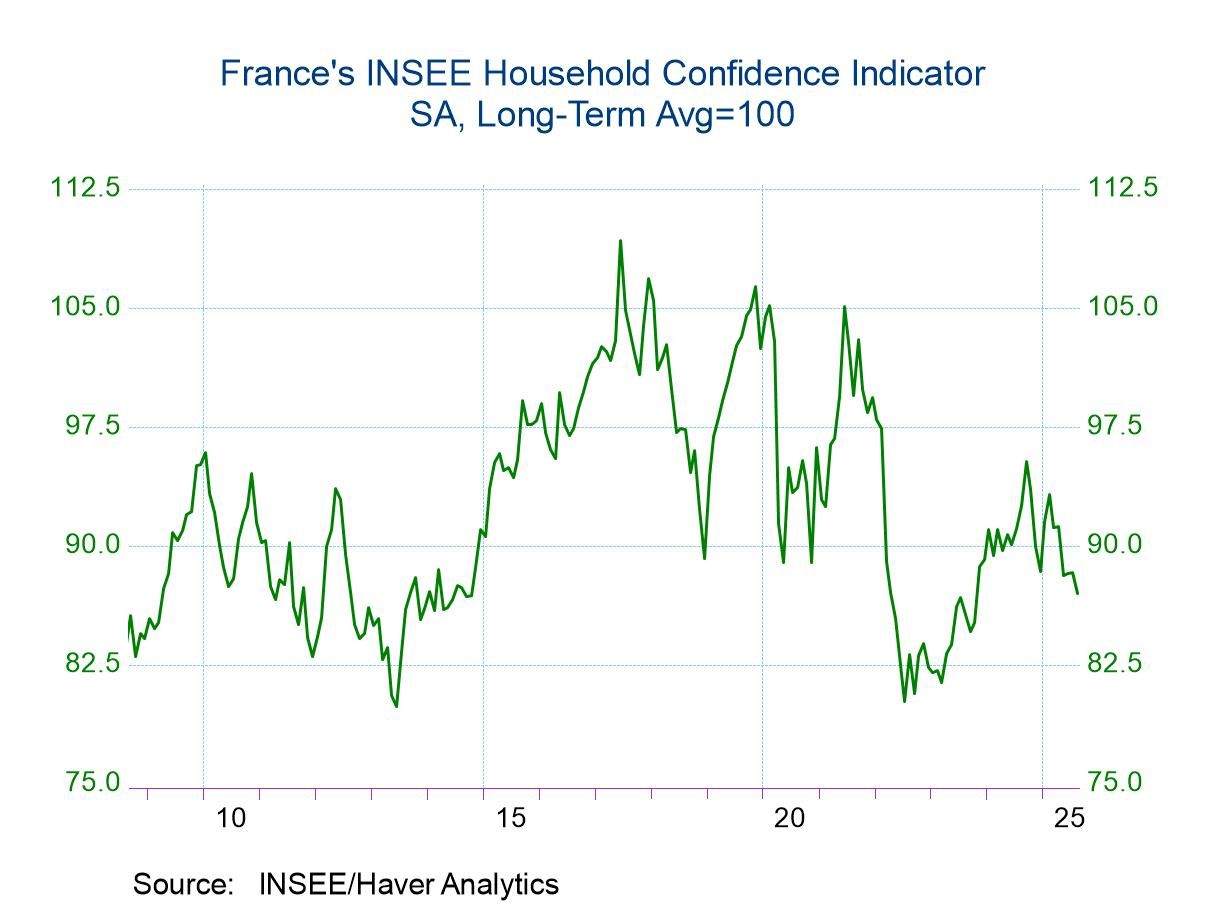
French Consumer Confidence Weakens
Low confidence French consumer confidence as reported by INSEE fell to 86.98 in August from 88.31 in July; the standing leaves that reading in its 21.7 percentile of data back to August 2004. This reading, which hovers between the lower 20th percentile and the 25th percentile, clearly indicates weak conditions and assessments on the part of French consumers.
Living standards past and future are poor The assessment of living standards over the last 12 months weakened in August to -74.2 from an assessment of -70.8 in July. Past living standards have a percentile standing in their 17.8 percentile placing them in the lower 20th percent of their historic queue of data.
Living standards for the next 12 months, a more pertinent reading, slipped to -63.9 in August from -61.5 in July. While the negative reading isn't as deep as for the past 12 months, the ranking of that rating is even worse in its lower 4-percentile! The expected living standards over the next 12 months have been weaker only 4% of the time back to August 2004. That is certainly a worrisome development.
Unemployment is more feared Unemployment expectations for the next 12 months moved up to an index value 55.6 in August from 54.2 in July and have a 73.5 percentile standing- a top 30% standing among historic data back to August 2004.
Inflation pressures exist and are tepid The assessment of prices for the last 12 months weakened to -8.5 in August from -6.1 in July; the past 12 months’ assessment of prices has 43.9 percentile standing, slightly below its median for this backward-looking horizon. However, assessments of prices for the next 12 months have a -26 rating, a higher reading than -30 in July and -40 in June; that bears a standing in its 52.4 percentile, above its historic median indicating that some further inflation pressure is expected- a bit more than normal.
Favorability to save The favorability to save and the ability to save over the next 12 months had dipped slightly in August, but they have very high standings as the favorability to save has an 88.5 percentile standing and the ability to save over the next 12 months has a 96.8 percentile standing.
Spending environment is still solid The environment for spending is somewhat mixed although generally quite solid and positive. The exception is the favorability to buy a car which slipped slightly in August and has a 39.7 percentile standing for that response which means that it's only less favorable to buy a car about 40% of the time. However, the favorability for home purchases and housing renovation, while both of them increased slightly in August, have standings in their 78.6 percentile and 88.5 percentile, respectively. The favorability to buy consumer durables improved in July and stayed at that reading of -4 in August; the reading corresponds to a 76.2 percentile standing which is roughly a top 25 percentile response.
 Asia| Aug 26 2025
Economic Letter from Asia: A New Normal
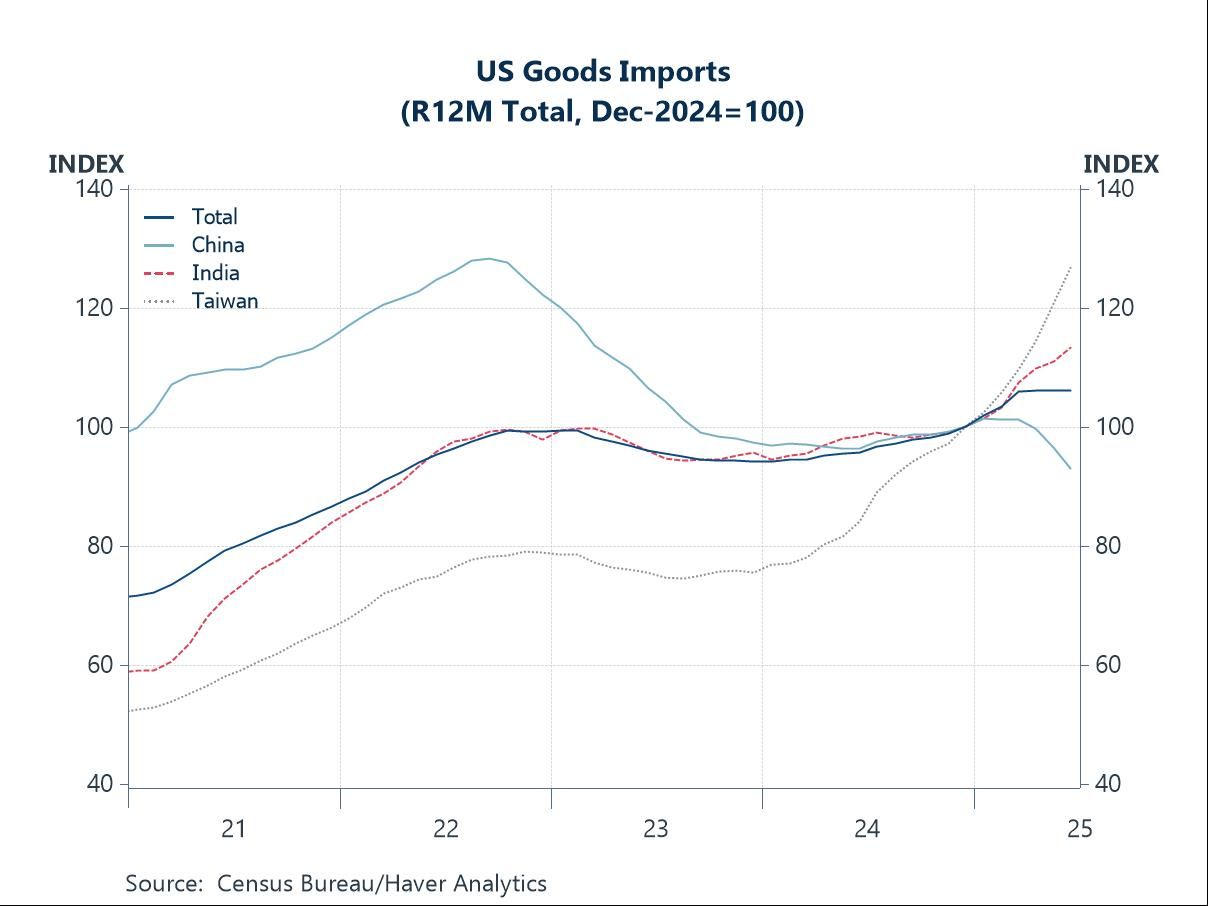
This week, we explore how the new round of US reciprocal tariffs is reshaping global trade patterns. The US import profile is already being reshaped: imports from China have fallen as intended, while higher shipments from other economies, such as India and Taiwan, have broadly offset the decline, keeping overall import levels largely unchanged (chart 1). Coupled with steadily growing exports, this has improved the US trade balance. China, meanwhile, has absorbed the hit from reduced US export revenues by redirecting shipments elsewhere, particularly to its Asian trading partners. Substantial growth has been seen in transportation goods, including EVs, while exports of mineral products have declined (chart 2).
Looking more broadly, the current tumultuous global trade landscape—while having supported Asian growth (chart 3) through front-loading by US importers—now poses significant downside risks for the region, particularly with higher US reciprocal tariffs in effect. At the same time, the combination of these growth risks and cooling inflation has paved the way for further central bank easing across much of Asia. Many central banks have opted to follow the path of least resistance, implementing additional easing so far this year (chart 4), with further moves expected in the coming weeks.
In sector-specific developments with potential global impact, President Trump’s threat to impose up to 300% tariffs on semiconductors could reverberate through Asia, home to most of the world’s semiconductor manufacturing and the primary source of US imports (chart 5). This would also affect American consumers, given how pervasive semiconductors are in everyday products. Another potential flashpoint is rare earths: Trump has threatened a 200% tariff on China if it does not supply sufficient magnets, underscoring China’s dominant position in the sector (chart 6).
The new normal We have entered a new normal, marked by US President Trump’s updated reciprocal tariff rates that took effect earlier this month. Beyond the usual considerations—such as comparative production advantages, shipping costs, and geographic proximity—producers now must also account for varying US tariff rates in their decisions. They must decide whether to onshore production to the US, reshore from abroad, or shift operations to economies facing lower US tariffs. Given how fluid the tariff landscape remains, it is unsurprising that many businesses are cautious about committing to major, long-term investments. Moreover, with Washington increasingly hawkish on alleged “transshipments” designed to circumvent tariffs—particularly from economies like China—producers face added deterrents against simply re-routing trade flows. As shown in Chart 1, this new tariff regime has already reshaped US trade patterns. Imports from China have cooled sharply as the rivalry intensified and mutual tariffs escalated earlier. In contrast, despite persistent uncertainty over future trade actions, US imports from some other Asian economies—such as Taiwan and India—have surged, led by computer and electronic products. Overall, rolling 12-month US import values have stalled this year, while exports have continued to expand, resulting in an improved US trade balance.
- of2725Go to 73 page