

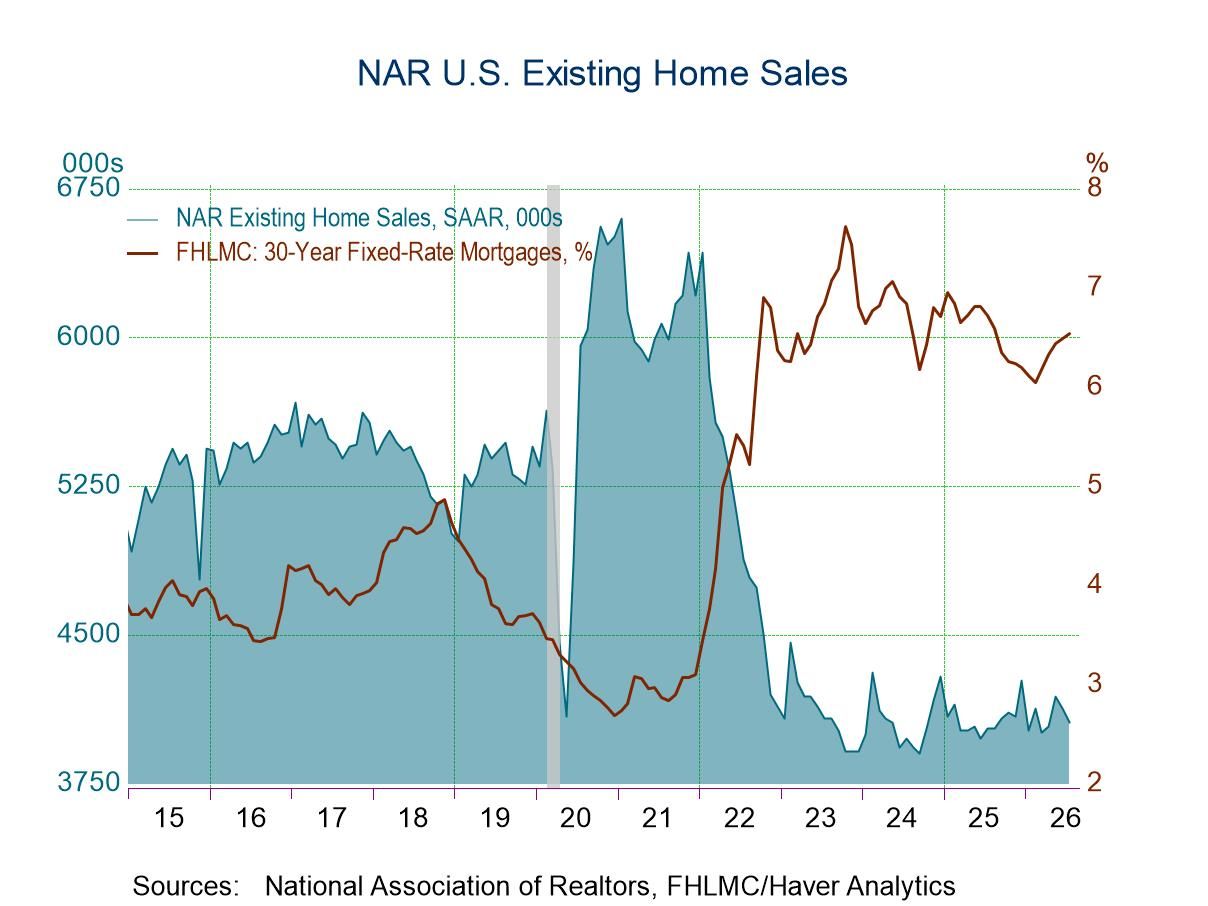
- Total sales fell 1.7% m/m to 4.06 million units at an annual rate in July after a 1.4% monthly decline in June but were up 0.7% from a year ago.
- Monthly sales increased in the Northeast, held steady in the West, and declined in the Midwest and South.
- Year-over-year sales rose in the Midwest and West and were unchanged in the Northeast and South.
- The median sales price fell 2.0% m/m NSA in July but rose 2.0% from a year ago.
 USA| Aug 11 2026
U.S. Existing Home Sales Fell Again in July
by:Sandy Batten
|in:Economy in Brief
- NFIB Small Business Optimism Idx up 2.4 pts. to 99.8 in July, above its 52-year avg. of 98.0.
- Uncertainty Idx up 2 pts. to 91, well above the historical avg. of 68.
- Expectations for economy up 2 pts. to 15%, highest since Feb.
- Expected real sales down 2 pts. to 7% from June’s five-month high.
- Plans to expand business up 4 pts. to 12%, a five-month high.
- Hiring plans up 9 pts. to 20%, highest since Oct. ’22.
- Firms raising avg. selling prices down 7 pts. to 31%, a three-month low.
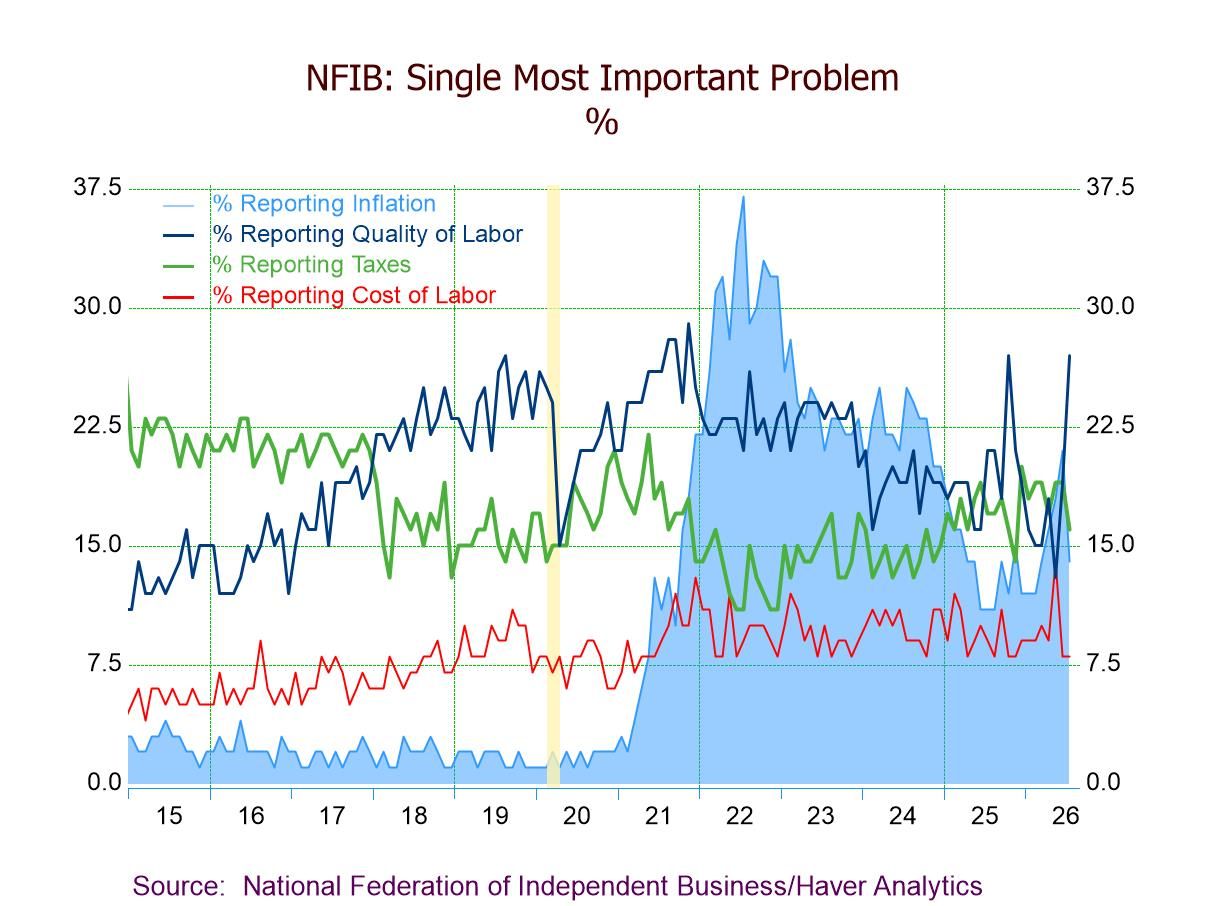
- Top three business concerns: labor quality (27%), taxes (16%), and inflation (14%).
 Netherlands| Aug 11 2026
Dutch Inflation Picks Up
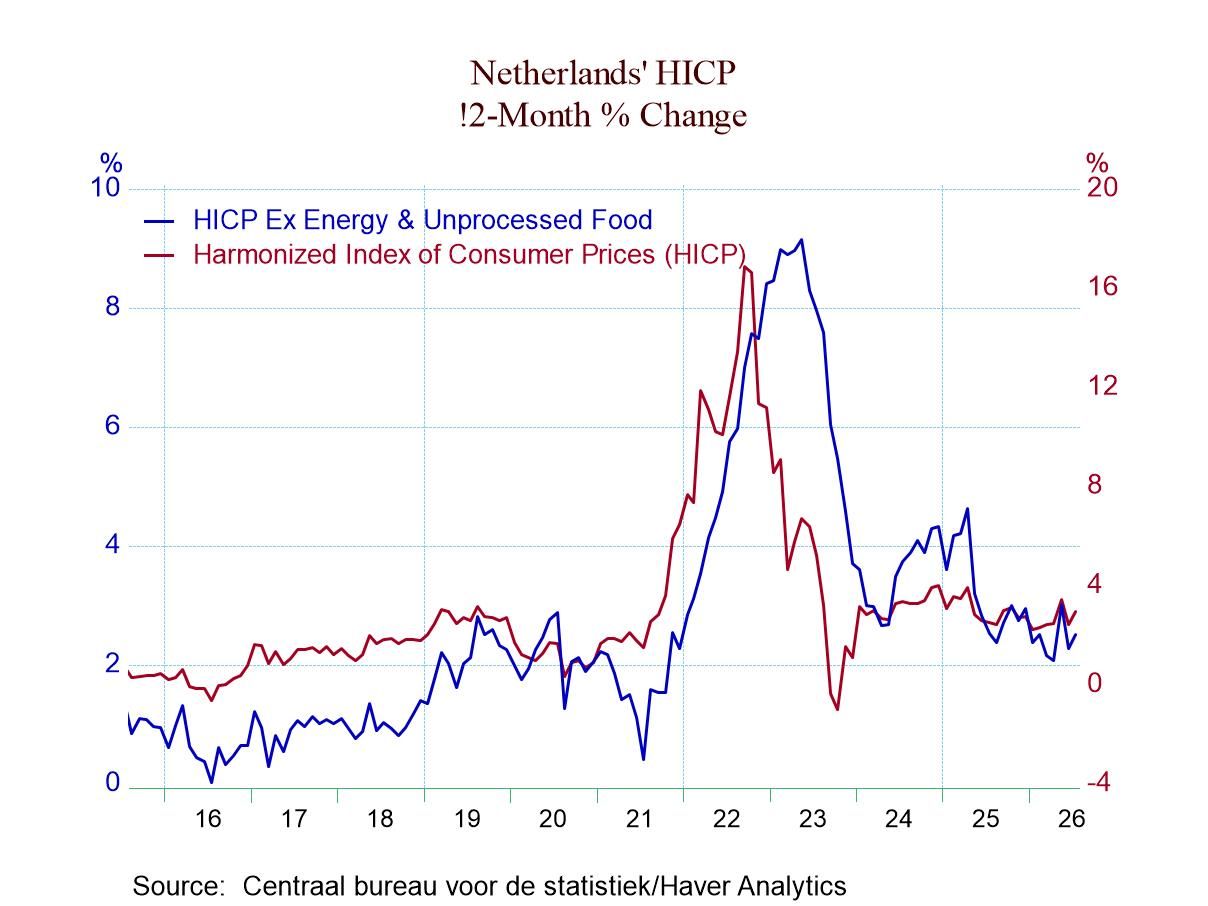
Inflation in the Netherlands picked up in July compared to June. Both the June HICP and the domestic inflation index had shown declines. In July, the HICP posted an increase of 0.7% month-to-month while the domestic CPI gained 0.5%, both easily showing accelerations compared to June. Monthly inflation rates increased in July the same or greater than previously in May.
Sequentially inflation is not exactly busting out; however, the legacy of inflation is still a bitter pill for the ECB to try to swallow even for this small European economy. The total HICP is up at a 2.9% annual rate over 12 months; that rises to a 4% annual rate over six months and settles back down to 2.1% over three months. That deflation is mostly on the strength of the weak showing in June. The domestic inflation rate rises 3.1% over 12 months; it accelerates to 4.3% annualized over six months and then only backs down to 2.8% at an annual rate over three months, largely on the back of the decline posted in June.
The domestic components show inflation accelerating in all but three categories in July; eight of thirteen showed declines in June. Only two categories showed declines in May.
Sequentially, looking at the percentage changes from 12 months to six months to three months, the components are showing mixed results. However, for food and for alcoholic beverages & tobacco, inflation steadily decelerates from 12 months to six months to three months. Only recreation & culture show inflation accelerating over 12 months, six months and three months. However, if we look at inflation trends over three months compared to six months, and six months compared to 12 months, acceleration is present for housing & utilities, for healthcare, for recreation & culture, and for personal care & miscellaneous categories. The not-named categories have more complex patterns, not necessarily good or bad, just complex. The line on the table for diffusion shows us that over 12 months inflation is accelerating in 38.5% of the categories compared to what it had done a year ago. However, over six months, the category inflation rates are higher compared to 12 months in 61.5% of the categories. Over three months compared to six months, inflation is higher in 46% of the categories. By these diffusion calculations, inflation is accelerating over six months compared to 12 months but otherwise it is decelerating over three months and over 12 months.
As an overview, the 2.1% inflation rate for the HICP over three months looks excellent; however, in context, it's result of three months, two of which were terrible, one of which was excellent, and so that's not much to go on. The HICP progressive inflation rates other than three months are all too high at 4% and 2.9%; for the domestic CPI, the same statements are true, except that the three-month rate at 2.8% is even worse than for the HICP over three months. The inflation diffusion statistics by themselves are not bad over three months, showing inflation accelerating in only 46.2% of the categories. That's a pretty good result and inflation accelerating over 12 months in only 38.5% of the categories. But the six-month pace is too high, and the question is where the three-month number is going to settle in once we move down the road; the good June inflation statistic beginning to fade and drop out is another issue. June increasing is looking like an outlier.
So that's a significant question on the outlook for inflation, and it's basically a question that we ask for every country because we had that break because of the hopeful situation that had arisen around the Strait of Hormuz and the prospect of oil prices going back down. Now that prospect appears to have passed and we're not quite sure where we stand. That puts the outlook and all the trends in a danger zone.
 USA| Aug 07 2026
U.S. Payroll Employment Unexpectedly Declined in July
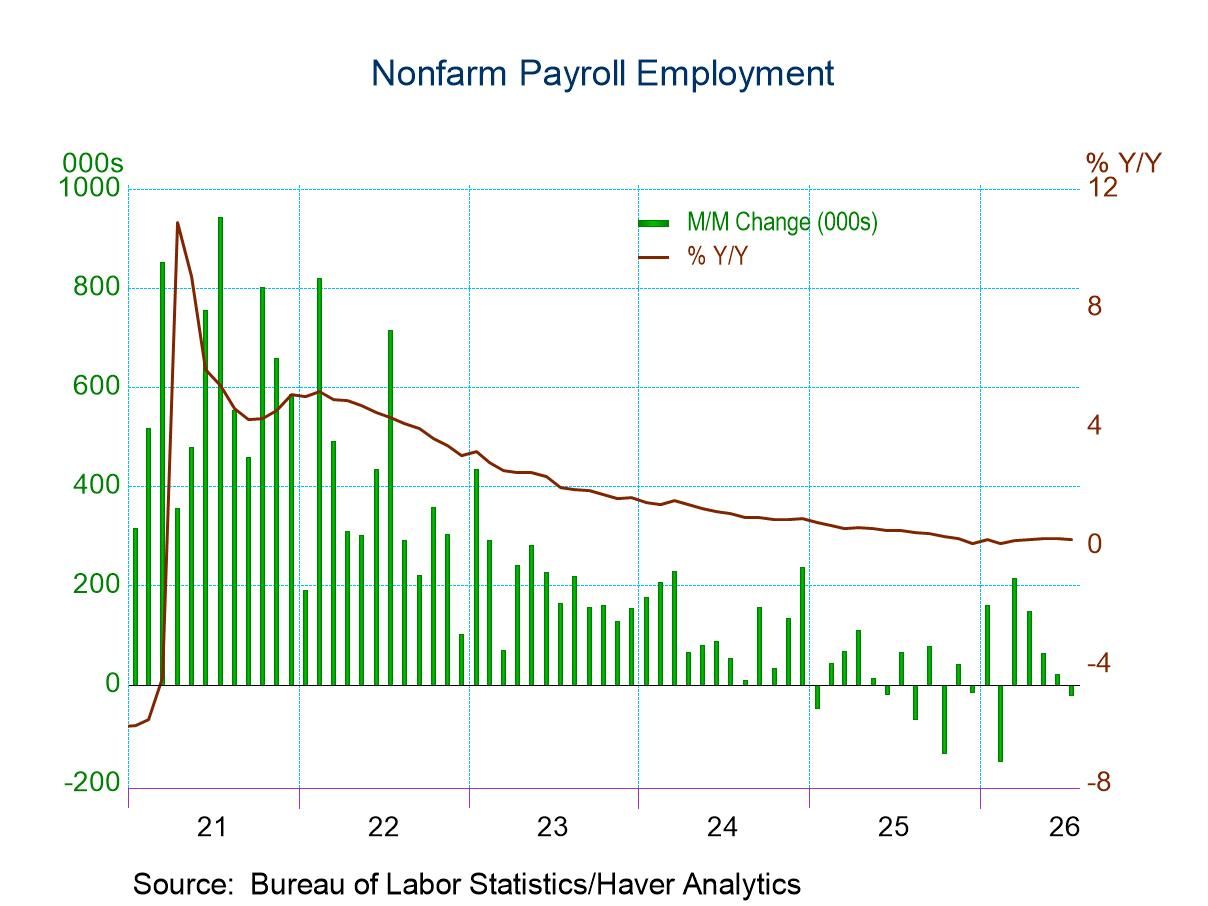
- U.S. nonfarm payrolls unexpectedly fell 23,000 in July with meaningful downward revisions to both May and June.
- The market consensus looked for an 85,000 increase.
- The unemployment rate edged down to 4.1%, its lowest since June 2025, from 4.2%, due mostly to another significant decline in the labor force.
- Average hourly earnings edged up 0.1% m/m (3.2% y/y), meaningfully lower than expectations.
by:Sandy Batten
|in:Economy in Brief
 Germany| Aug 07 2026
German Industrial Output Gathers Strength
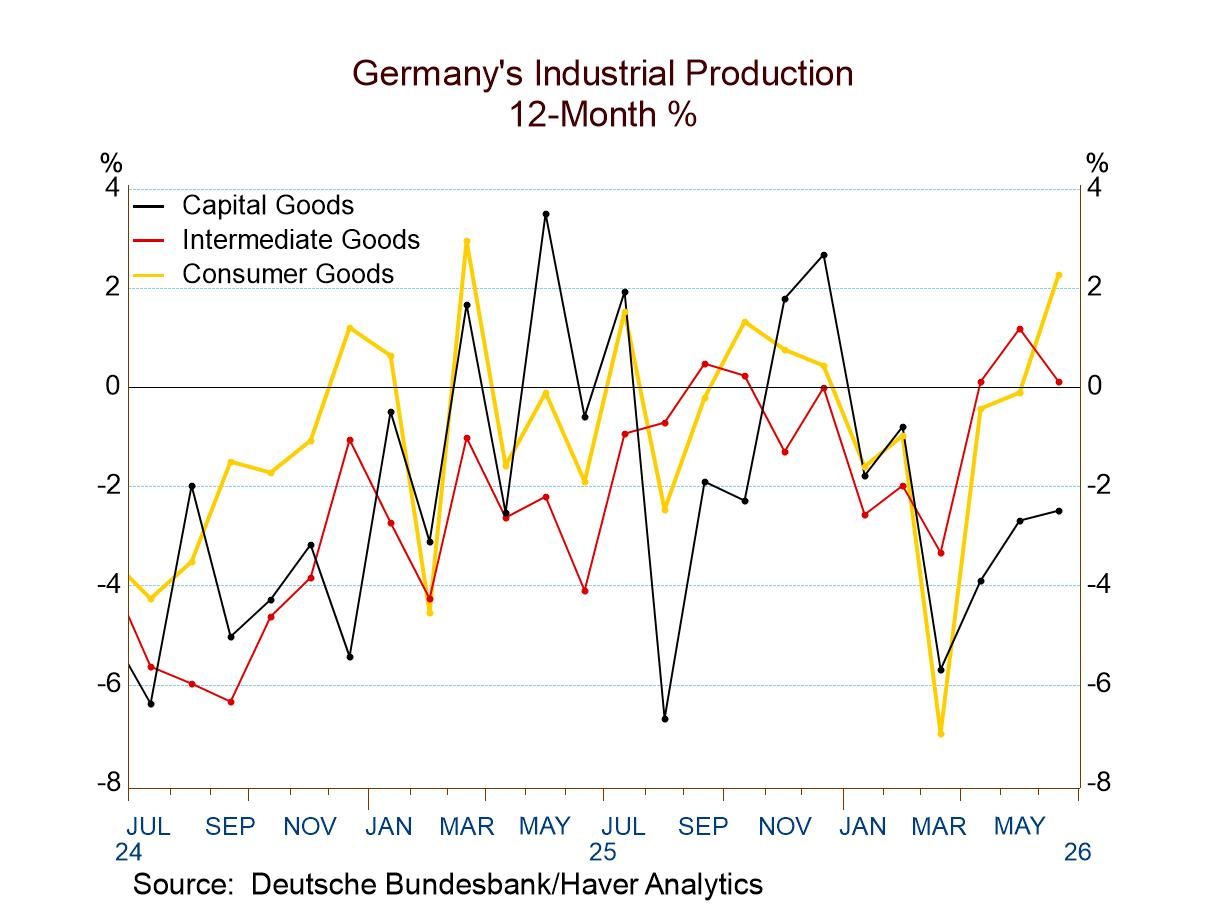
German industrial production rose by 0.2% in June, continuing a string of increases. Production in Germany is on an accelerating path. It is unchanged over 12 months, but it has a 0.9% annual rate increase over six months and a 4.5% annual rate increase over three months, a clear acceleration in the rates of growth over the shorter periods.
That trend is accentuated by consumer goods that grow 2.3% over 12 months; output then steps up to a 3% annual rate over six months and advances to 18.9% at an annual rate over three months. Capital goods and intermediate goods interrupt the pattern to some extent. For capital goods, output falls 2.5% over 12 months, then weakens further, falling by 4.2% annually over six months, but it rebounds to grow at a 0.8% annual rate over three months. That's not an accelerating pattern, but there is a recovery over three months. Intermediate goods show a 0.1% increase in output over 12 months, rising to 1.7% annually over six months but then stepping back to a 1% growth rate over three months.
Manufacturing alone also shows accelerating growth as growth rates improve from 12 months to six months to three months. Real manufacturing orders have a convoluted growth rate, with positive growth over 12 months, a decline over six months, and then a small recovery over three months. The pace of real sales, as we saw in yesterday's durable goods orders and sales report, is on a shrinking path.
Industrial surveys generally show sequential deterioration for the sector from the ZEW and the IFO. The exception is the EU Commission industrial index that shows some slight improvement sequentially.
Industrial production results are presented for five other European countries that have issued IP data as of June. These data show acceleration sequentially in Spain, Sweden, and Norway. France and Portugal have complex patterns that end with negative three-month growth rates.
On balance, Germany shows some hopeful trends, with some rebound being led to some extent by the consumer sector. The survey data on industry are not encouraging. Although the picture for the rest of Europe shows some tendency for acceleration, there’s still a good deal of lingering weakness.
 Global| Aug 06 2026
Charts of the Week: A Resilient World Economy, and Its Price
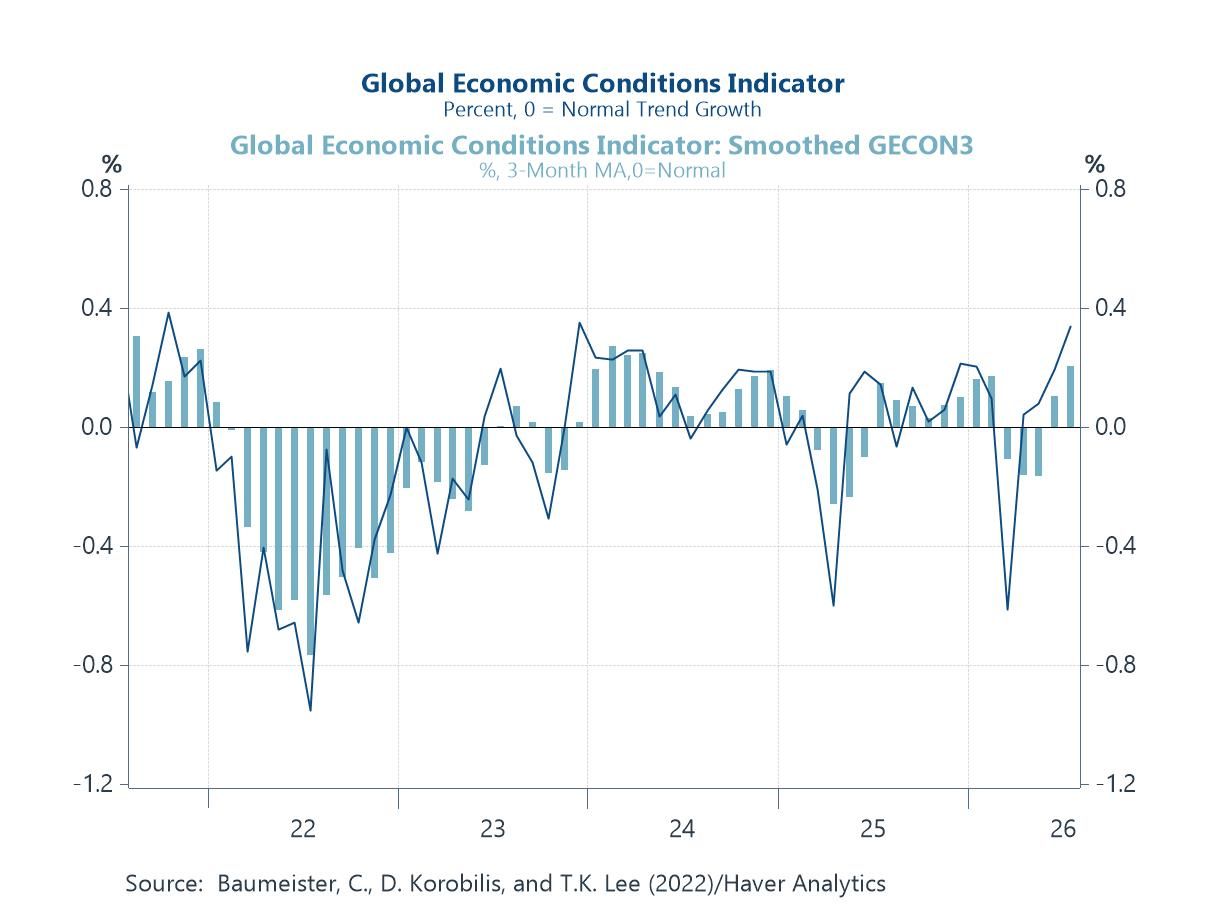
The global economy has proved stubbornly resilient this summer, even as the backdrop has grown noisier. A fresh flare-up in the Middle East, reports of official intervention to arrest a slide in the yen, and a bout of nerves over the vast sums now being committed to artificial intelligence have all unsettled sentiment, while central banks — the Federal Reserve among them — have turned markedly more hesitant about cutting rates than they appeared only a few months ago. Yet the incoming data have held up better than feared, with a broad gauge of global activity climbing back above its normal trend and shrugging off the gloom (chart 1). If anything, the pressure on interest rates has been upward rather than down. Forecasters have spent recent months marking up their expectations for policy rates a year ahead across almost every major economy (chart 2), and the shift looks more than cyclical: estimates of the neutral rate, the resting point for real rates, now stand higher than they did in 2019 in every advanced economy (chart 3), lifted above all by the swelling supply of government debt (chart 4). Behind that repricing lies an investment cycle that is quietly gathering pace and, encouragingly, one still financed largely out of profits rather than borrowing (chart 5). It is not without its constraints, however. The real price of copper, the indispensable metal of electrification, sits close to a multi-decade high — a reminder that a capital-hungry world is beginning to strain against physical limits (chart 6).
by:Andrew Cates
|in:Economy in Brief
 USA| Aug 06 2026
Productivity: Moderate Growth in Q2
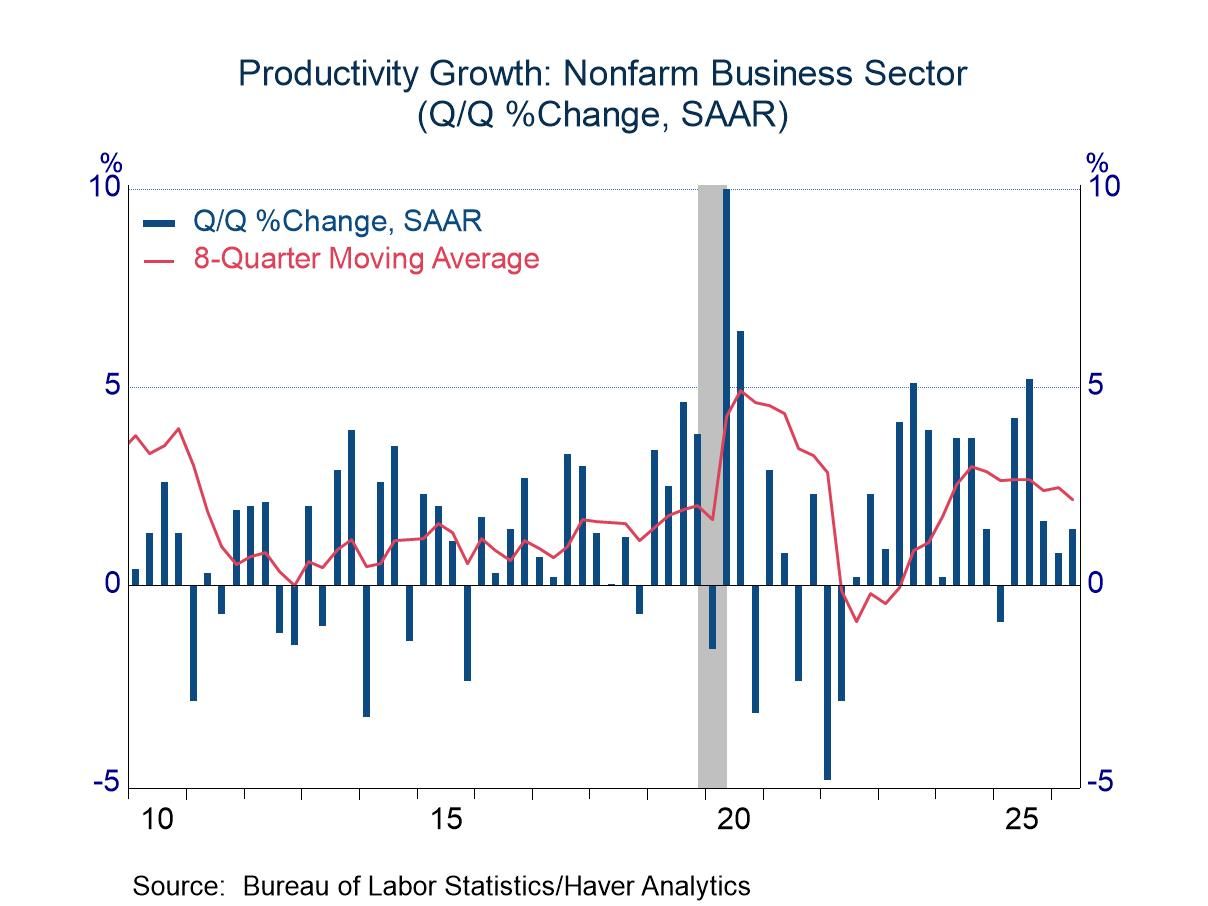
- Productivity gains, while still respectable, have lost a bit of vigor in recent quarters.
- Unit labor costs rose moderately, suggesting little inflation pressure.
 Germany| Aug 06 2026
German Orders Surge on Domestic Strength
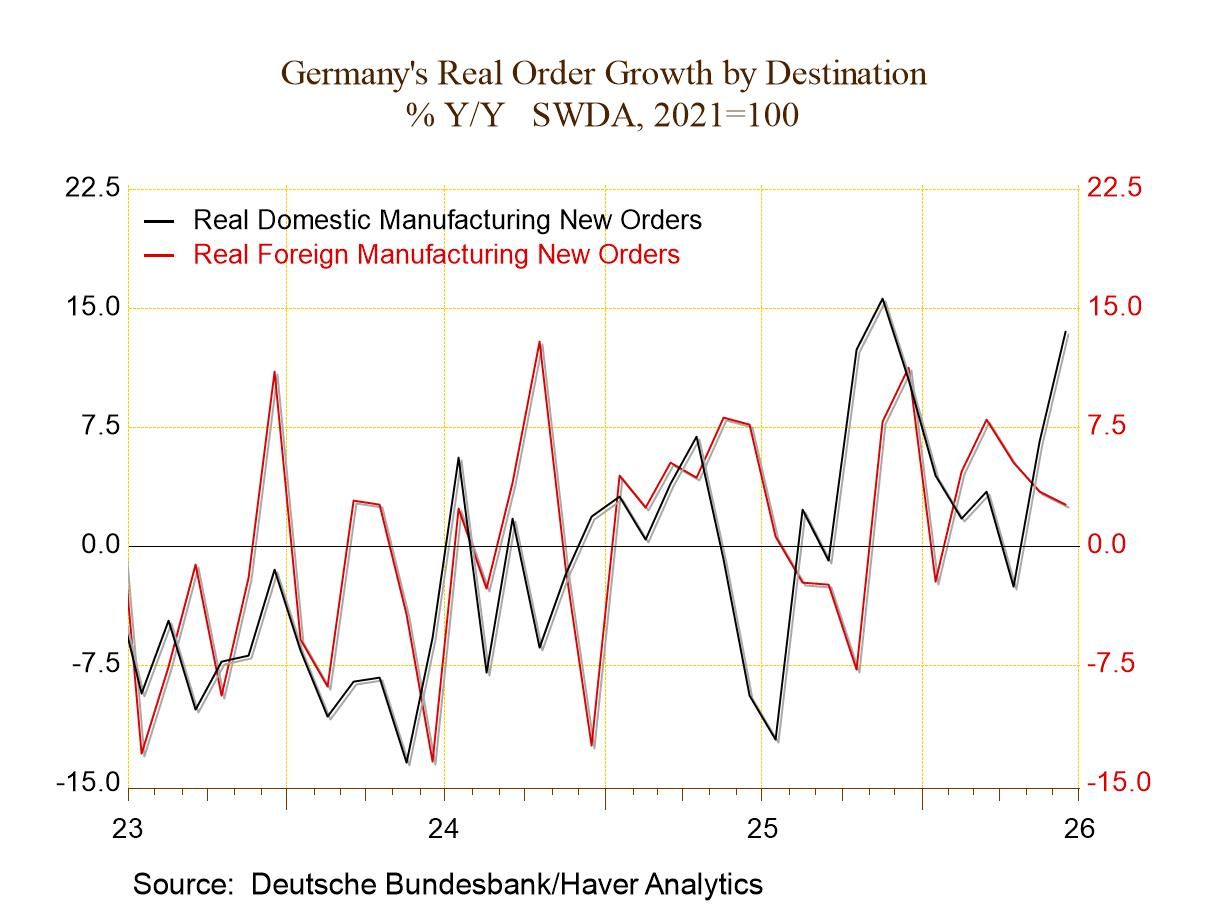
German orders in June rose by 3.1%, after a 0.3% crawl higher in May and a sharp 3.2% decline in April. Domestic orders have been gradually building a head of steam after falling 2.4% in April; they rose by 1.3% in May and surged by 7.8% in June. Over the same timeline, there was a 3.8% decline in foreign orders in April; that decline was trimmed to 0.3% in May and became a tiny 0.2% increase in June. In all cases, there was a progression from relatively deep negative numbers in April in the wake of the start of the attacks on Iran. That weakness led to stabilization and a moderate increase in May, and then to a lot more strength in June as markets and economies became hopeful that the Iran war was winding down as both parties seemed to be getting slightly punch-drunk.
Sequential Growth Patterns The progression of orders from 12 months to six months to three months is not clean, with a lack of overall trend for orders. Foreign orders move to progressive weakness from 12 months to six months to three months. Domestic orders are somewhat chaotic in their pattern but show a 13.5% increase over 12 months and an explosive 29.6% annual rate increase over three months. The foreign orders series is weak and somewhat concerning, but the domestic order series maintains quite reassuring growth over 12 months and three months.
Quarter-to-Date Orders In quarter-to-date (QTD), the data are now complete even if they are preliminary, with total orders rising 5.8%, foreign orders rising 6.9%, and domestic orders rising 3.8%, all at annual rates. The queue standings on the levels of orders as of June show strong 85-to-90-percentile levels of activity for total orders and foreign orders, with domestic orders coming in at a milder, but still above-median 64.1 percentile standing. When we rank orders in terms of their year-over-year growth rates, total orders have a 73.0 percentile standing, with foreign orders at a 52.5 percentile standing and domestic orders at a 93.0 percentile mark. The growth performance favors domestic orders, but the level of orders that is being achieved is better for foreign compared to domestic orders using historic comparison standards.
Sales/Real Sector Sales Turning to sales, we find them somewhat more erratic in June, showing a decline for manufacturing overall, with all manufacturing sectors showing month-to-month drops except consumer durables where sales have a 2.5% gain. Manufacturing sales in real terms rose by 0.2%, with mixed sector performance. In April, all sales made a 0.1% gain in real terms amid convoluted sector patterns. The sequential performance of retail sales by sector shows the overall trend is progressively weakening, with all manufacturing sales falling by 0.4% over 12 months, by 0.8% at an annual rate over six months, and by 3.7% at an annual rate over three months. Sales decline for all categories over three months, for most categories over six months, and for all categories over 12 months. The sales picture is not particularly healthy, but fortunately that's a look back at what consumers and businesses have done, while, presumably, the orders data are more robust and looking ahead. The queue standing levels for real sales are quite weak. In fact, for manufacturing, the overall ranking is just above 50% at a 50.9 percentile standing. Capital goods have a very strong 71.8 percentile standing. Intermediate goods have a standing just short of their median at a 45.8 percentile. But real sales for consumer goods, consumer durables, and consumer nondurables are extremely weak, in the bottom 10-percentile standing or even weaker. Turning to rankings based upon the pace of sales on year-over-year data, all of the metrics for real sector sales are below the 50% mark, which means they are below their respective medians for the period. However, the rankings are generally clustered around a 40-percentile standing, which is moderately weak, within roughly 10 percentile points of the median. While not encouraging, it's not devastating.
Industrial Confidence in Europe Industrial confidence measures for Germany, France, Italy, and Spain, providing a quick look at the large countries in the European Monetary Union, showed negative readings in June for all the countries, with slight progress made in June compared to May in three of the four countries (France being the exception showing slippage). The averages over 36 months and 12 months again show consistently negative numbers, with very little change over three months compared to 12 months. The rankings of the industrial confidence readings, which are diffusion indexes from the EU, show only Spain with a ranking above its 50-percentile, putting it above its past median. However, France has a 44.3 percentile standing, which is close to the median; Italy has a 37.8 percentile standing; and Germany has the lowest standing at its 32.1 percentile.
- of7Go to 5 page