Global| Aug 06 2026
Charts of the Week: A Resilient World Economy, and Its Price
by:Andrew Cates
|in:Economy in Brief
Summary
The global economy has proved stubbornly resilient this summer, even as the backdrop has grown noisier. A fresh flare-up in the Middle East, reports of official intervention to arrest a slide in the yen, and a bout of nerves over the vast sums now being committed to artificial intelligence have all unsettled sentiment, while central banks — the Federal Reserve among them — have turned markedly more hesitant about cutting rates than they appeared only a few months ago. Yet the incoming data have held up better than feared, with a broad gauge of global activity climbing back above its normal trend and shrugging off the gloom (chart 1). If anything, the pressure on interest rates has been upward rather than down. Forecasters have spent recent months marking up their expectations for policy rates a year ahead across almost every major economy (chart 2), and the shift looks more than cyclical: estimates of the neutral rate, the resting point for real rates, now stand higher than they did in 2019 in every advanced economy (chart 3), lifted above all by the swelling supply of government debt (chart 4). Behind that repricing lies an investment cycle that is quietly gathering pace and, encouragingly, one still financed largely out of profits rather than borrowing (chart 5). It is not without its constraints, however. The real price of copper, the indispensable metal of electrification, sits close to a multi-decade high — a reminder that a capital-hungry world is beginning to strain against physical limits (chart 6).
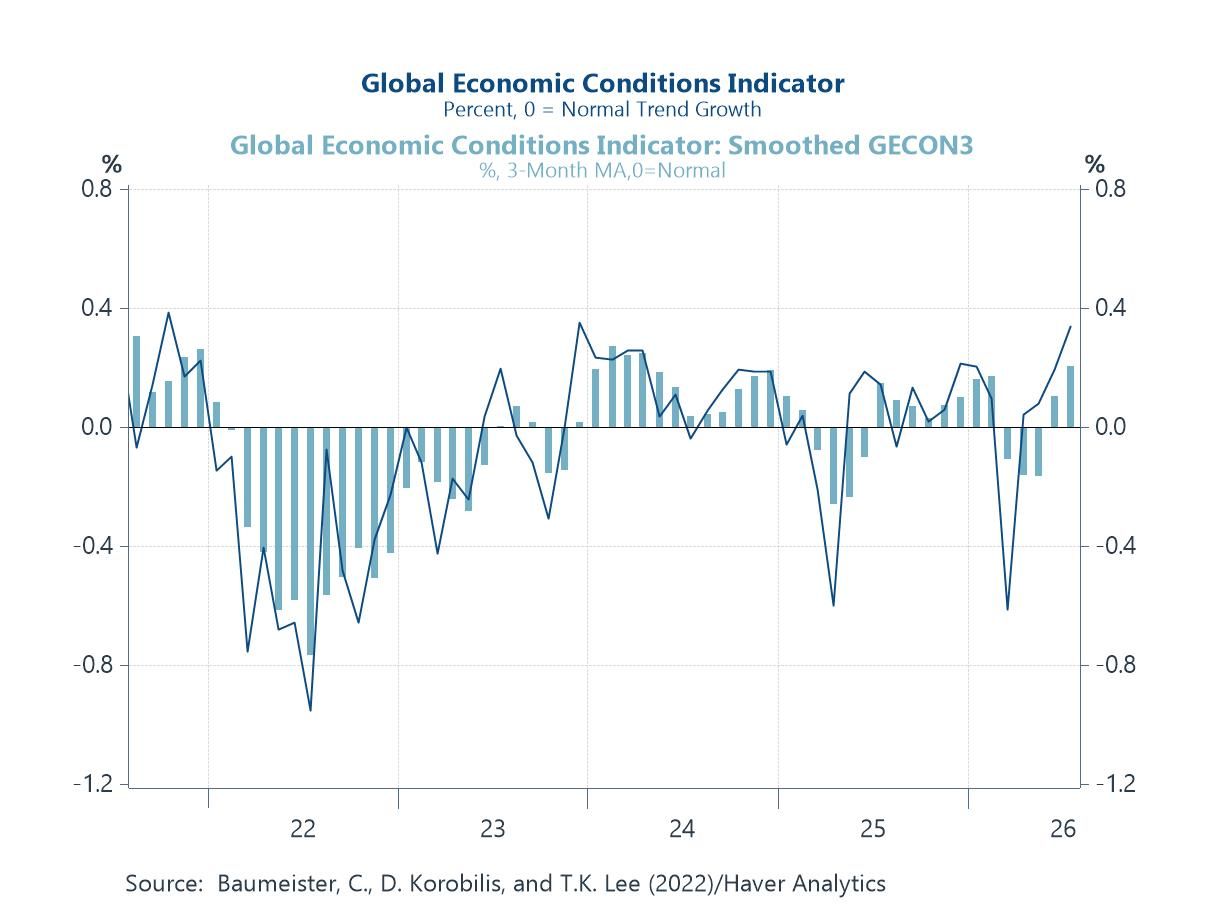
A world economy that refuses to buckle For all the anxiety in the headlines, the world economy has kept its footing. The gauge in question is the Global Economic Conditions Indicator of Baumeister, Korobilis and Lee, a composite distilled each month from sixteen separate series that among them span the breadth of the global economy: industrial production and leading indicators, consumer confidence and expectations, commodity and energy prices, financial conditions and the dollar, shipping and transport, geopolitical risk, and even the weather, by way of measures of El Niño and energy-related temperatures. Expressed relative to normal trend growth, it fell close to a full percentage point below par during the disruption of 2022. It has since climbed back above zero, leaving global activity running, if anything, a shade faster than its long-run trend.
Chart 1: A broad gauge of global activity has climbed back above its normal trend
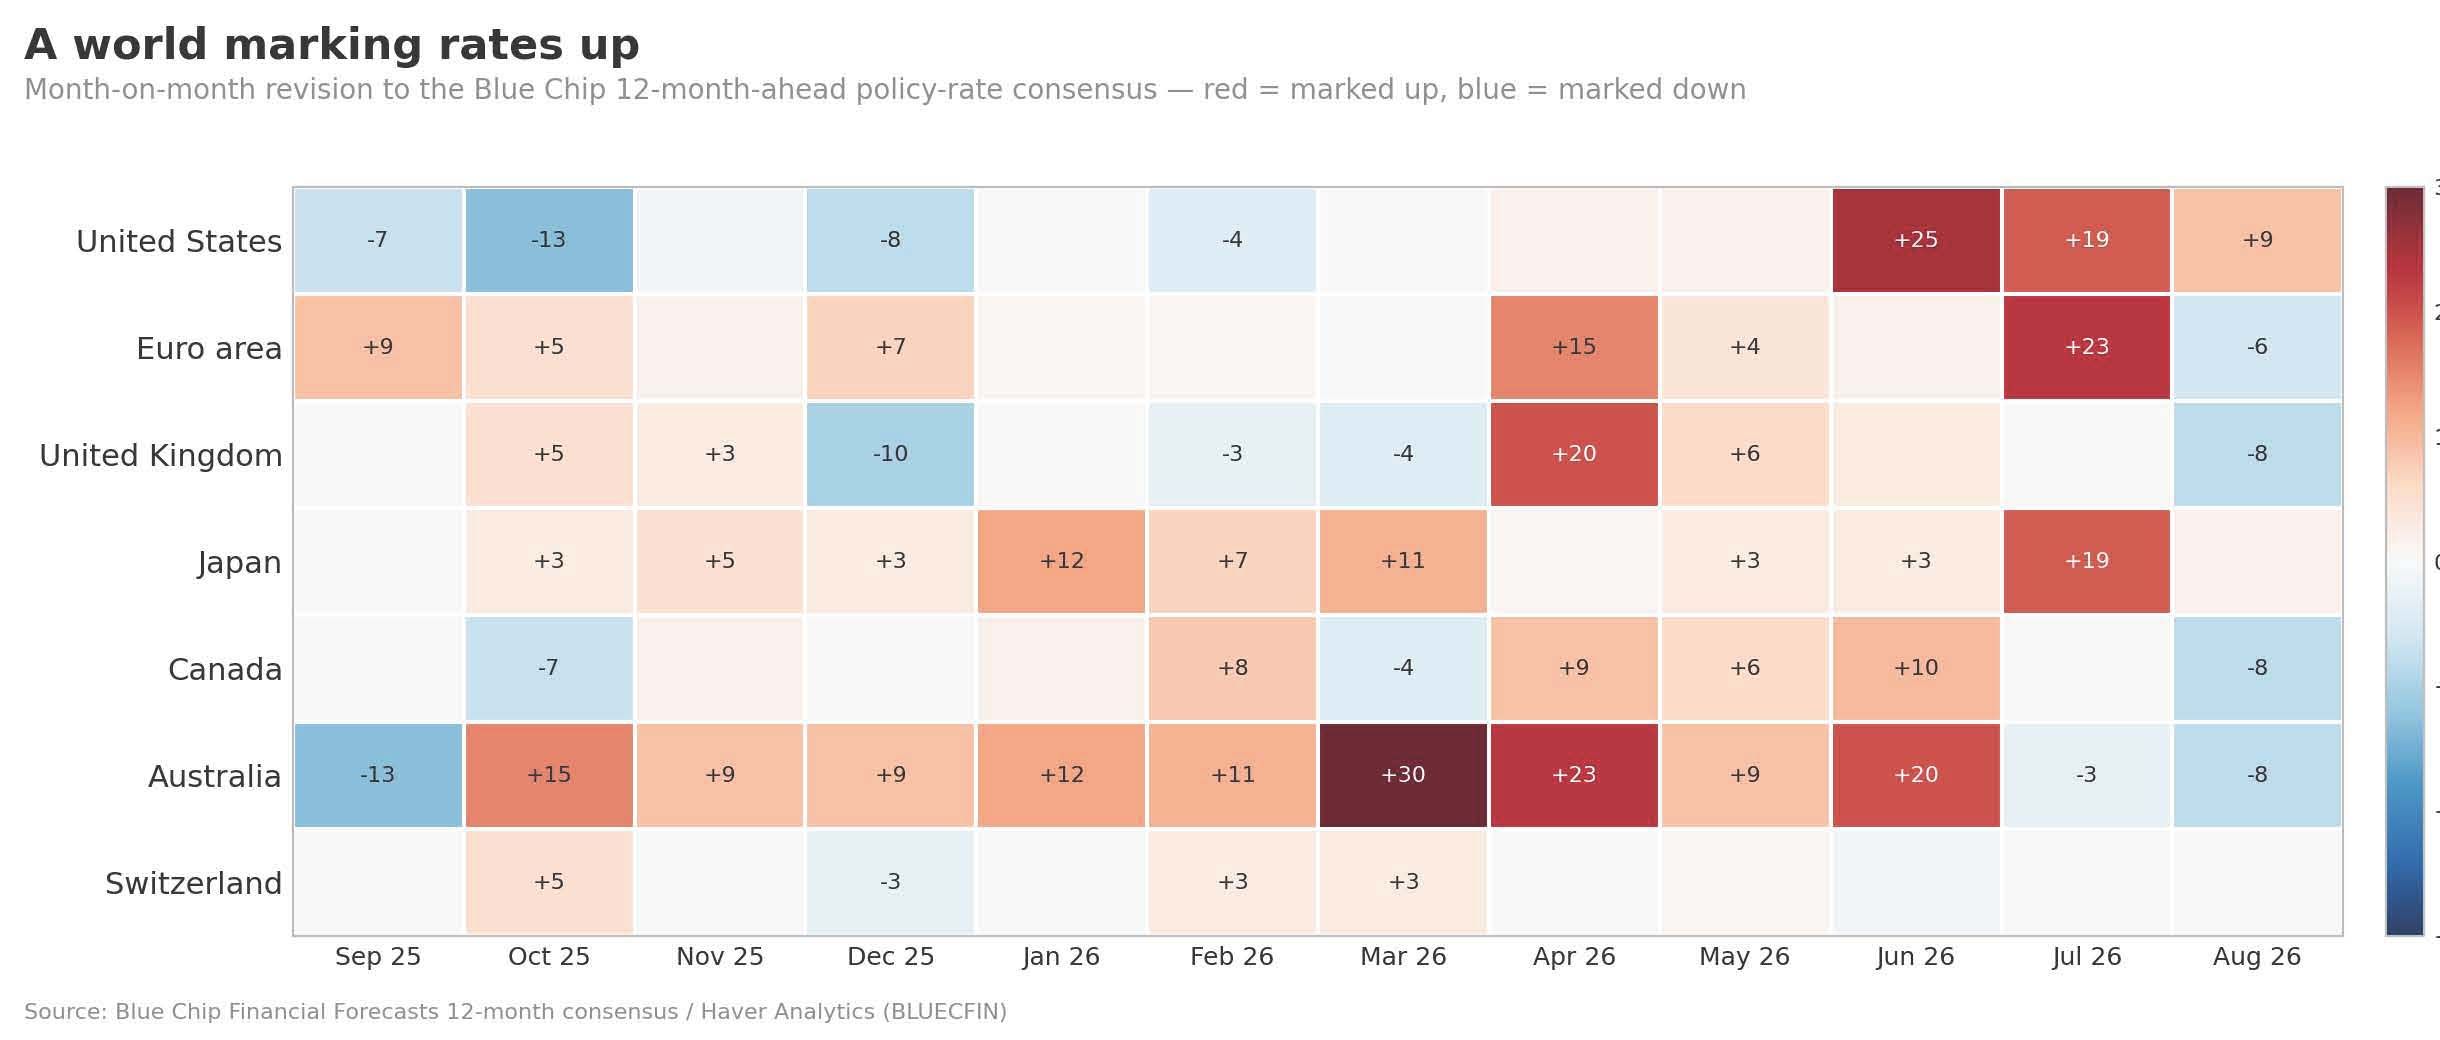
Higher interest rate expectations That resilience has had a consequence for interest rates, and not the one markets spent much of the past year anticipating. Rather than the cuts once taken for granted, Blue Chip forecasters have been quietly raising their expectations for where policy rates will sit twelve months hence — and doing so almost everywhere at once, across the United States, the euro area, Japan and Australia alike. The breadth of the revision is what gives it weight. A change confined to a single economy might be put down to a local quirk of politics or the cycle; a shift that spans most of the advanced world at the same moment is far harder to dismiss. It has the look of a collective reassessment of how far, and how fast, rates can now fall — the same conclusion the neutral-rate estimates in the next chart reach by a longer road.
Chart 2: The 12-month-ahead consensus for policy rates has been revised up almost everywhere
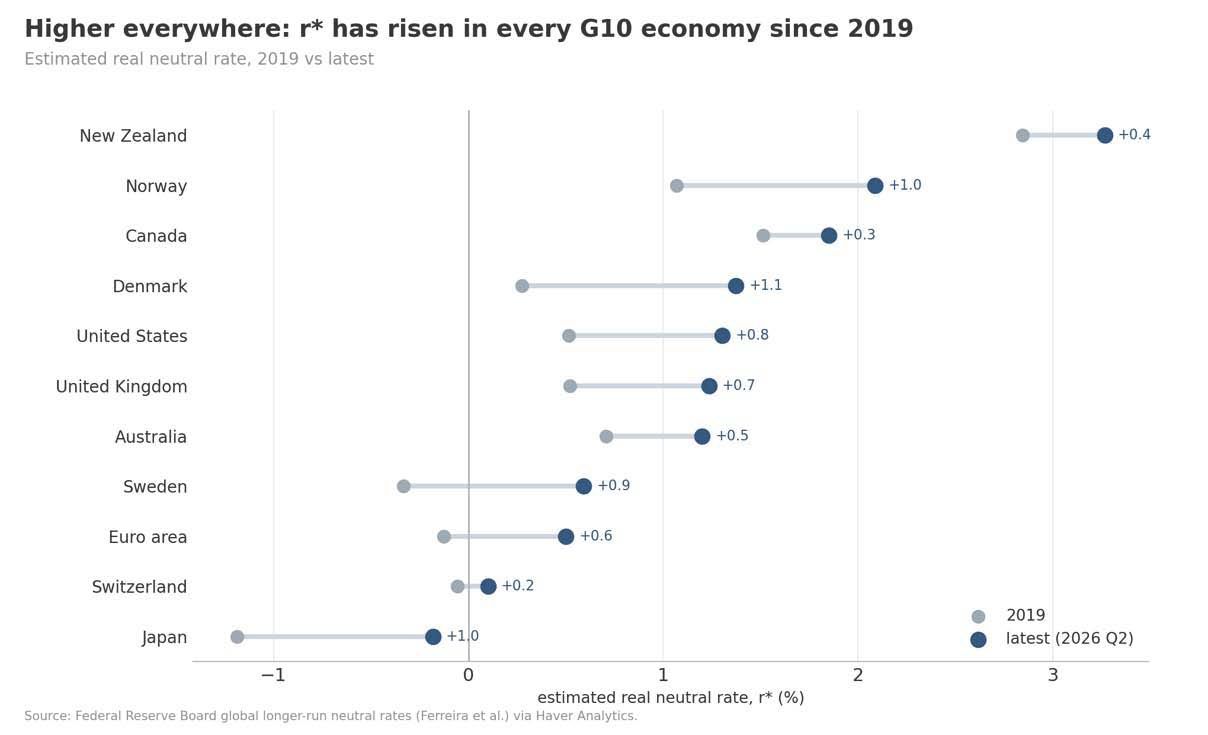
A higher resting place The reassessment reaches well beyond the coming year. The neutral rate — the real rate that neither stimulates nor restrains an economy running at capacity, and thus the level rates settle at once the cycle has passed — has risen as well. Estimates for eleven advanced economies now put it higher than in 2019 in every economy; Japan's is still below zero but a full point higher than it was, and New Zealand's is above three per cent. This arguably matters more than a rise in current rates. A high policy rate today can be written off as cyclical, to be reversed at the first downturn; a higher resting rate cannot. On these estimates the very low rates of the past decade were not the normal order of things but a phase that is probably now ending, which makes the widespread assumption that rates will eventually drift back to them increasingly hard to defend.
Chart 3: The neutral rate is higher than in 2019 in every advanced economy
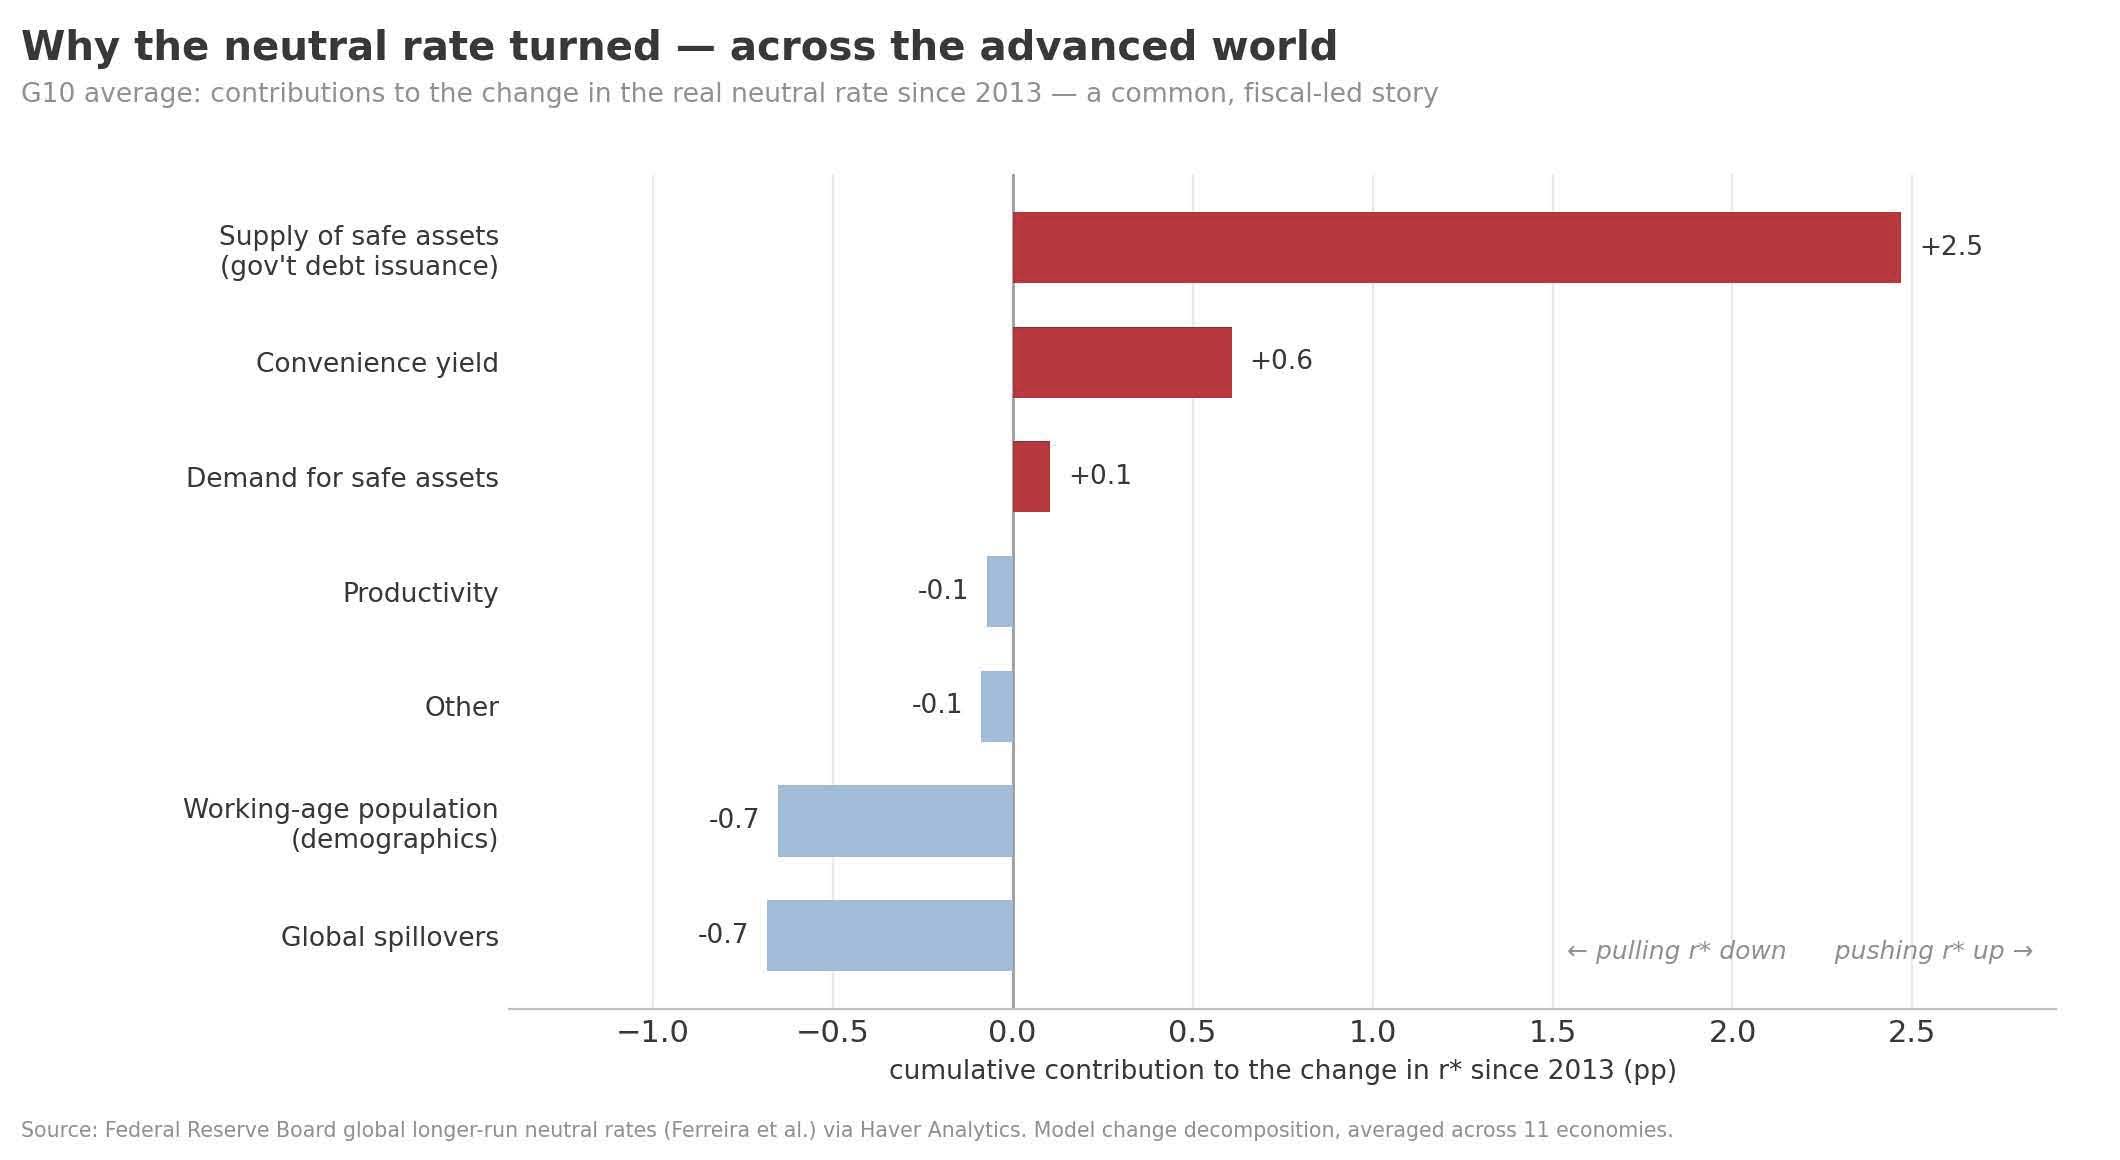
Fiscal appetite meets the demand for capital Why has the anchor moved? The US Fed’s decomposition points, above all, to governments. The largest single force lifting neutral rates across the advanced world has been the swelling supply of government debt: as safe assets multiply, they can be absorbed only at a higher yield, with a fading premium for their safety adding to the effect. Ranged against that, an ageing population's appetite for safe saving and the slow retreat of the global savings glut have pulled the other way, though not by enough to offset it. What gives the fiscal story its bite is the company it now keeps on the demand side. Wide deficits are competing for savings with an investment cycle that has plainly turned — in artificial intelligence, in defence, in the reshoring of supply chains — and a rising demand for capital meeting a supply that no longer grows freely is the very definition of a more expensive real rate.
Chart 4: Government-debt supply has done most to lift the neutral rate
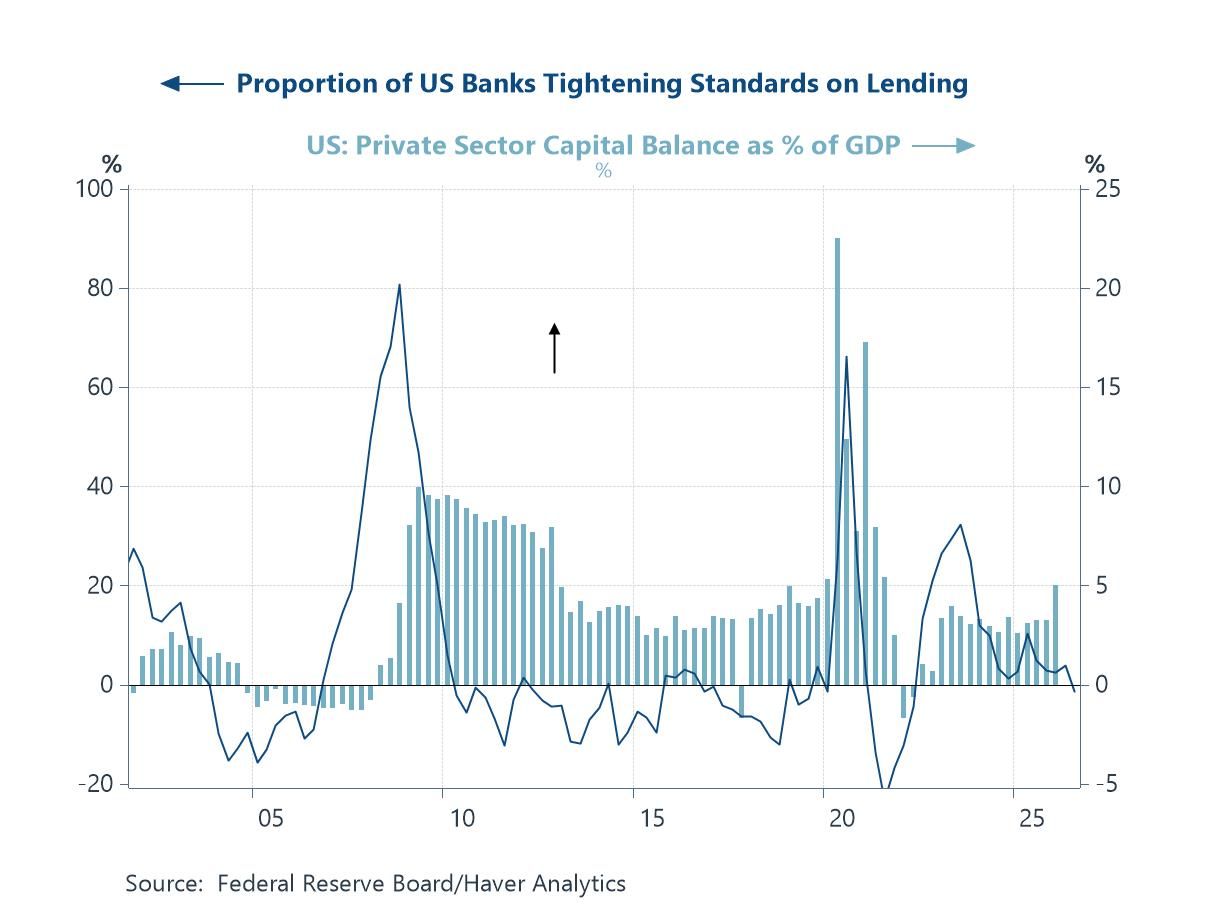
A boom financed (so far) from profits, not debt The character of that investment matters as much as its scale, and there is some reassurance. Set the proportion of American banks tightening their lending standards, drawn from the Federal Reserve's quarterly Senior Loan Officer Opinion Survey, against the financial balance of the private sector as a whole, and a comforting picture emerges. Banks turned cautious through the recent cycle, tightening credit conditions appreciably, and yet the private sector has gone on running a healthy surplus, its spending funded in aggregate out of income rather than a build-up of debt. This week's survey, covering the second quarter, suggests that even the credit squeeze is now fading. Banks reported that standards on business loans were little changed over the quarter, while demand for those loans strengthened — a pick-up they attributed, tellingly, to their customers' higher spending on plant and equipment. The distinction between profits and borrowing remains a crucial one. An investment upturn paid for largely from profits is far sturdier than one built on leverage, and far less exposed to the higher cost of borrowing described in the earlier charts; and where firms are now turning to the banks, they appear to be doing so to finance new capacity rather than to plug a hole. It also lends some perspective to the recent jitters over artificial-intelligence spending: for all the noise, the economy-wide accounts show little sign, as yet, of the over-extension that turned earlier booms to bust.
Chart 5: US banks have tightened, yet the private sector still runs a surplus
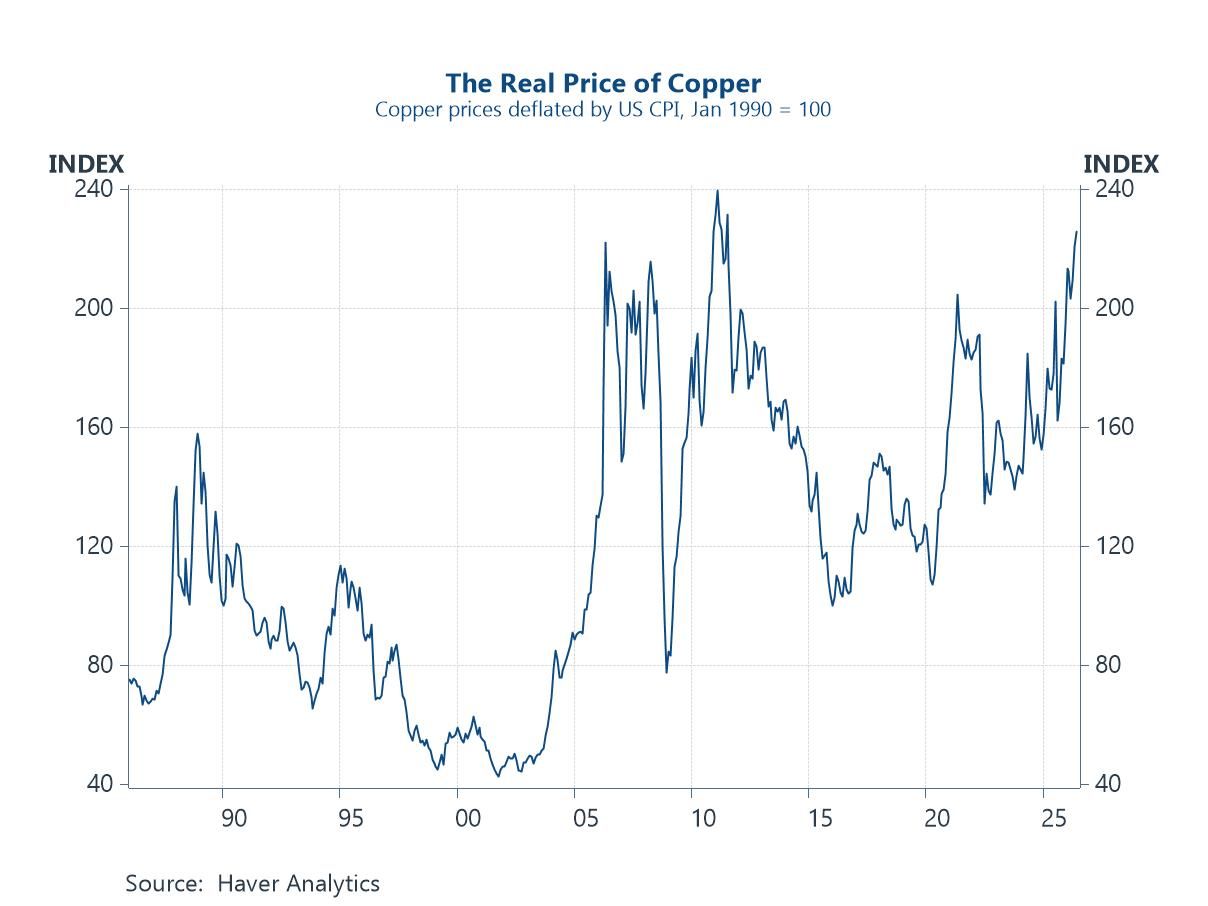
Where the boom meets its limits The financial foundations look solid; the physical ones are more of a challenge. Copper is the clearest example. An economy cannot electrify, expand its power grid, build data centres or rearm without a great deal of it, and the real price of copper now sits close to its highest in decades. The reason is a straightforward imbalance: demand is rising quickly, while a new mine takes the best part of a decade to come on stream, so supply struggles to keep pace. The strains are not confined to metals. Tensions in the Middle East over the summer have kept markets wary about the security of energy supply, a reminder that the constraints on a fast-investing economy are now as much a matter of geopolitics as of finance.
Chart 6: The real price of copper sits close to a multi-decade high

Andrew Cates
AuthorMore in Author Profile »Andy Cates joined Haver Analytics as a Senior Economist in 2020. Andy has more than 25 years of experience forecasting the global economic outlook and in assessing the implications for policy settings and financial markets. He has held various senior positions in London in a number of Investment Banks including as Head of Developed Markets Economics at Nomura and as Chief Eurozone Economist at RBS. These followed a spell of 21 years as Senior International Economist at UBS, 5 of which were spent in Singapore. Prior to his time in financial services Andy was a UK economist at HM Treasury in London holding positions in the domestic forecasting and macroeconomic modelling units. He has a BA in Economics from the University of York and an MSc in Economics and Econometrics from the University of Southampton.
More Economy in Brief