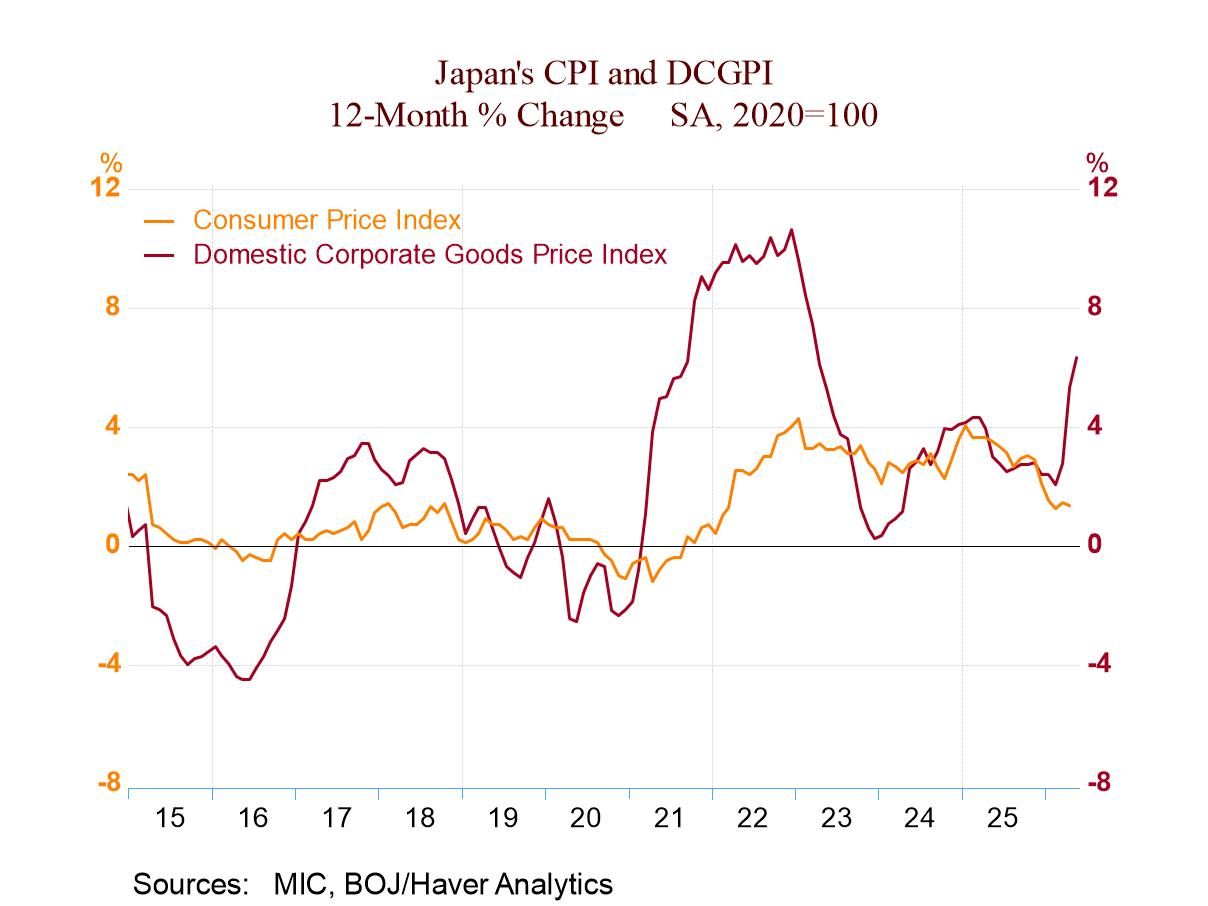
Haver Analytics
Haver Analytics

Economy in Brief

    • General Business Conditions Index -14.3 in Apr. vs. -20.9 in Mar., showing contraction for the fifth straight month.
    • Negative numbers for new orders (-16.2), shipments (-14.4), unfilled orders (-10.1), and employment (-5.1), but positive reading for inventories (3.4), the first positive since Nov. ’23.
    • Inflation pressures increase, w/ prices paid rising to 33.7, the highest since May ’23.
    • Optimism on the six-month outlook remains positive but subdued, w/ Future Business Conditions Index down to a four-month-low 16.7.
    • Overall index remains at highest level since July 2023.
    • Component movement is mixed.
    • Regional indexes diverge.
  • The chart shows that European Monetary Union industrial production in manufacturing has been declining across sectors on a year-over-year basis for quite some time. Intermediate goods output declines extended back to April 2022; for consumer goods the declines occurred early in 2023 and have persisted; for capital goods the declines occurred around July 2023 and with one spike reversal the declines have come back vigorously. Capital goods output is currently showing the deepest year-on-year decline in output of any manufacturing sector. The annual trends are clear and quite negative. However, the short-term trends are different, much more optimistic.

    Sequential growth rates in IP From 12-months to six-months to three-months, EMU output excluding construction shows a turnaround in progress. Output falls 7.1% over 12 months, falls at a 2.8% annual rate over six months, and falls at just a 2.4% annual rate over three months as trends make steady improvement. Sequentially from 12-month industrial production is showing signs of diminished declines. This trend holds for manufacturing as well where output declines at 7.5% over 12 months, while over three months and six months the pace of decline is reduced to under 1%. We see improvement in two of three sectors as well. Consumer goods output echoes this improvement with year-over-year decline in output at 6.3%, a six-month decline at a 4.2% annual rate, and a three-month decline at a 2.3% annual rate. Intermediate goods show output is gaining momentum culminating in an output increase over three months. Twelve-month intermediate goods output falls by 2.9%, then rises at a 0.4% pace over six months, and then increases at an annual rate of 6.3% over three months. The fly in the ointment for short-term trends in manufacturing is capital goods. Capital goods output declines at a 9.7% annual rate over 12 months; over six months it continues to decline at a rapid pace although slightly diminished, falling at a 9.1% annual decline rate, and then over three months, the rate of decline accelerates sharply to -17%. These trends create a confusing picture for output where there continues to be long-term weakness punctuated by short-term improvement in consumer and intermediate goods but held back by ongoing and severe weakness in capital goods output.

    On a quarter-to-date basis (QTD), weakness dominates the overall statistics with a 6.8% annual rate decline in eurozone output excluding construction. Manufacturing is even more severely crimped with a decline at an 11.5% annual rate. The manufacturing result is driven by a 34.7% annual rate decline in the output of capital goods even though intermediate goods output increases at a 7.3% annual rate and consumer goods output falls at only a 0.5% annual rate. In the quarter-to-date, manufacturing trends are weak but also are represented by considerable variety.

    Country patterns in manufacturing Across 13 of the earliest members of the European Monetary Union in February, we see manufacturing declines in only three: Belgium, Spain, and Greece. In January, eight countries show declines in output. In December, only four showed declines; those included Germany, Finland, Spain, and Portugal. Quarterly trends across countries show some signs of progress. Ten countries showed declines in industrial production over 12 months; that count was reduced to nine countries over six months and reduced further to five countries over three months. The median result across these countries is for a decline in output of 2.4% over 12 months, a decline of 2% output at an annual rate over six months and an increase in output at a 1.6% annual rate over three months. The country level data support a more optimistic reading of trends. Even so, the quarter-to-date comparisons eight of these thirteen countries with output declining in the first quarter.

    • Import prices rise for third consecutive month.
    • Excluding fuels, import prices edge up for fifth straight month.
    • Export price gain moderates m/m, and y/y decline shrinks.
    • Principal & interest payments increase.
    • Mortgage rates edge higher.
    • Median sales price of single-family home increases.
  • Japan
    | Apr 12 2024

    Japan's IP Weakens Further

    Japanese economic data have been soft. However, industrial production has been weaker than many of the other reports, and weaker than the softness indicated by the manufacturing PMI. This month the preliminary report on Japanese industrial production has been revised to show even more weakness. Japan's industrial sector shows an extremely weak progression looking at its pattern of growth over 12 months to six-months to three-months. The downturn in manufacturing is intensifying.

    The weakness in manufacturing is generally weaker than what we see in other reports as well. While there's been softness in surveys like the economy watchers report, and in Japanese retail sales, the industrial sector is showing sharply weaker conditions, and this is occurring even at a time when the yen exchange rate is weakening and improving Japan's competitiveness.

    The weakness in industrial production does track the weakness in Japan’s core orders that have been showing contraction for all of 2023 and into 2024. Japan’s production was down by 1.6% over the previous 12 months; now it is falling by 6.7% over the most recent 12 months. Sequential growth rates tell us that the drop in production is accelerating across major manufacturing categories. This weakness is not an isolated result.

  • This week’s stronger-than-expected US inflation data have further dampened hopes that the Fed would swiftly lower interest rates in coming months. And this has led to increased anxiety in financial markets about the outlook for the US and broader world economy. In our charts this week we explore recent shifts in the consensus view toward global growth and inflation as revealed by the latest Blue Chip survey of Economic Forecasters (charts 1 and 2). Then, staying with inflation, we assess the big role that higher oil prices may have played in igniting interest rate concerns over the past few weeks (charts 3 and 4). One of the possible reasons for the recent run-up in oil prices is an improving global economy, some survey evidence for which we examine next (chart 5). Finally, and ahead of this week’s ECB meeting, we delve into some of the key messages from the latest bank lending survey from the euro area (chart 6).

    • Core goods prices increase minimally.
    • Services prices advance steadily.
    • Energy prices decline, but food prices rise significantly.