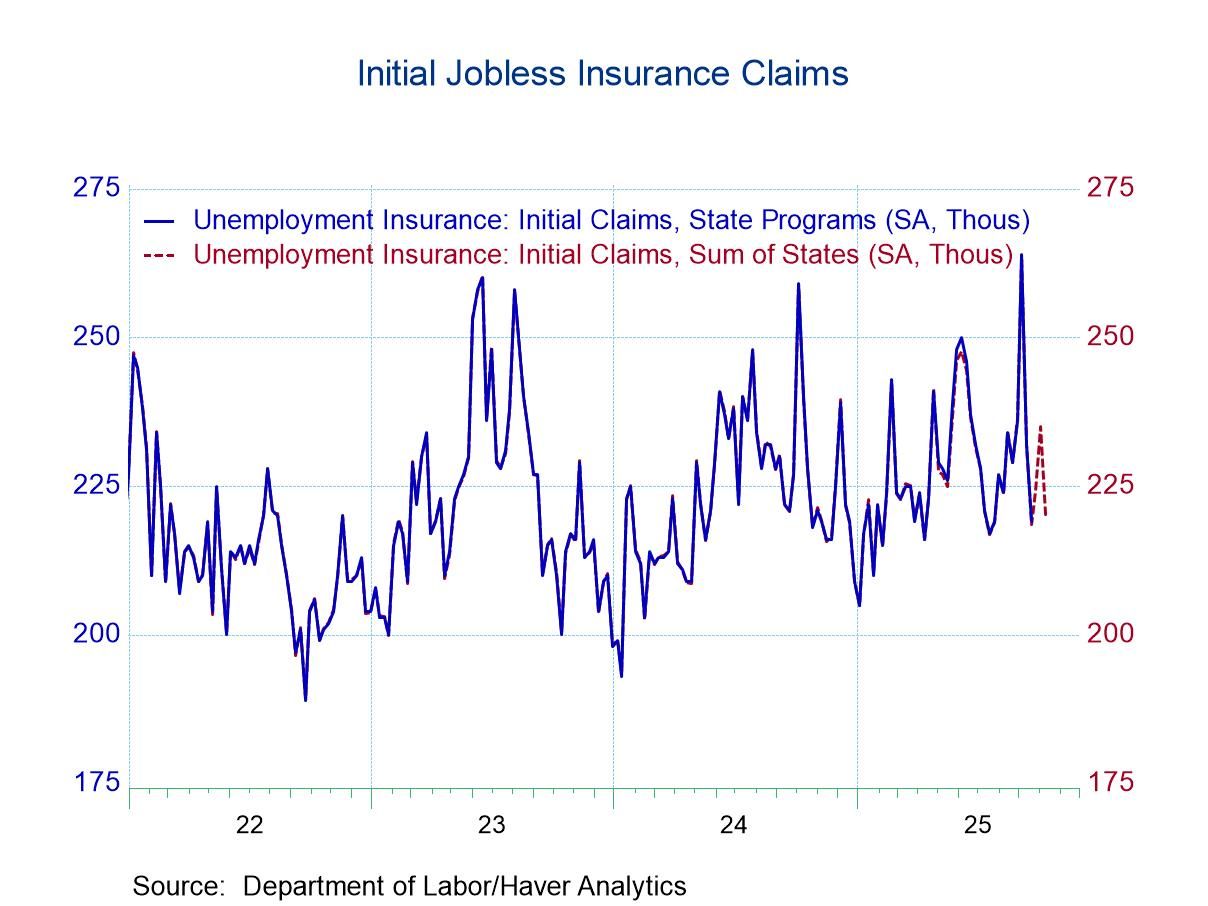
- Initial claims decline, reversing earlier increase.
- Continuing claims move lower.
- State unemployment rates vary.
 USA| Oct 23 2025
U.S. Unemployment Insurance Claims Ease in Latest Week
by:Tom Moeller
|in:Economy in Brief
 USA| Oct 23 2025
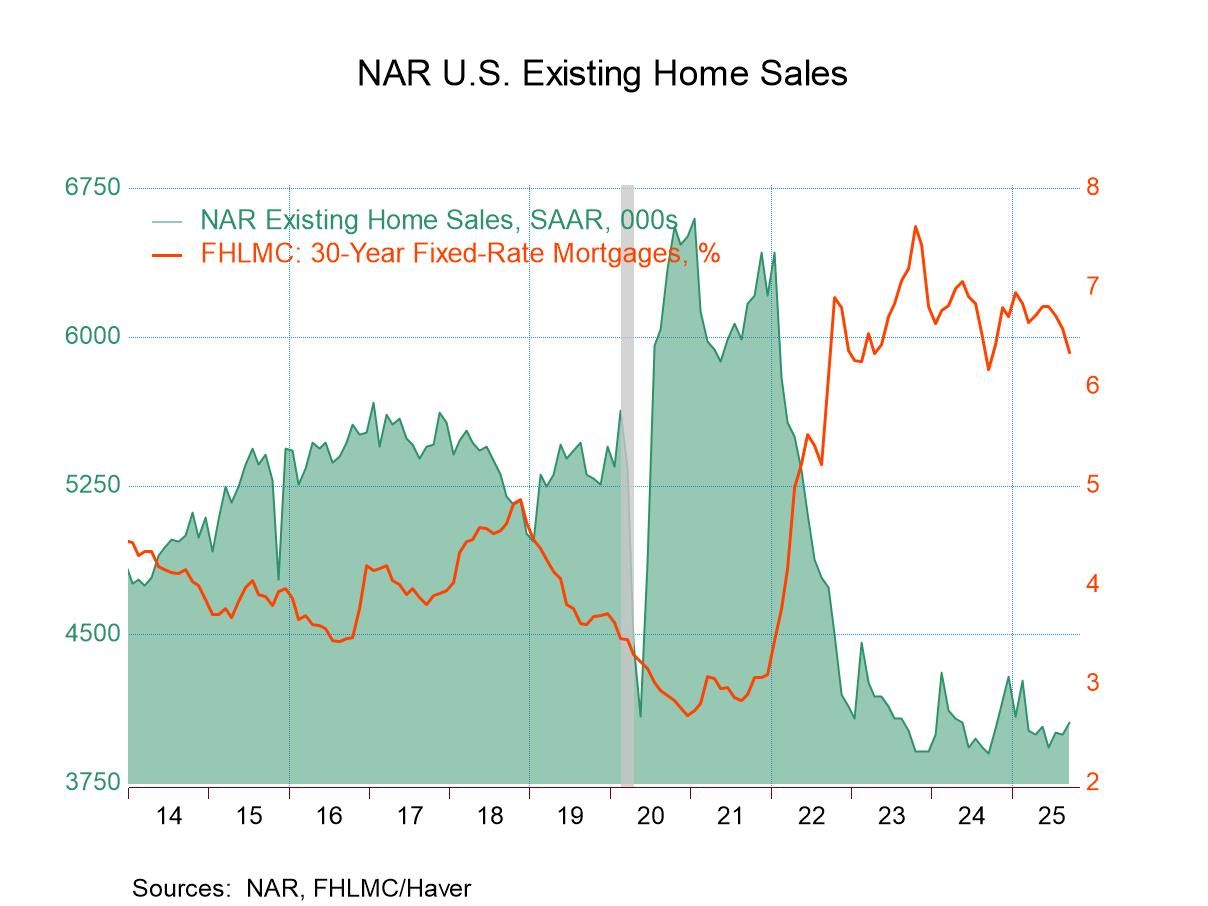
U.S. Existing Home Sales Rise in September; Prices Decline
- Home sales reach their highest level in seven months.
- Sales are slightly higher m/m in most of country.
- Median sales price falls in most of country.
by:Tom Moeller
|in:Economy in Brief
 United Kingdom| Oct 23 2025
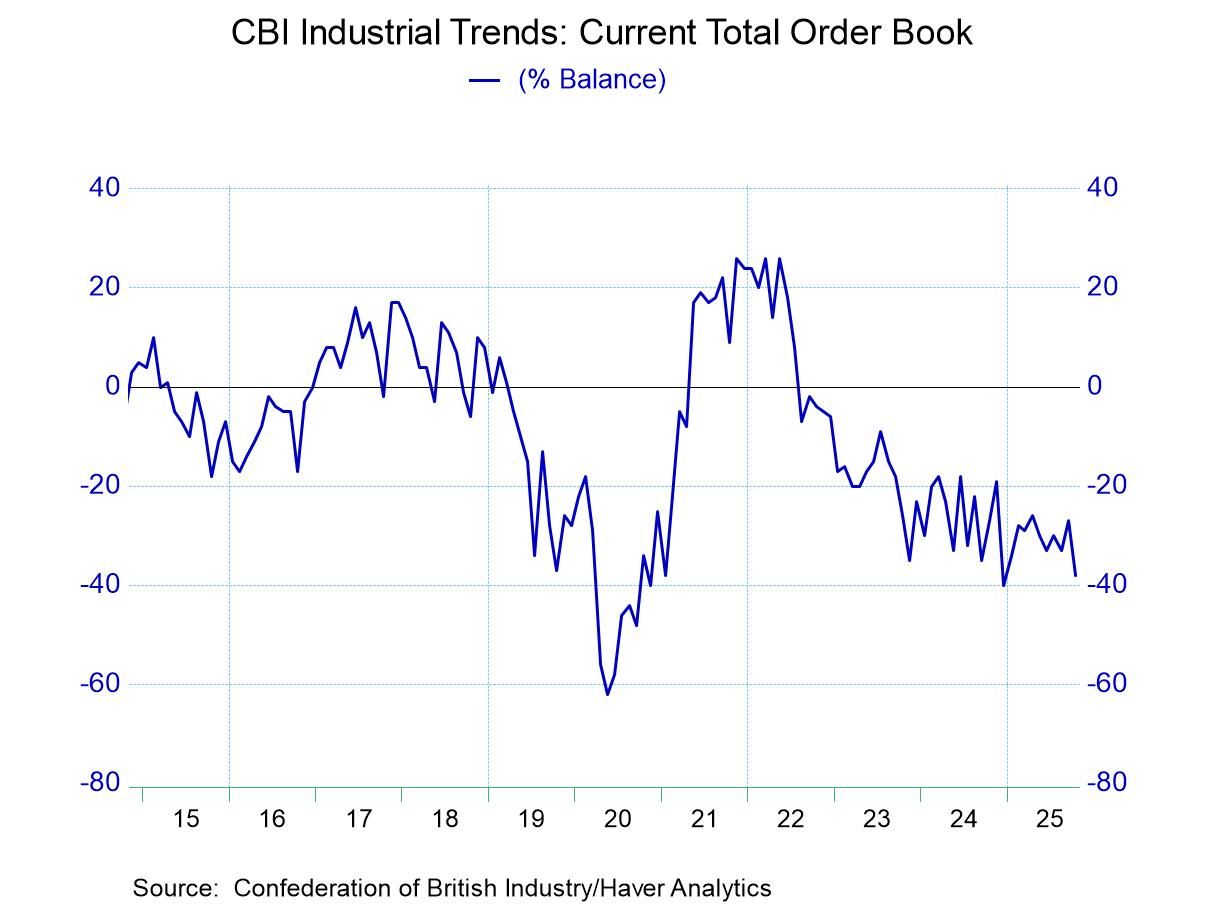
UK CBI Industrial Orders Drop as Prospects Fade
Industrial orders in the United Kingdom fell to a reading of -38 in October from -27 in September this compares also to a level of -33 and August. The 12-months to 6-months to 3-month average progression shows steady deterioration for orders with the 12-month average at a -31 reading, compared to the October reading of -38. Dated back to 1991 the current orders reading ranks in the lower 8% of its historic queue of data, among the observations on that timeline marking this as an exceptionally weak reading on the month and, underpinning the notion, that growth in the UK is weakening and perhaps providing for the Bank of England a way to avoid raising rates in the face of what continues to be excessive inflation.
Export orders also slipped in the month to -46 compared to a reading of -32 in September and -33 in August. Export orders also have deteriorated steadily as the 12-month, the six-month, and the three-month averages are becoming sequentially weaker. Comparisons show the 612-month average at -33 to this month's -46 reading. The percentile standing for export orders is similarly weak to overall orders at a 7-percentile standing.
Looking ahead, the output volume for the next three months finds the index at -19, down from -14 in September and -13 in August. The sequential reading on this metric weakens as well from readings of -9 over 12-months to -12 over 6-months to -15 over 3 months. All that compares to the current October reading of -19. The deterioration there is clearly in place; the queue percentile standing of the October level is at 6%, marking it, once again, as exceptionally weak.
Looking at the prices over the next three months brings an unfortunate increase to 16 from 4 in September and 9 in August. However, the expected inflation results are not on the same deteriorating path as orders trend and expected output. Despite the monthly jump in October, the 12-month average of ‘expected inflation’ is 18, that's reduced to 16 over 6-months and further reduced to 10 over 3 months. The jump in October is a jump that is away from trend, and I suppose we will have to wait to see where it settles in. The trending results for inflation are somewhat more encouraging. The jump in October is quite discouraging although it does come against the background of weakening economic data which simply puts the central bank in a more difficult position to make a policy decision. Price expectations for 3-months ahead have a ranking in their 73rd percentile meaning that they have been stronger a little more than 25% of the time on data back to 1991.
The PMI industrial indicator is up to date through September; here we have a comparison of the manufacturing PMI to the CBI survey. The manufacturing PMI eased to 46.2 from 47 in September. The manufacturing PMI on averages over 12-months, 6-months and 3-months is without a clear trend and has been fluctuating. The manufacturing PMI on data back to 2021 has a 12-percentile standing. The clear message is that conditions in manufacturing in the UK are very weak as the CBI and PMI percentile standings agree. Combined with the CBI inflation outlook, it leaves the BOE in a difficult place.
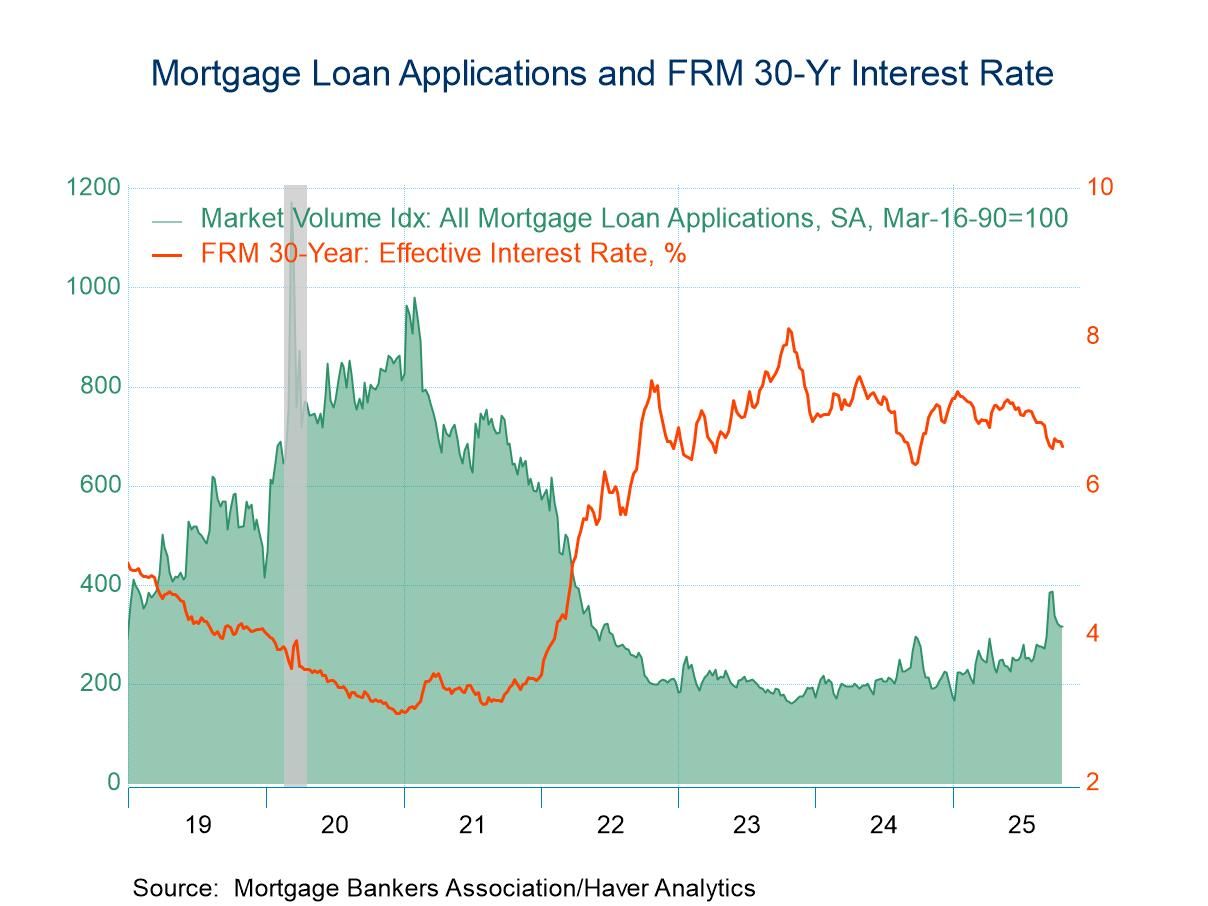
- Mortgage applications decline for fourth straight week.
- Purchase applications fall sharply as refinancing increases.
- Mortgage interest rates fall.
by:Tom Moeller
|in:Economy in Brief
 United Kingdom| Oct 22 2025
The Core Inflation Metric Looks Best for the UK
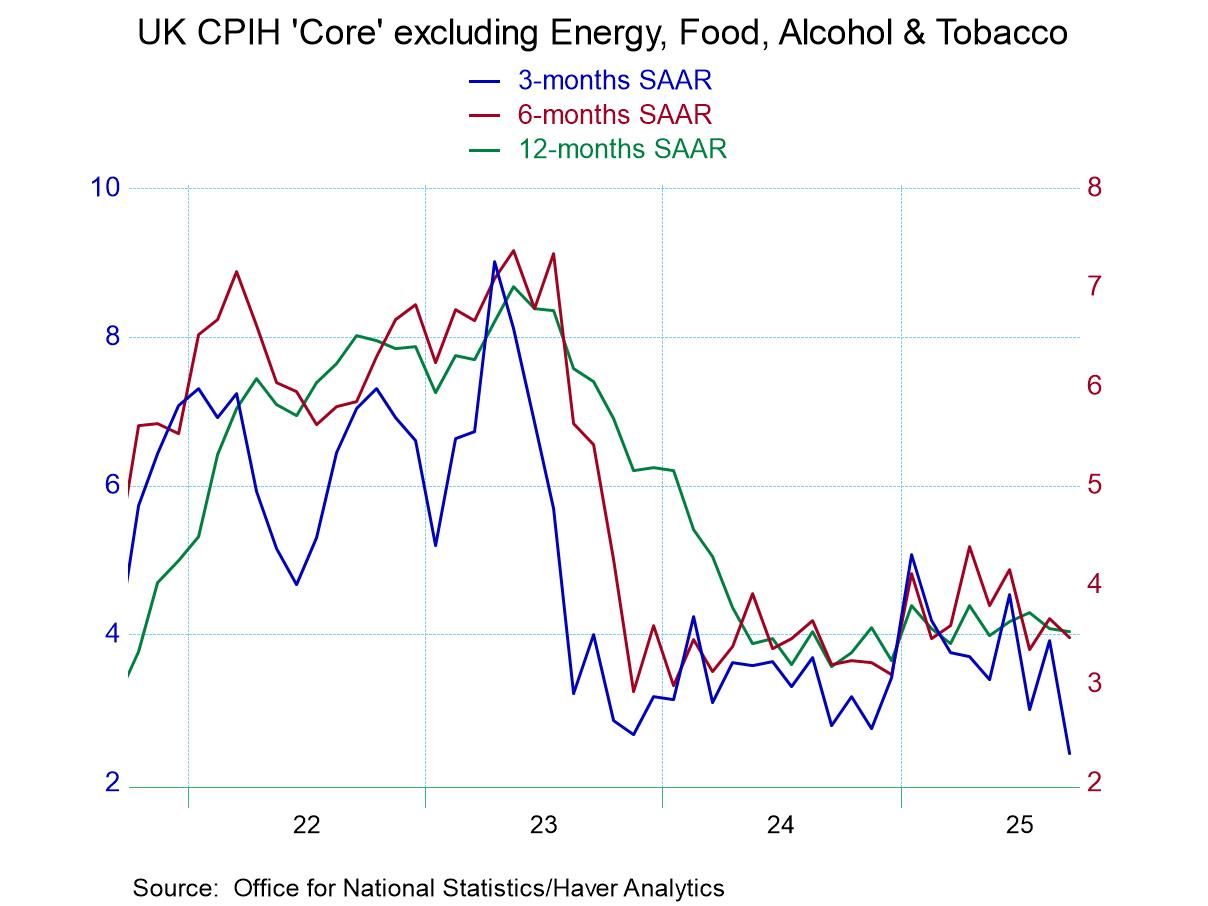
Inflation in the UK rose by 0.1% according to the CPI headline in September. This was a step down from the 0.3% increase in August. The core CPI-H (excluding, energy, food, alcohol, and tobacco) rose by 0.2% in September, the same as in August and in July. Sequentially the CPI-H rose 4.1% over 12-months, rose at a 3.8% annual rate over six-months, and rose at a 3.3% annual rate over 3-months for the headline CPI-H. That marks a clear decelerating pattern from 12-months to 6-months to 3-months. That same phenomenon is reproduced by the core, where the year-over-year inflation rate is 4% ,the 6-month annual rate drops to 3.5%, and the 3-month rate drops again to 2.7%.
This is good news for the UK. Inflation has been excessive for quite some time. The Headline and core metrics showed year-on-year gains of 2% or less last in July of 2021 a period of over four years. The chart at the top of this report shows the sequential inflation rate plotted for the core CPI-H. In plotting that I'm plotting the measure that looks the best because the headline CPI-H does not decline anywhere near as much as the core does. However, since the core is more permanent and less fickle in its trend it's probably the better way to look at inflation in the UK as well as at the progress being made and to think about the policy options.
The diffusion calculation by month which looks at the categories and looks at the percentage that are accelerating versus decelerating, shows only 9% of categories accelerating in September, 45% accelerated in August, and 45% accelerated in July. That means for the last three months the monthly categories were generally showing lower inflation across most categories than they had in the month before.
The table also replicates diffusion calculations for 12-months, 6-months, and 3-months; in each case diffusion is compared to the previous period on the table. 12-month inflation accelerates in 45% of the categories compared to a year-ago 6-month inflation accelerates in only 27% of the categories compared to the 12-month horizon while over 3-months only 18% of the categories accelerate compared to 6-months. Once again, these categories show us that inflation is decelerating broadly across these categories underpinning the sense of good news that we see in both the headline and in the core as each is showing inflation on a decelerating profile.
Meanwhile, on the unemployment front, the UK unemployment rate is mildly rising from a 4.1% rate 12-months ago to 4.4% 6-months ago to 4.7% 3- months ago. The most up-to-date reading on the unemployment rate is for July and that's a reading of 4.8%. The unemployment rate has clearly been creeping up and that 4.8% has about a 40th percentile standing in the queue of data on unemployment back to early 2000. The unemployment rate standing is still below its median however it's beginning to creep up. The claimant rate of unemployment is slightly more up-to-date as we have a figure as of August. Even though the claimant rate is lower than the unemployment rate, historically it has usually been lower so that the percentile ranking of that rate is actually much higher than for the overall unemployment rate at 71%. That is a bit more disturbing.
Still, if we rank inflation in the UK as of September the year over year inflation rate compared to where inflation has been since early 2000, that rate ranking continues to be a high. At the level of 4.1% year-over-year rate translates into 87 percentile standing while the 4% core rate translates into an 85-percentile standing. Only two categories and the CPI-H have standings below their 50th percentile; one is for furniture household equipment & maintenance and the other category is miscellaneous goods and services.
How we view inflation in the UK has a lot to do with which of the profiles we really want to look at to be the policy focus. If we insist on looking at year-over-year inflation the inflation is still too high and stubborn, however, if we look at the 3-month inflation rates, inflation is much lower and making much better progress toward the Bank of England's goals. Economic data have been weakening that's something that could push the Bank of England toward rate cuts even with the excessive inflation numbers that it's printing because it makes the economy seem to be slipping into a period of weakness. In that event, the BOE might expect that the period of weakness will do a lot of ‘the work’ in terms of getting the inflation rate lower.
This is going to be something to watch and the upcoming weeks not just as the Bank of England prepares for its next meeting but farther than that is it assesses whether it’s concerned about reducing inflation now or whether it thinks that growth is already on a reduction path that will allow it to shift gears and try to cushion the economy as it slows down. The Bank of England is facing a policy dilemma and it will bear watching to see which prong of the dilemma it chooses to emphasize
 New Zealand| Oct 21 2025
New Zealand Trade Shoots to Surplus on Export/Import Twist
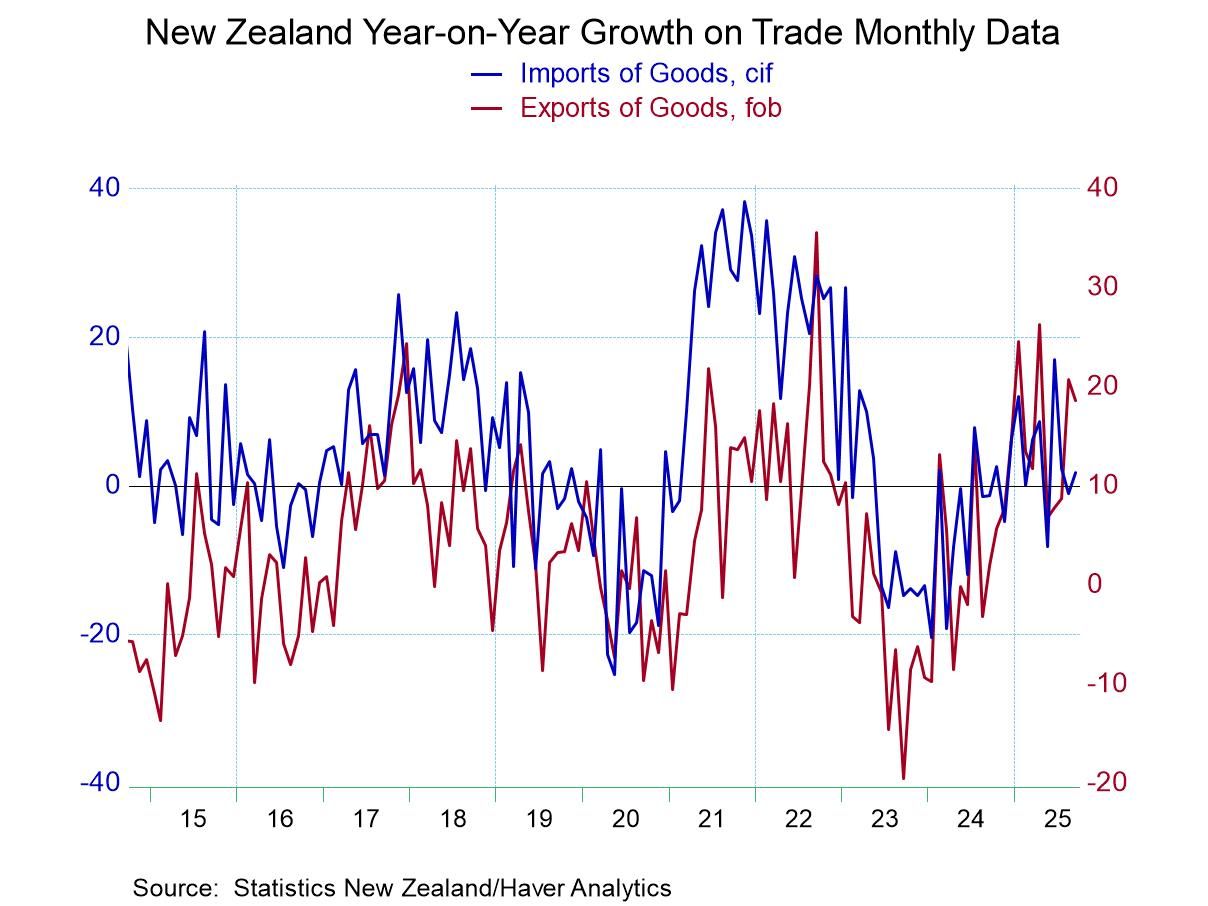
New Zealand exports surged in August as imports plunged causing a twist in the in the month-to-month trade balance that was thrust into a modestly positive surplus from a deeply negative position in July on these trends. New Zealand trade moved into a surplus of $NZ305 million, compared to a deficit of $NZ703 million in July The progression of deficits shows A 12-month monthly average monthly deficit of $NZ265 mln, a six-month monthly average deficit of $NZ137 mln and then an expanded monthly average deficit of NZ$278 mln over three-months.
Exports rose by 20.8% over 12-months; export performance then cools over six-months followed by an exports surge of 35.5% over 3-months. This is in sharp contrast to imports, where imports fall by 1.1% over 12-months then fall at a 10.3% annual rate over six-months before recovering to rise at a meager 0.9% annual rate over 3-months.
New Zealand's international reserves excluding gold have continued to creep up sequentially. Inflation has hovered around the 2.5% to 2.7% since March of this year ending a period during which New Zealand inflation consistently overshot inflation in the US.
New Zealand's exports are and have been showing life better than imports for some time. Ten-year NZ government bond yields have been stuck in the 4% to 4 1/2% range. New Zealand's GDP growth has been locked in an extremely low range with negative GDP growth logged in the last three quarters of last year. It is displaying erratic and continued weak performance in 2025. The import restraint recorded in the trade accounts reflects weak domestic demand that stems from weak GDP growth.
The NZ CPI that has stabilized but also shows the potential to have ceased falling and may be mounting a period of some minor acceleration starting at rates around or below 2.5%. However, core inflation remains restrained and still in a declining mode – a strong counterpoint to the potential for acceleration. Meanwhile, the unemployment rate has been pressured higher. In the second quarter it shot back up to 5.2%, which is the peak that it experienced during Covid in 2020. New Zealand's current account deficit as of the second quarter continues to shrink, Economic weakness should keep interest rates headed lower and keep inflation contained for at least the balance of the year.
 USA| Oct 21 2025
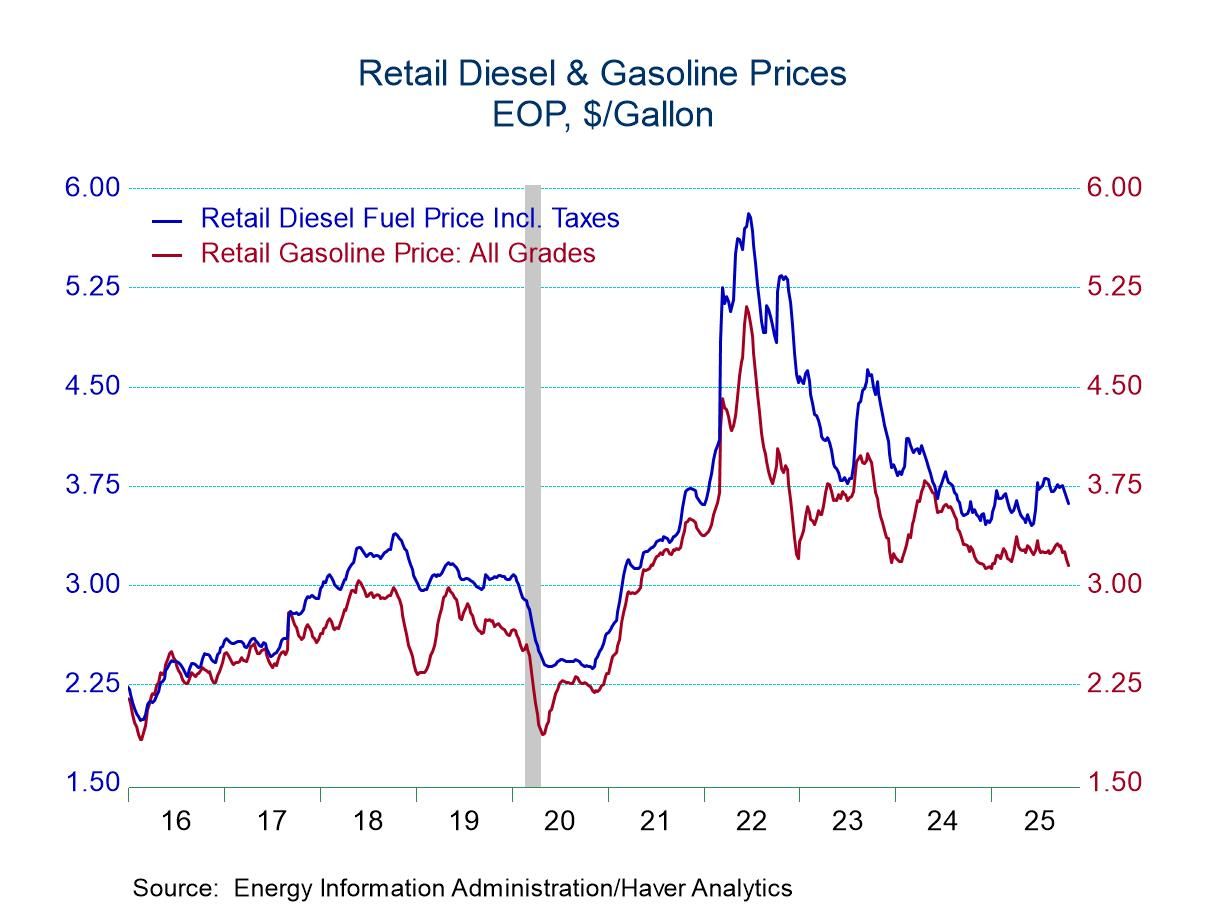
U.S. Energy Prices Decline in Latest Week
- Retail gasoline prices drop sharply in latest week.
- The price of WTI crude oil falls to lowest since 2021.
- Natural gas prices decline to November low.
by:Tom Moeller
|in:Economy in Brief
 Germany| Oct 20 2025
German PPI Continues to Behave
Inflation reports are still very much of market interest largely because inflation remains in the forefront, sufficiently contained, to allow central banks to choose a policy course of easing monetary policy. To stay on that course, they will need for inflation to remain under control.
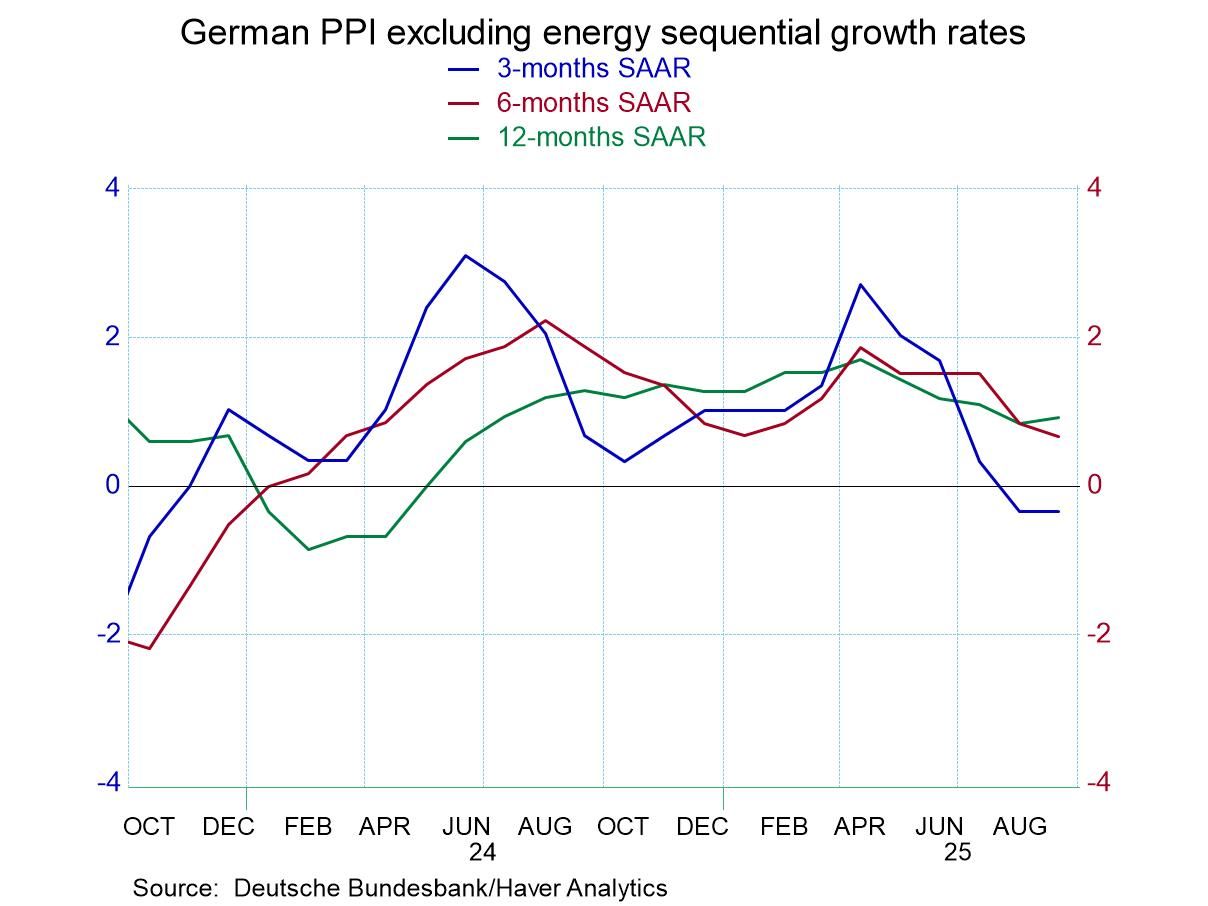
The German PPI in September is flat after falling 0.5 in August and rising only 0.1% in July. The PPI excluding energy has flattened in July, fallen by 0.2% in August and is up by only 0.1% in September. Both of these PPI series generate significant optimism sequentially as well. The PPI headline series falls by 1.7% over 12 months; it falls at a 2.5% annual rate over 6-months, and it falls at a 1.6% annual rate over 3-months; its change is negative on all three horizons. Inflation is quite contained and reinforcing of the theme of cutting interest rates from the standpoint of the monetary authorities.
For the PPI excluding energy inflation is up by 0.9%, Over 12-months it rises at a slower 0.7% annual rate over six-months and the PPI excluding energy falls by 0.3% over 3-months. The contained status of headline inflation is thus translated into the core so that the sequential core pattern shows inflation progressively lower measured over longer to shorter periods. For the German economy, its good news from the standpoint of inflation although part of the cost of this is that the German economy has been exceptionally weak.
The details of the PPI are a little bit less interesting because they're not seasonally adjusted, however, consumer goods, investment goods, and intermediate goods, trends are working lower.
Comparing the PPI to the CPI - and to the CPI excluding energy - we see that the excellent PPI trends do not translate directly into solid CPI inflation. CPI inflation is somewhat erratic but at 2.4% over 12-months and at 3% over three months, and the CPI ex-energy at 2.6% over 12-months and much higher at 3.4% at an annual rate over three-months, the German CPI has more work to do.
Still the underpinning of a solid PPI report is reassuring. With Brent oil prices off by about 7% over 12-months and falling at a 15% annual rate over three-months, the beneficial inflation trend is being driven by weakness in oil prices. And that does help the PPI more and faster than the CPI.
- of7Go to 3 page