 Global| Oct 02 2025
Charts of the Week: Signals, Surprises and Shifts
by:Andrew Cates
|in:Economy in Brief
Summary
Global financial markets have remained resilient in recent days, supported by a combination of easing inflation concerns, steady growth data, and hopes that geopolitical risks may ease following news of a potential Israel–Gaza peace plan. At the same time, investors are watching closely for signs of a US government shutdown, which could delay the release of key economic indicators, including Friday’s nonfarm payrolls report. Against this backdrop, the charts this week highlight a set of themes shaping the outlook. Policy rate expectations have shifted little, with markets still pricing in further cuts across most major economies over the next 12 months, with Japan the notable outlier (chart 1). In the meantime, optimism surrounding AI’s productivity potential continues to drive market sentiment, and while hard evidence in the data remains limited, there are tentative signs of improvement—global growth surprises have been positive (chart 2), US productivity and business formation are showing some improvement (charts 3 and 4), and semiconductor trade is rebounding as AI-related demand rises (chart 5). Yet caution is warranted: formal productivity measures may still reflect post-COVID cyclical effects, and the upswing in military spending underscores how geopolitical instability is also driving global investment trends, tempering the more upbeat AI narrative (chart 6).
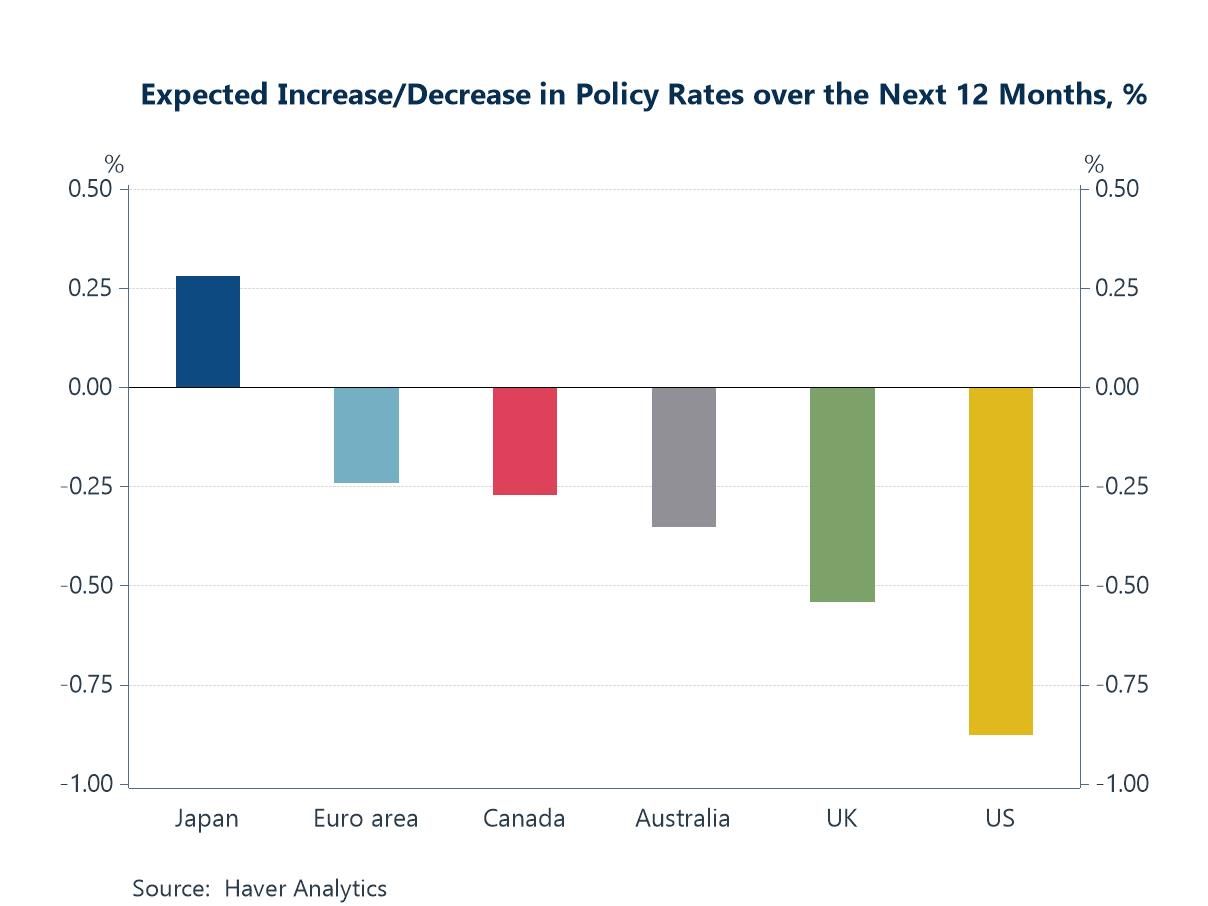
Policy rate expectations Interest rate expectations have edged toward a milder easing profile in recent months—largely because several central banks are already well into their easing cycles. Based on the latest Blue Chip Financial Forecasts survey, the consensus now looks for the largest cuts in the US (≈–0.9 percentage points) and a smaller move in the UK (≈–0.5pp) over the next 12 months. Expected declines are more limited in Australia (≈–0.35pp), Canada (≈–0.25pp) and the euro area (≈–0.25pp), reflecting the late-cycle phase of easing already delivered. Japan remains the outlier on the upside (≈+0.25–0.30pp) as the Bank of Japan continues a gradual normalisation. The pattern points to cautious, data-dependent central banks: some scope to trim rates where growth is cooling, but a softer glide path in economies that have already banked meaningful cuts.
Chart 1: Expected policy rate changes over the next 12 months
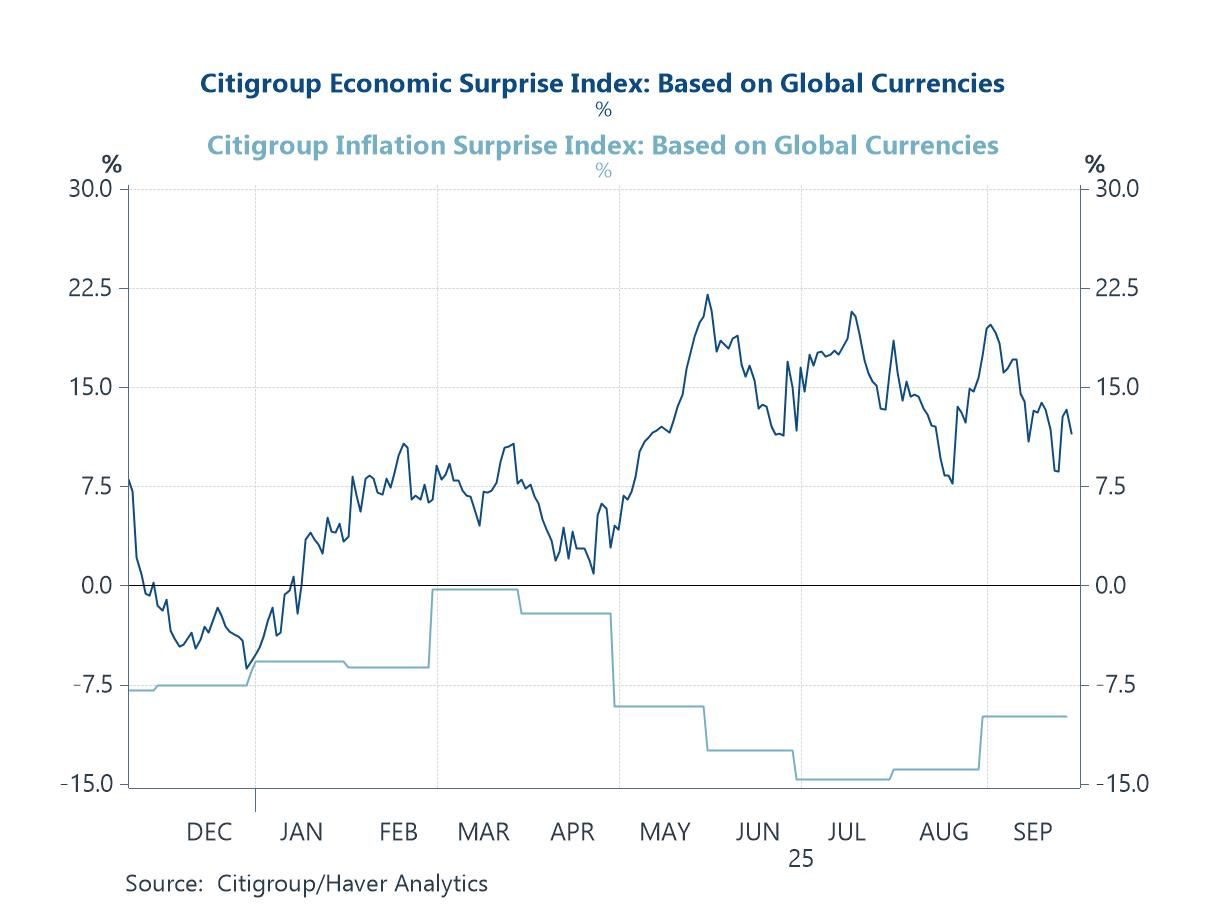
Signals of supply-side resilience Equity markets have been buoyed by hopes that AI-driven productivity gains will provide a new leg of support for global growth, though hard evidence in the macro data remains elusive. One encouraging sign, however, comes from high-frequency indicators such as the Citigroup Economic Surprise Index, which has shown a steady run of upside surprises in global growth data over the past several months. At the same time, the Inflation Surprise Index has persistently undershot expectations, pointing to milder-than-feared price pressures. Taken together, these developments hint at possible supply-side improvements—consistent with the idea that productivity may be quietly strengthening, even if traditional measures are slow to capture it. The question for investors is whether this early pattern is sustainable or merely a temporary alignment of cyclical forces.
Chart 2: Global growth and inflation surprises
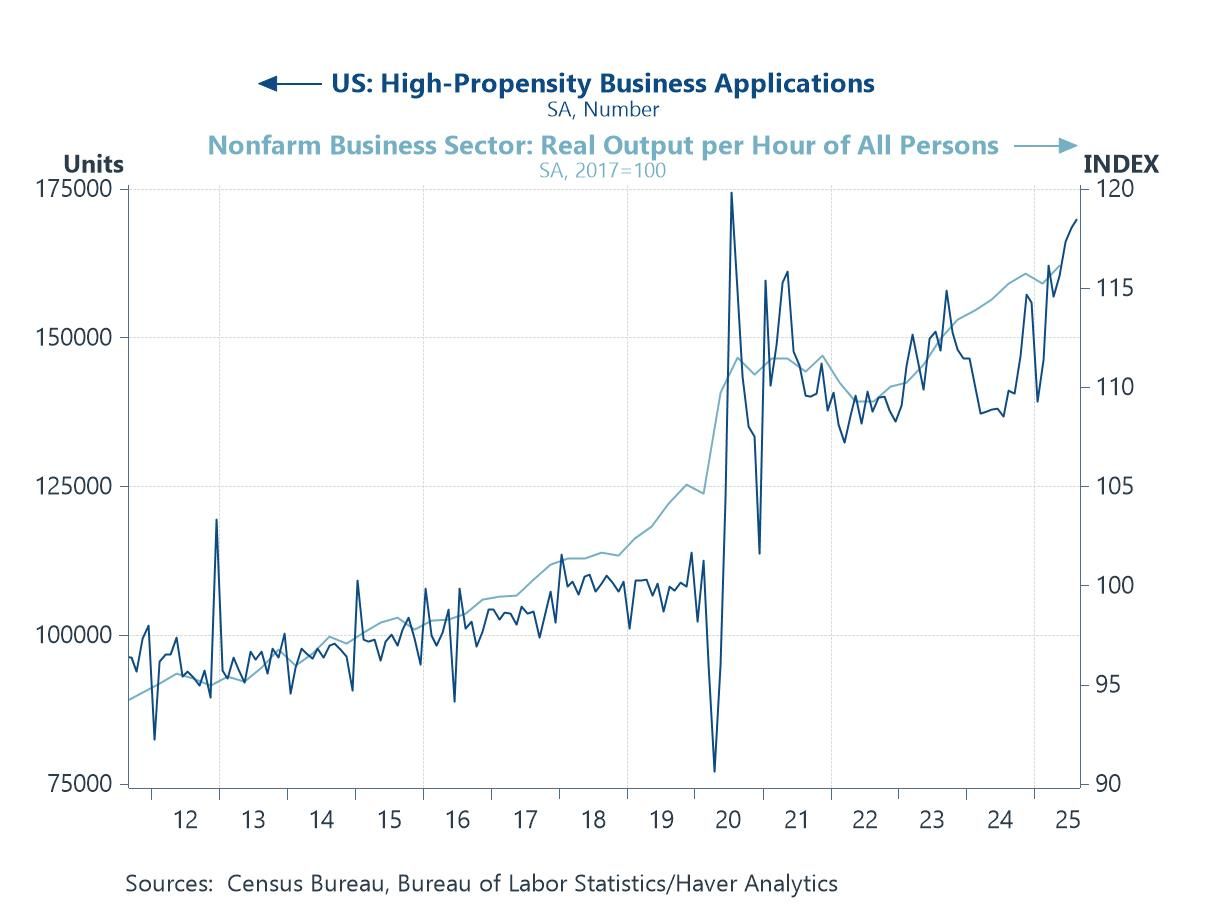
US company formation Another piece of evidence that hints at a possible shift in US productivity dynamics comes from the combination of rising business formation and stronger measured output per hour. Applications for high-propensity businesses—those most likely to generate sustained employment—have climbed markedly in recent years, and in parallel official productivity data have also shown a clear upturn since the pandemic shock. While both series are volatile and subject to revision, the persistence of this improvement suggests that the US may be entering a more dynamic phase of firm creation and efficiency gains. If AI adoption is acting as a catalyst for both new business models and more efficient production, then these developments could represent an early macro-level reflection of that trend.
Chart 3: US business formation and productivity
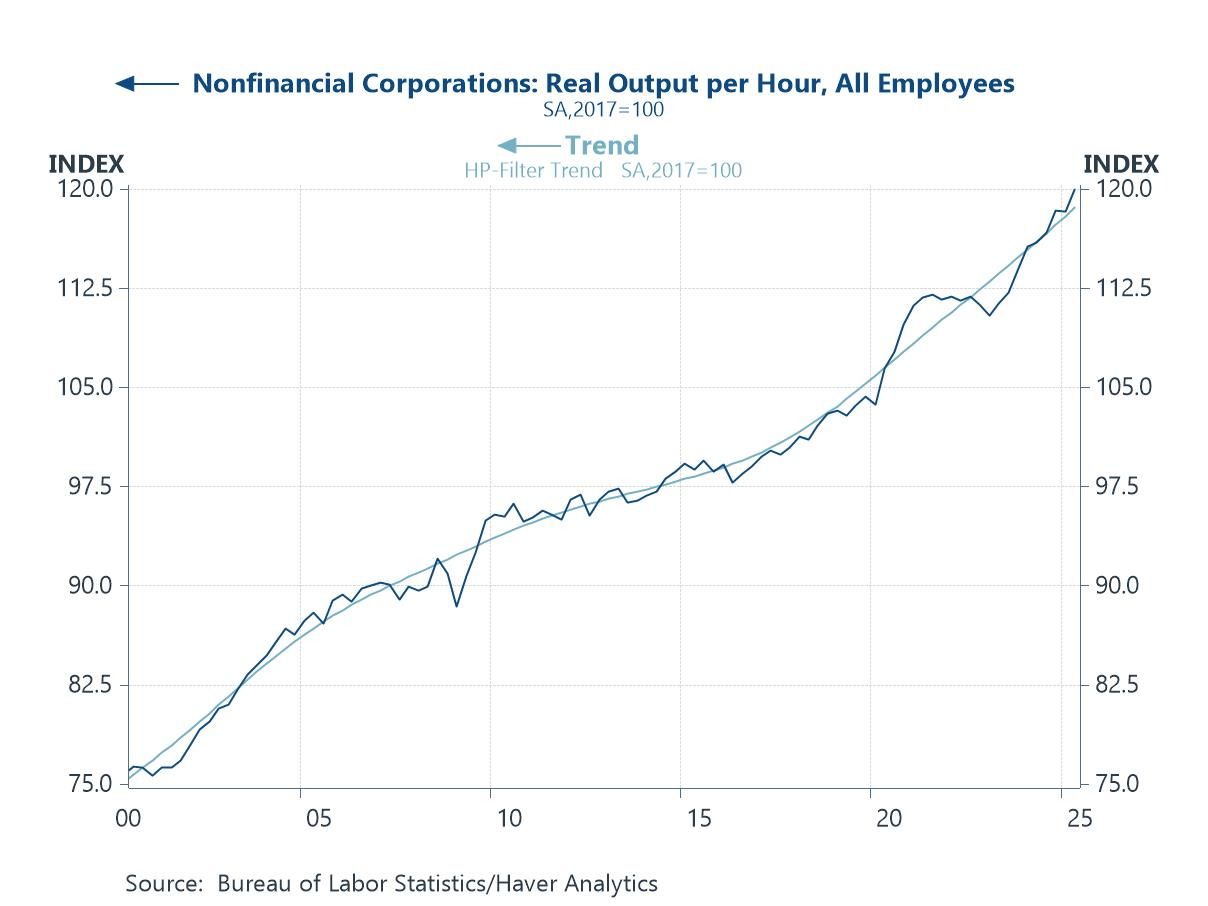
US productivity trends Formal productivity gauges for the non-financial corporate sector have lifted above trend, but the rebound should be treated cautiously. Much of the recent strength may reflect post-COVID normalization—hours and capacity settling after stop-start disruptions, compositional shifts as weaker firms exited and re-entered, and cyclical capital deepening as investment caught up—alongside measurement noise and future revisions. These data are consistent with the possibility of underlying efficiency gains, including from digital and AI adoption, but they are not yet proof of a structural break. We’ll need sustained outperformance across multiple data vintages—and through a softer growth patch—to distinguish a true productivity revival from a cyclical bounce-back.
Chart 4: Non-financial US corporate productivity vs trend
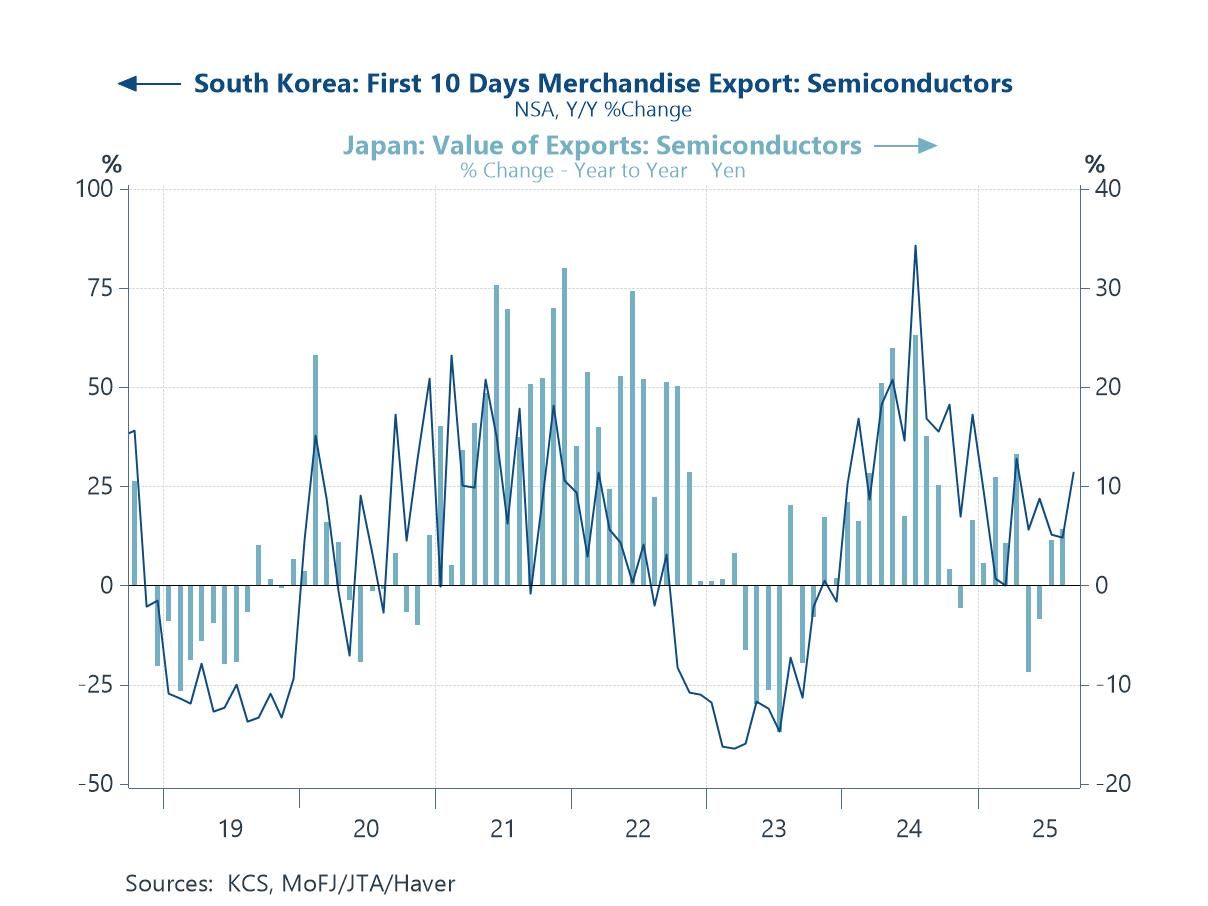
Semiconductor trade One area where the footprint of AI investment is already visible is in the semiconductor trade data. South Korea’s early export figures and Japan’s shipment values both show a sharp rebound over the past year, reversing the slump seen in 2022–23. Given that advanced chips are the essential input for AI infrastructure—from data centres to training models—this recovery provides a tangible sign of how global demand is being reshaped by the AI buildout. While semiconductor cycles are notoriously volatile and influenced by broader electronics demand, the scale and persistence of the current upswing suggest something more structural may be at play, reinforcing the idea that AI-related capital spending is starting to leave a measurable imprint on global trade flows.
Chart 5: South Korea’s and Japan’s semiconductor exports
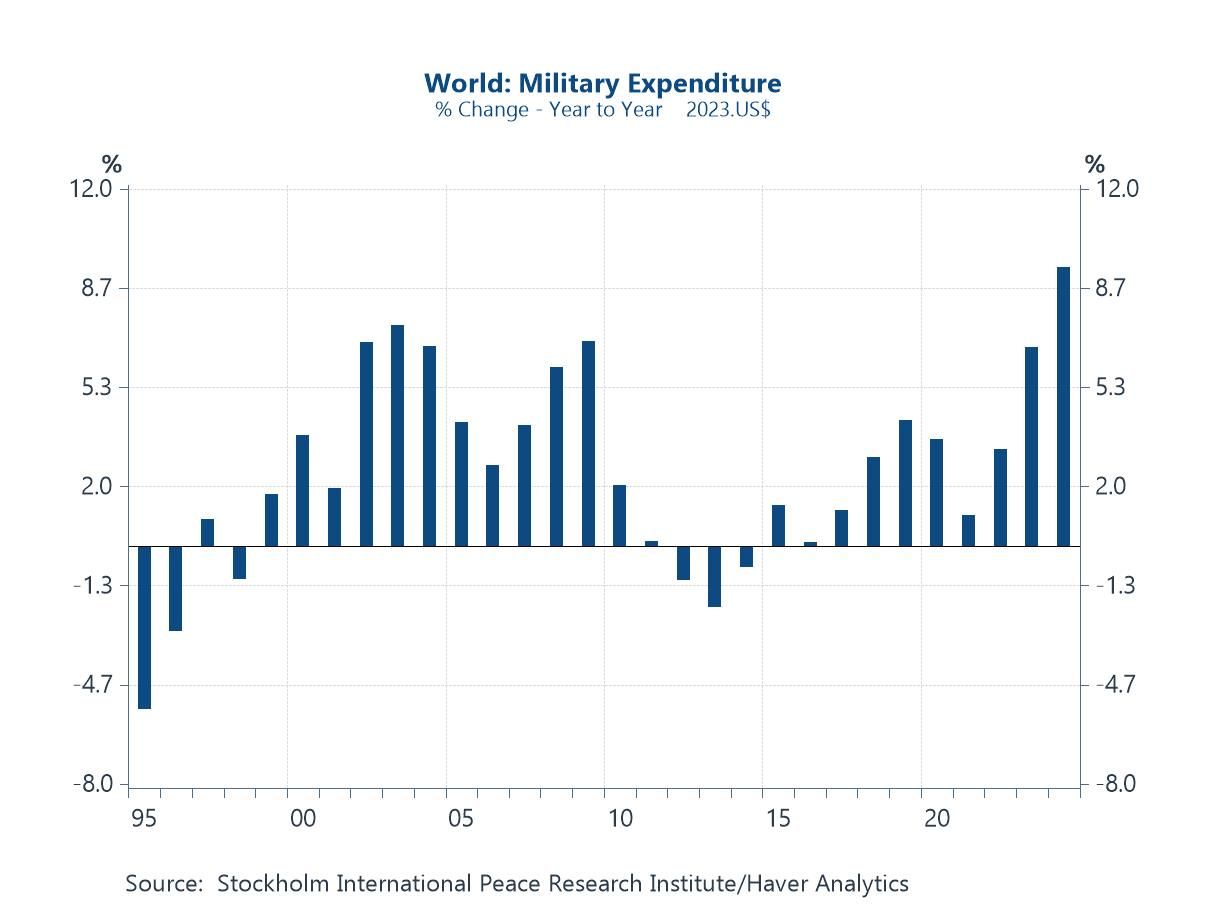
Global defence spending While AI investment has dominated headlines as a prospective driver of global growth, it is important not to overlook other forces shaping capital spending. Defence outlays have accelerated, and while they are often prompted by geopolitical risk, parts of this spending can be productivity-enhancing—for example, investment in cyber security, advanced computing, space and satellite networks, resilient supply chains, and dual-use manufacturing that diffuses into the civilian economy. Even so, the opportunity cost and signalling effect of higher military budgets matter: they can crowd out other forms of capex, and the underlying uncertainty can weigh on trade, supply chains, and investor confidence. Taken together, these dynamics argue for caution: the AI boom may be fostering optimism about a new productivity era, but the broader backdrop—marked by rising defence demand with mixed spillovers and uneven sources of capex—still leaves the outlook fragile.
Chart 6: Global military expenditure growth

Andrew Cates
AuthorMore in Author Profile »Andy Cates joined Haver Analytics as a Senior Economist in 2020. Andy has more than 25 years of experience forecasting the global economic outlook and in assessing the implications for policy settings and financial markets. He has held various senior positions in London in a number of Investment Banks including as Head of Developed Markets Economics at Nomura and as Chief Eurozone Economist at RBS. These followed a spell of 21 years as Senior International Economist at UBS, 5 of which were spent in Singapore. Prior to his time in financial services Andy was a UK economist at HM Treasury in London holding positions in the domestic forecasting and macroeconomic modelling units. He has a BA in Economics from the University of York and an MSc in Economics and Econometrics from the University of Southampton.


