

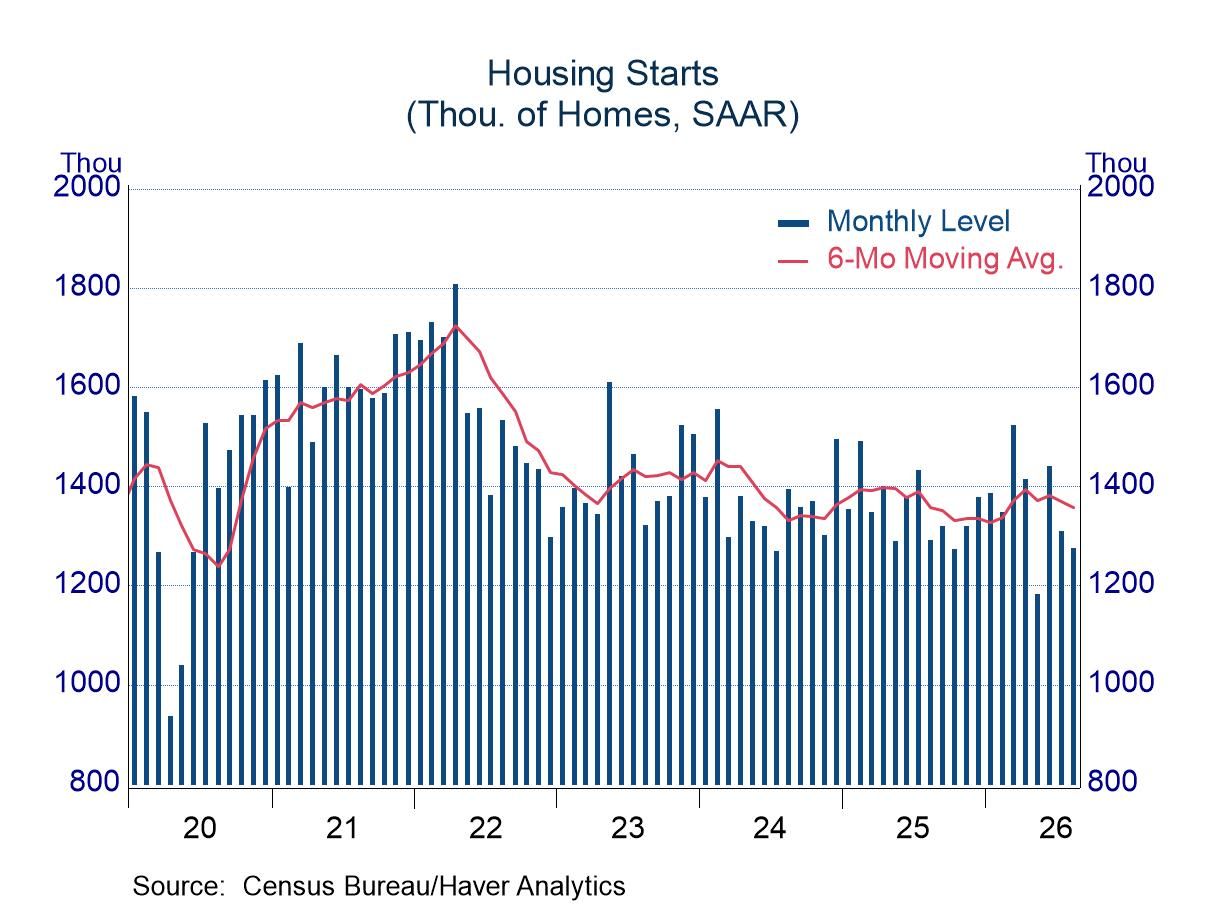
- A drop in multi-family activity in August offset a gain in the single-family sector.
- Q3 shaping up to be another soft quarter for housing.
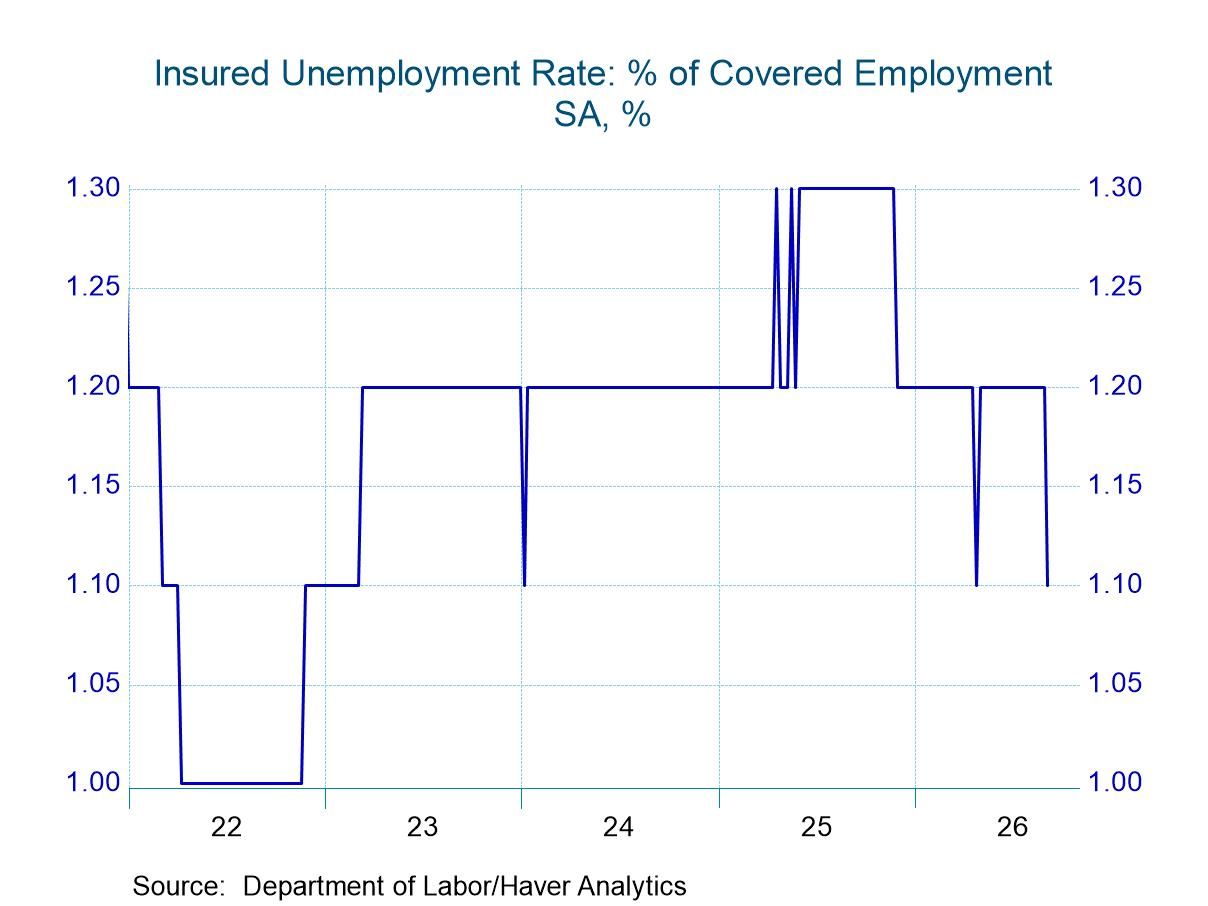
- New claims declined by 10,000 to 196,000 in the week of September 12.
- Continuing claims dropped by 39,000 to 1.730 million in the week ending September 5.
- The insured unemployment rate inched down to 1.1% in the week of September 5, the first drop since April 25.
 Europe| Sep 17 2026
EMU Inflation Pressure Remain over the Top but Not Intensifying
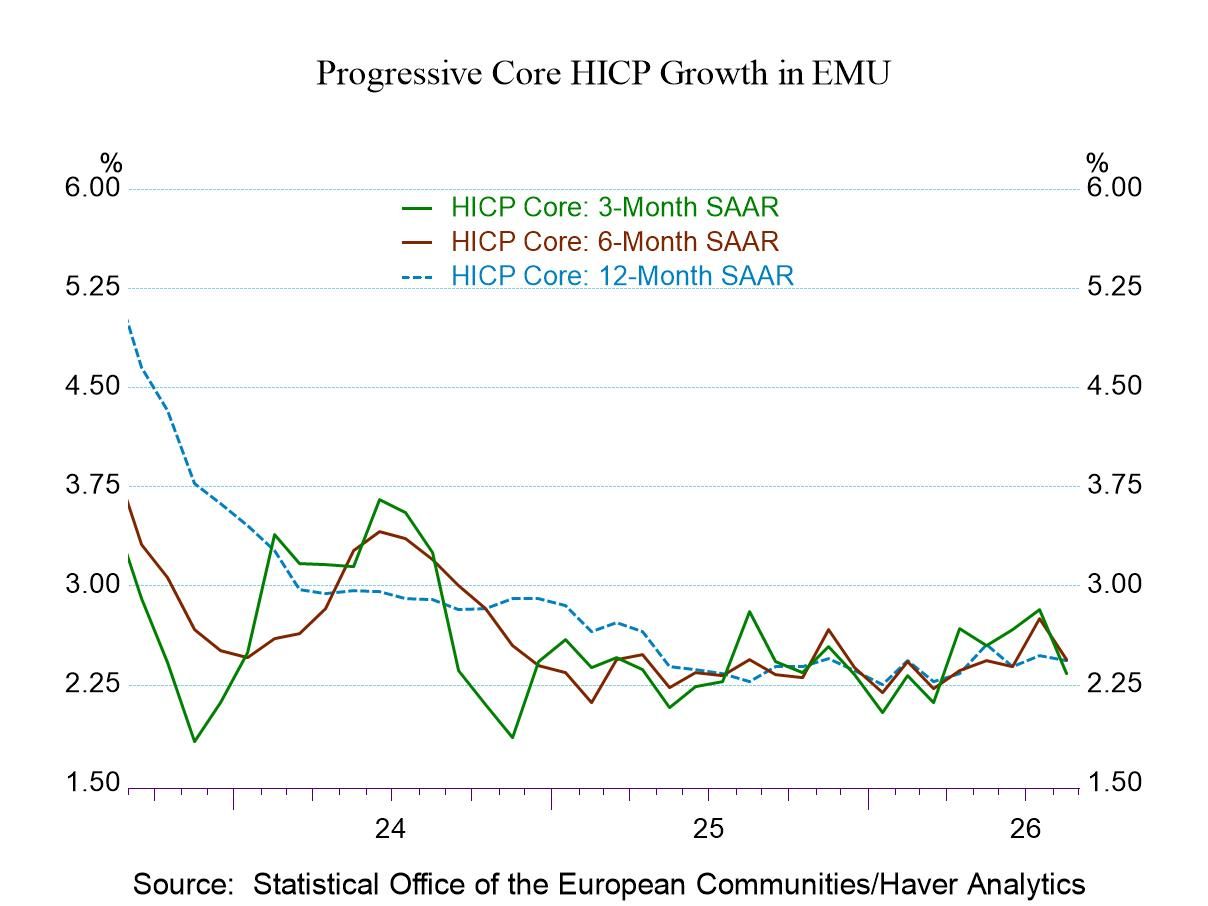
Inflation in the euro area rose by 0.4% in August after gaining 0.5% in July on the heels of a 0.1% decline in June. Sequentially, euro area inflation is up by 3.3% over 12 months, accelerates to a 4.5% annual rate over six months, and then settles back to a 3.4% pace over three months. Inflation is more excessive and stubborn than it is threatening.
Inflation excluding energy and unprocessed food rose a skinny 0.1% in August after a 0.3% gain in July and a 0.1% increase in June. This version of core inflation is up by 2.4% over 12 months and six months and then settles down to a 2.3% annual rate over three months. The ex-food, alcohol & tobacco core measure, similarly posted restrained monthly gains, with a sequential profile matching the ex-energy & ex-unprocessed food progression.
A cautious ECB On balance, headline inflation is too high largely because of energy, and this is not a surprise. However, core inflation is much closer to being in target. Still, it is excessive over 12 months, six months, and three months, but it's not even 1/2 of one percentage point too high at an annualized rate. Still, it is consistently higher by 0.3% to 0.4% on an annual rate. With energy prices flaring, the ECB is being careful.
Inflation pressure is not growing in breadth The details of inflation for the EMU 21-member inflation measure are similar to those headlines in the core inflation progressions. The details on inflation show that inflation is not broadly accelerating. Diffusion measures, which chronicle the proportion of categories with inflation accelerating, showed very restrained sub-50% readings for August and June, even though July’s relatively hotter increase showed inflation accelerating in nearly 85% of the categories. However, that bad-news month was sandwiched in between two good-news months. Looking at inflation over 12 months, six months, and three months, the diffusion progressions step down from 69.2% over 12 months to 53.8% over six months and to 30.8% over three months. Inflation's breadth has been pulling back progressively.
Inflation is consistently accelerating for furnishings, household equipment & maintenance, healthcare, and communications. However, those are the only three categories that show inflation consistently higher over 12 months, six months, and three months. Inflation is consistently lower over those three periods for alcoholic beverages & tobacco and for recreation & culture.
 USA| Sep 16 2026
U.S. Retail Sales Rebound in August, Exceeding Forecasts
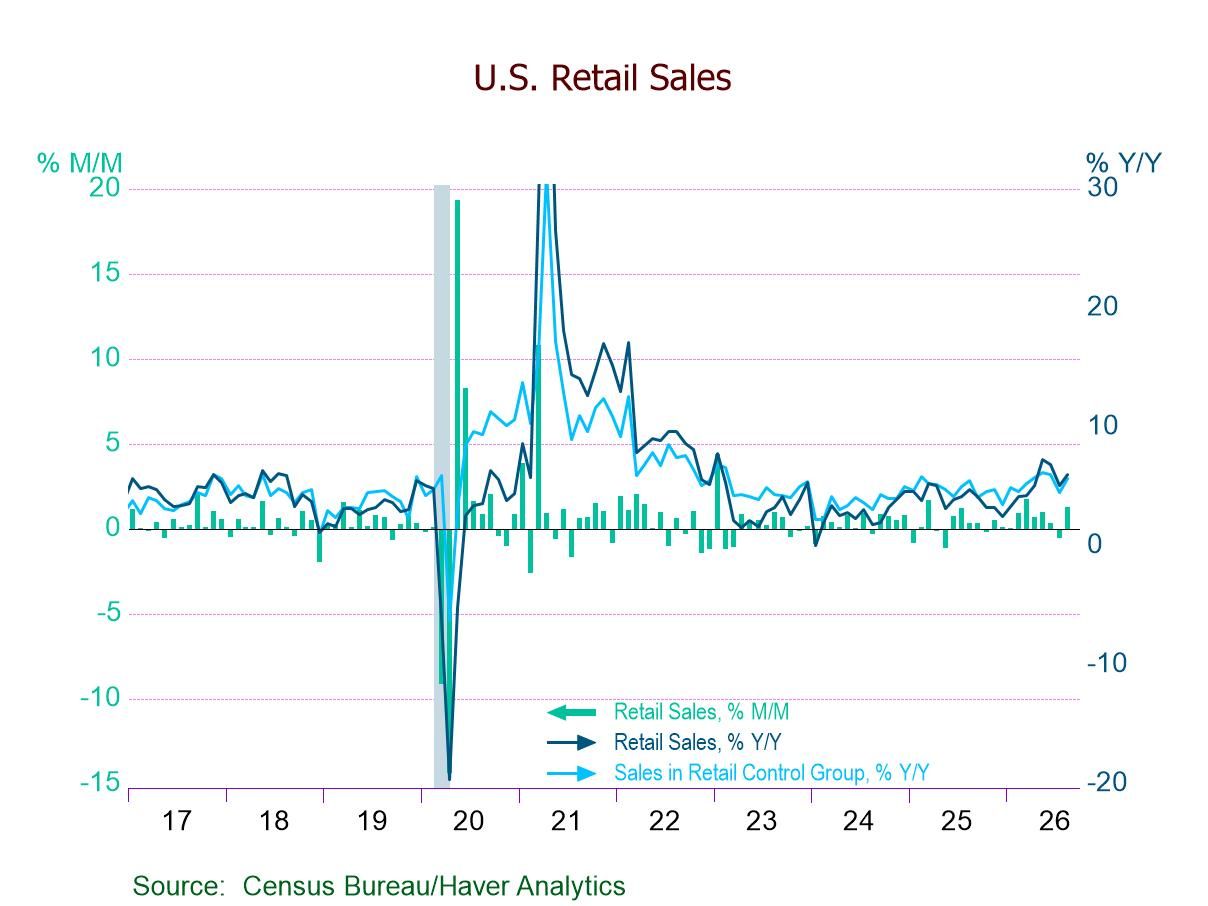
- Total retail sales +1.2% (+6.0% y/y) in August; sixth m/m increase in seven mths.
- Ex-auto sales +1.4% (+6.9% y/y), first m/m rise since May; auto sales +0.6% (+2.1% y/y), third rise in four mths.
- Ex-gas sales +1.1% (+4.9% y/y) and ex-auto & gas sales +1.2% (+5.6% y/y); both up m/m from Jan. through Aug. except July.
- Retail control group +1.4% (+5.6% y/y), seventh m/m gain in eight mths., pointing to solid underlying consumer demand in Q3 ’26.
- Gains m/m: gasoline stations (+3.1%), nonstore sales (+2.6%), misc. stores (+1.9%), electronics stores (+1.6%).
- Declines m/m: department stores (-0.8%), building materials & garden equipt. stores (-0.2%).
 Europe| Sep 16 2026
IP in EMU Shows Weakness Persists
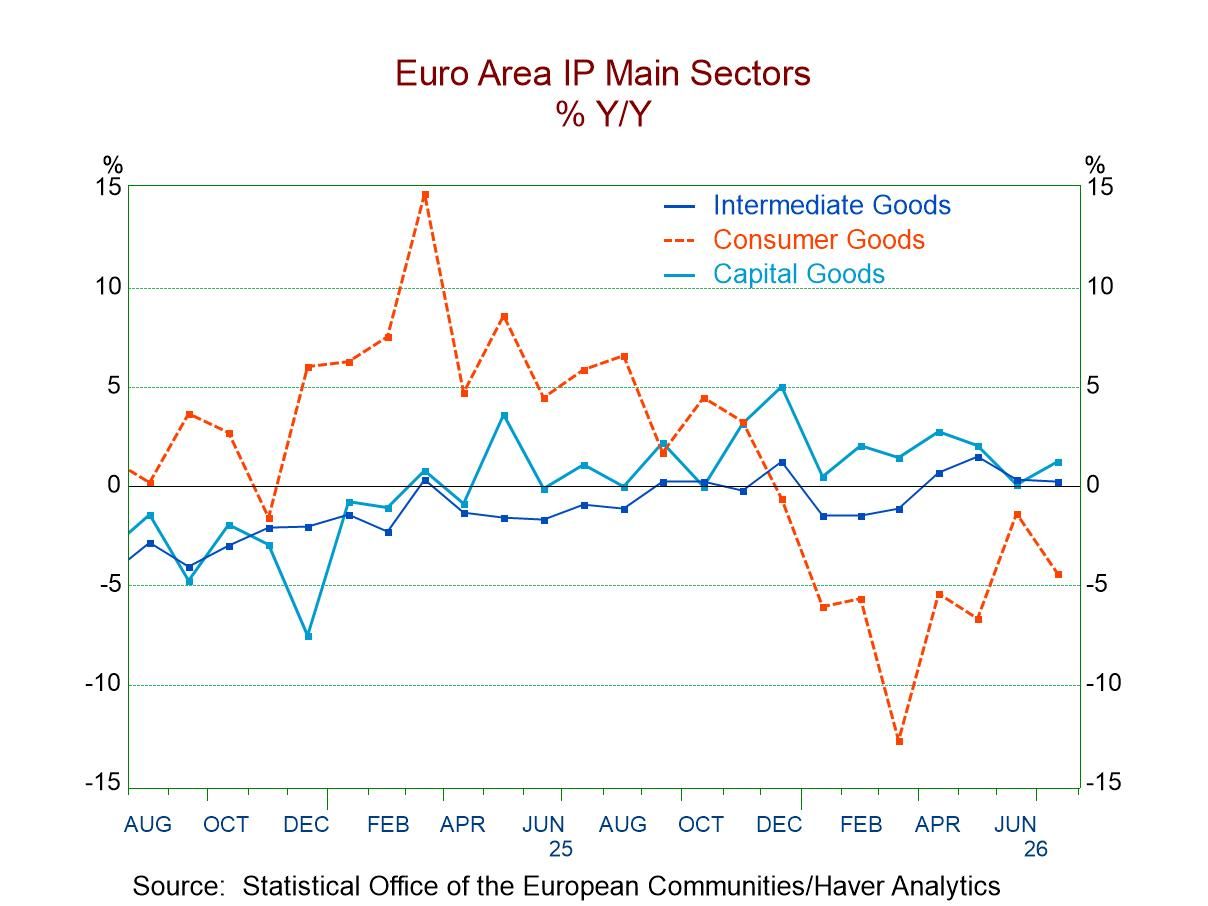
The monetary union graphic seems to show some very gradual longer-term progress underway based on looking at the year-over-year trends by sector. However, the shorter-term trends in the table, for a year and under, are not quite so supportive of optimism.
Monthly Monthly data show that industrial production has really been fluctuating around a zero-growth rate for the last three months, with a July and June drop of 0.1% versus a May increase of 0.2%. Looking at manufacturing alone, there was a drop in July of 0.3%, a June drop of 0.3%, and a flat performance in May. None of this speaks of growing optimism.
Sectors The consolidated monthly sector results show output gains in May and June for consumer goods but a substantial 1.5% drop in July. Intermediate goods output declined in May and June versus a small increase in July. Capital goods output was simply ragged, with a 0.4% increase in May, a 1.8% decline in June, and a 0.5% increase in July; it's hard to know what to make of that choppy performance.
Sequential growth in output Switching over to look at the sequential trends, that is, the pattern of growth rates from 12 months to six months to three months, what you see for the headline series is output falling by 0.2% over 12 months, rising at a 2.3% annual rate over six months, and then going flat over three months. Manufacturing industrial production shows an erratic loss and gain, and then a loss over three months. Consumer goods are encouraging on this timeline, with output falling by 4.4% over 12 months, rising by 5.9% at an annual rate over six months, and accelerating to a 13% annual rate over three months. Both consumer durables and nondurables output show acceleration; this is a rare bright spot in this report. Intermediate goods output shows acceleration from 12 months to six months and then a step back from a six-month growth rate of 2.5% to a 4% decline at an annual rate. Capital goods have the same characteristics, with a 12-month and six-month gain on the books and then a 3.8% annual rate decline over three months.
Quarter-to-date trends Quarter-to-date data, which is a nascent calculation since this report is for July, show declines underway for overall output, manufacturing, intermediate goods, and capital goods. The consumer goods categories are all showing increases in the quarter to date to offset the weakness in intermediate and capital goods, but still not enough to put an increase into the headlines.
Percentile standings The percentile standings, which rate the growth rates in a historic context since late 2006, show that only intermediate goods have an annual growth rate that registers above its median, and even then, it only has a 54.2 percentile standing. Capital goods come close to a neutral standing with a 46.2 percentile standing but consumer goods’ annual growth rate is very weak and logs a bottom-10-percentile standing.
Country detail monthly Country detail is not very reassuring, with six monetary union countries showing declines in July, the same as in June, compared to seven showing declines in May. This is for a small group of 12 countries that we track in the table. The medians for this group show declines in May, June, and July.
Countries sequentially Tracking the sequential trends for these 12 countries produces eight declines over three months, six declines over six-months, and seven declines over 12 months. The medians for each span are negative growth rates, and the negative growth rates get larger from 12 months to six months to three months, not a reassuring development. Also, statistics on the percent of reporters accelerating are below 50% for all periods. Over three-months, 18.2% of the countries are showing acceleration compared to six months, while over 12 months only 9.1% of the reporters are showing acceleration compared to the previous 12-month period.
Percentile standing by countries: weakness prevails Among the countries, only four show industrial production with year-over-year growth rates above their historic medians. The Netherlands leads the pack with a 93.3 percentile standing, followed by Finland with an 81.9 percentile standing, Malta with a 55.5 percentile standing, and Spain with a 52.9 percentile. The three largest monetary union economies have industrial production with annual growth rates ranking in the 20th percentile for Germany and France, while Italy is in its 47th percentile.
Summing up The weak showing in the latest data embodies weak trends. Recent months are weak as well, but more in a floundering way than in a deteriorating way. But the three-month growth rates taken together show more weakness than floundering. It’s not a reassuring report.
 USA| Sep 16 2026
U.S. Import and Export Prices Jump in August
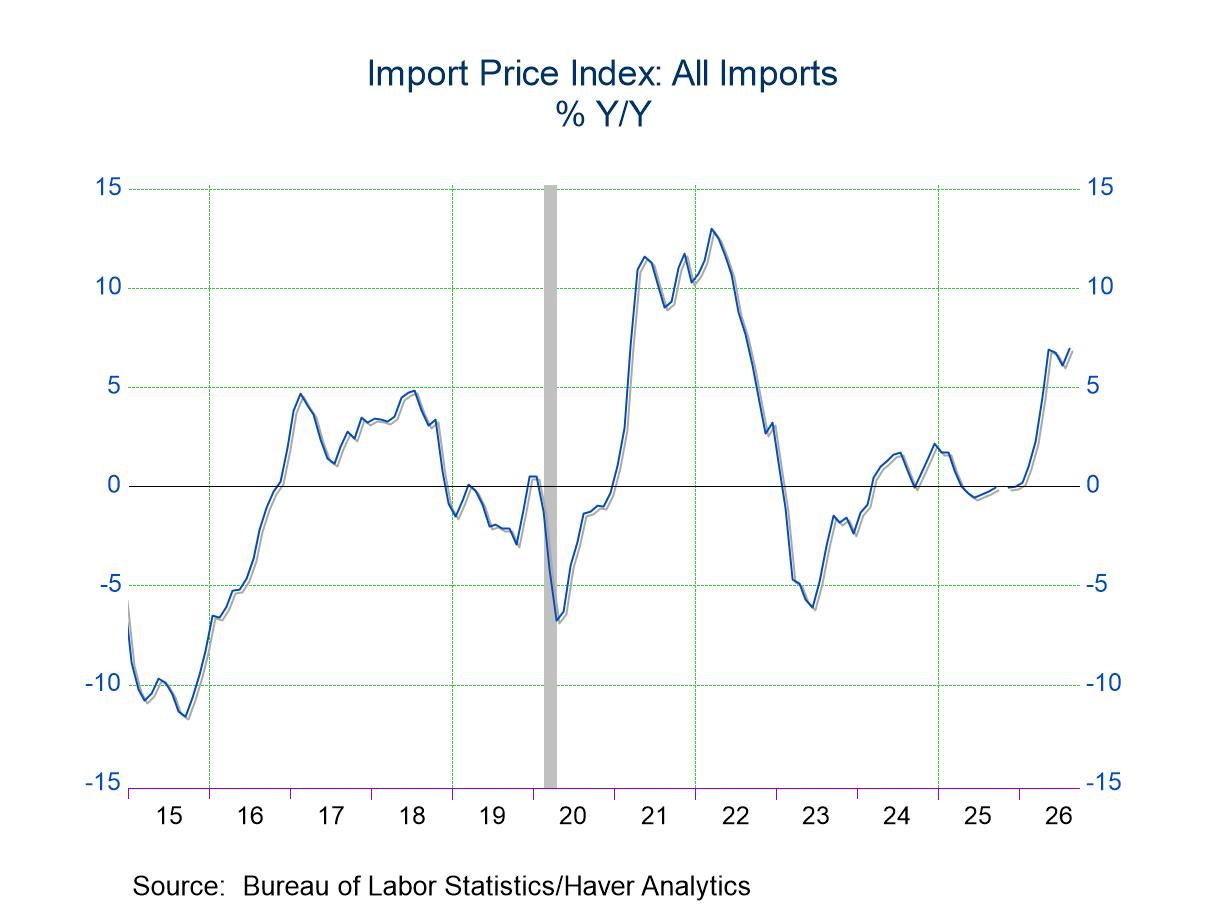
- Counter to market expectations for small declines, both import and export prices rose meaningfully in August.
- Import prices increased 0.7% m/m while export prices rose 0.6% m/m. Both had fallen in June and July, helped by falling petroleum prices.
- Petroleum prices edged up 0.1% m/m in August.
- Price increases were relatively widespread across end-use categories.
by:Sandy Batten
|in:Economy in Brief
 USA| Sep 16 2026
U.S. Mortgage Applications Declined in the September 11 Week
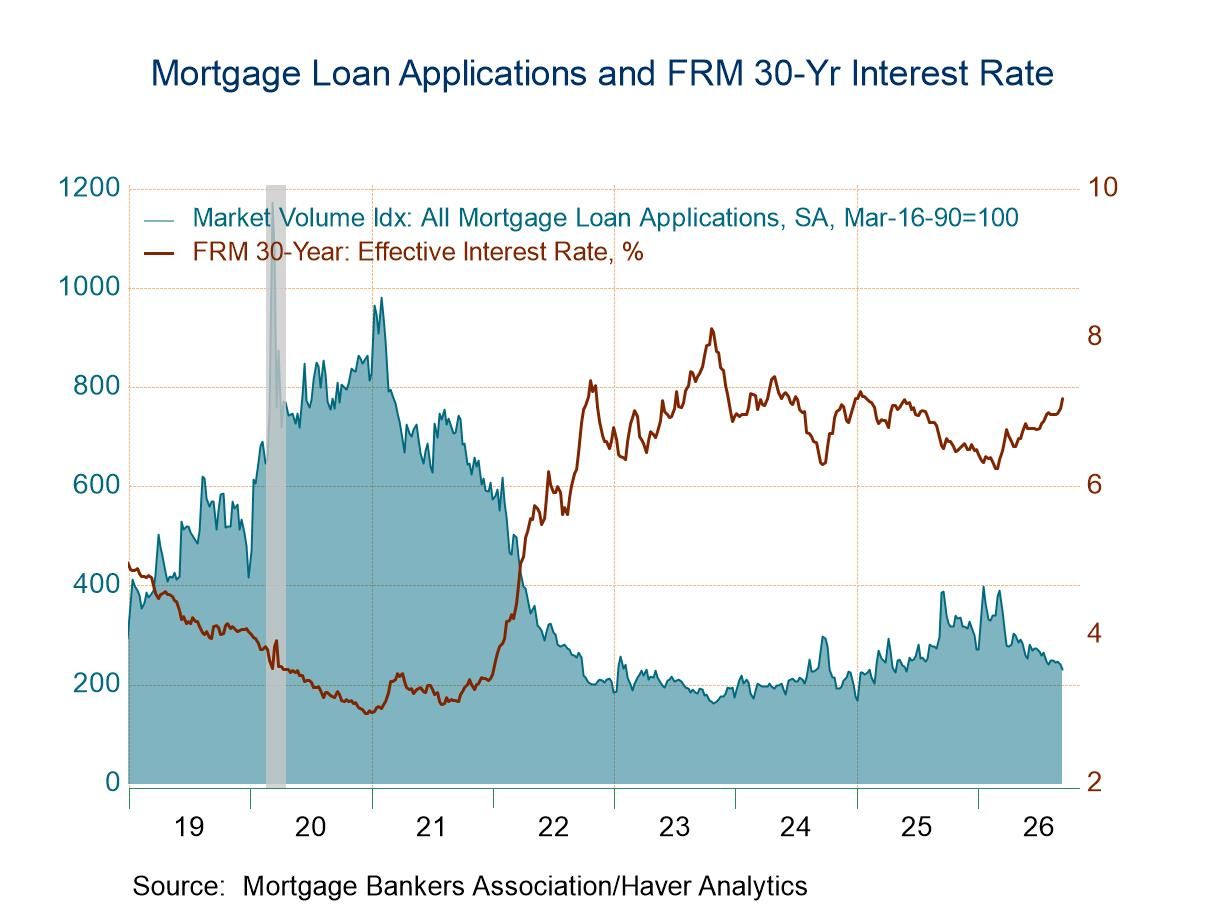
- Applications for loans to purchase a house and applications for loan refinancing both declined in the latest week.
- Interest rate on 30-year fixed-rate loans rose 13bp to 7.18%.
- Average loan size fell moderately in the September 11 week.
 USA| Sep 15 2026
U.S. Empire State Manufacturing Index Cools Sharply in September
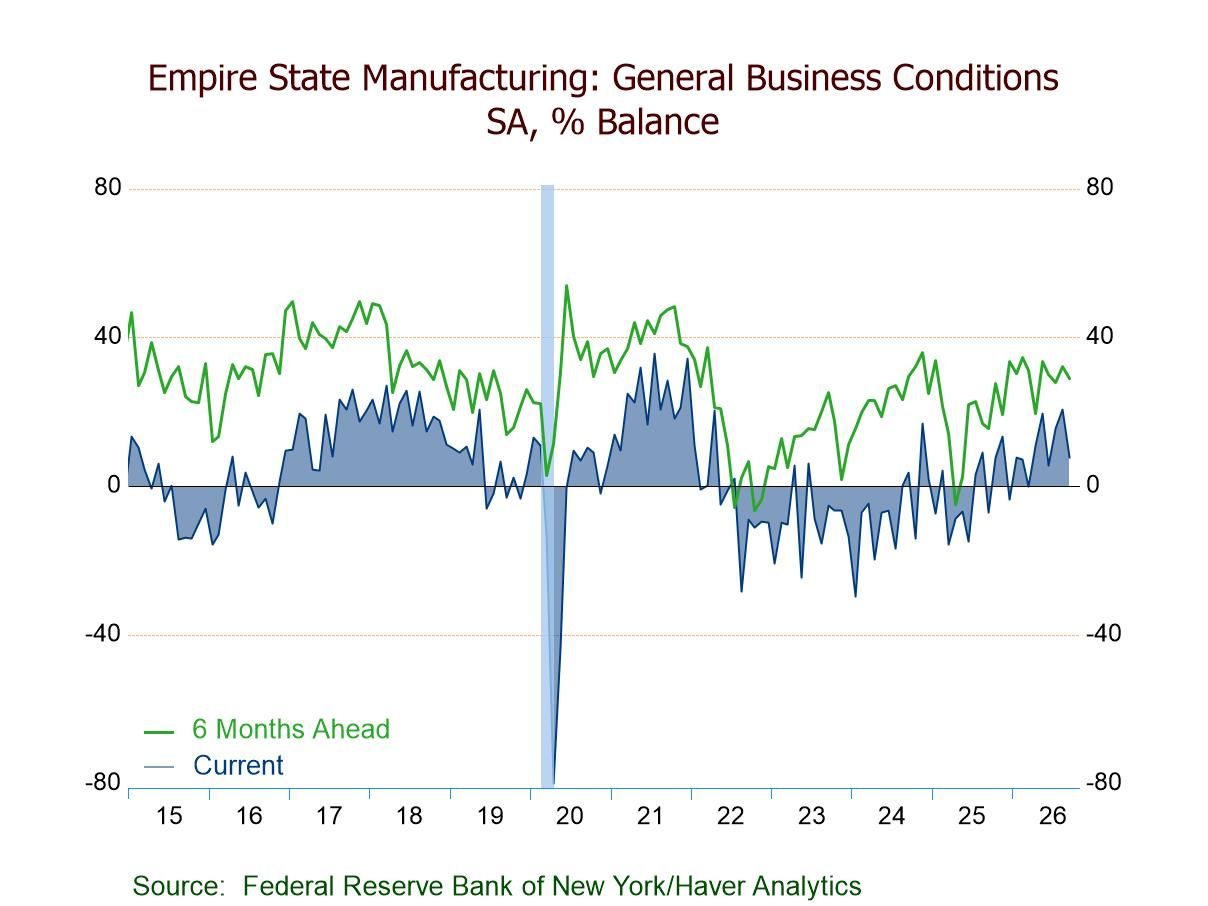
- General Business Conditions Index down 13.0 pts. to 7.6 in Sept.; sixth straight expansion.
- New orders (2.0), down 15.3 pts.; weakest level since Dec. ’25, still indicating expansion.
- Shipments (-3.2), down 14.9 pts.; first negative reading since March.
- Unfilled orders (5.9), down 9.6 pts. but staying positive; inventories (8.9), highest since May.
- Employment (10.6), up 1.3 pts.; eighth consecutive expansion.
- Prices paid (63.1), highest since July '22; prices received (28.1), a three-month high.
- Firms still optimistic: Future Business Conditions Index down to a still-expansionary 29.0; future prices paid rising to 67.3, highest since June ’22.
- of61Go to 2 page